Tesla Stock Lifts 2025 Gains to 20% as Traders Eye Santa RallyA megacap squeezing in one more rally before year-end? Yes, please.
🚗 A Holiday Glide Higher for Tesla Shares
Tesla NASDAQ:TSLA is heading into December with solid momentum. Coming into Monday, the stock has risen 20% since January, putting it on track for a third straight annual gain .
Inv

The best trades require research, then commitment.
Get started for free$0 forever, no credit card needed

Scott "Kidd" PoteetThe unlikely astronaut

Where the world does markets
Join 100 million traders and investors taking the future into their own hands.

GBPUSD: Rallies Are Getting Sold, & Dollar Still Has Upper HandEvery time GBPUSD tries to lift its head, it seems to run straight into supply. Zooming out, this chart feels like a classic distribution phase after a strong first-half rally. Fundamentally, that makes sense. Sterling has lost its earlier policy edge, while the dollar continues to benefit from re

Velocity Of Money Rolling Over Again!The Real Interpretation
This chart is telling one story:
Money supply growth has massively outpaced real output for decades.
It lines up perfectly with:
Falling real productivity
Stagnant wages
Declining borrower quality
Rising debt-to-GDP
Asset inflation decoupling from fundamentals
T

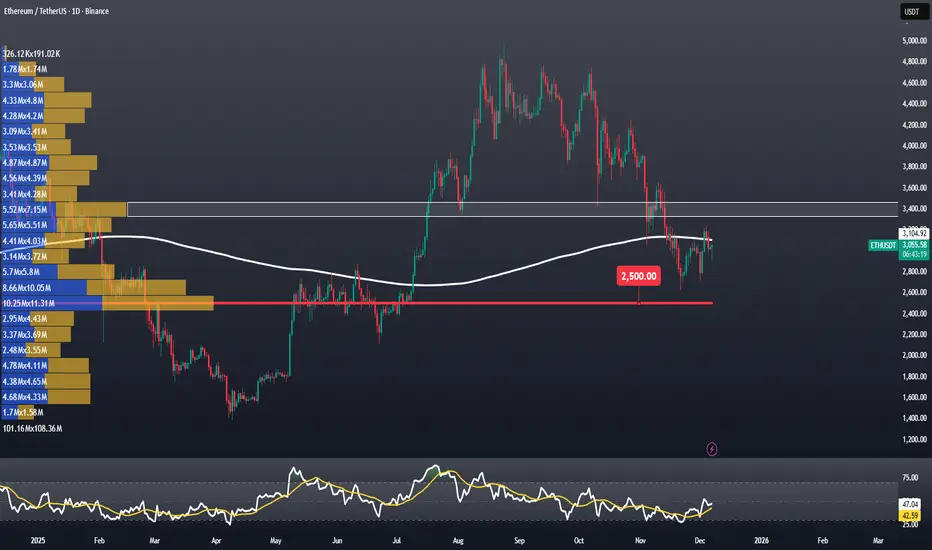
Why Does Ethereum Need a Weekly Close Above $3,100?Why Does Ethereum Need a Weekly Close Above $3,100?
Ethereum is currently trading around $3,035, while the SMA365 sits near $3,100. A weekly close above this level would give ETH investors some breathing room. If ETH can secure a close above the SMA365, we could expect a relief rally toward $3,689,
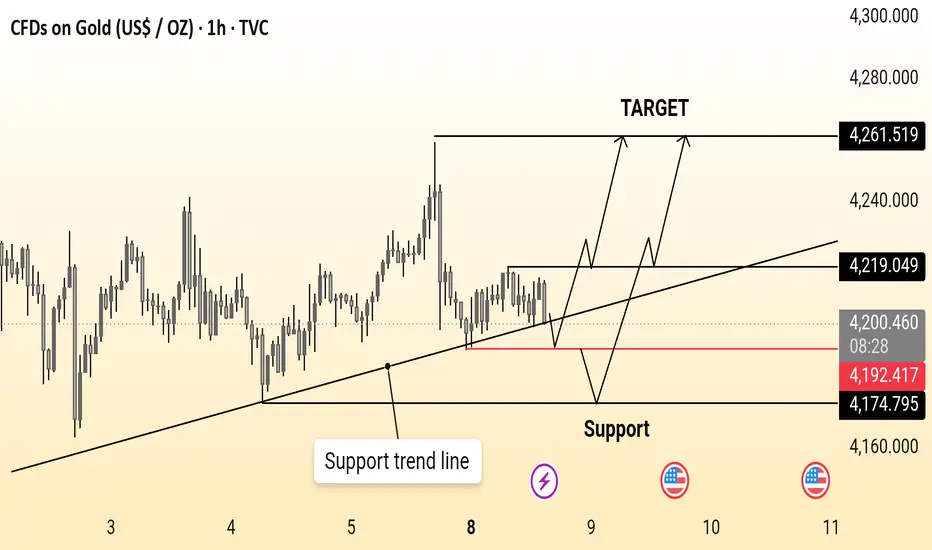
GOLD 1H CHART ROUTE MAP UPDATE & TRADING PLAN FOR THE WEEKHey Everyone,
Please see our 1h chart levels and targets for the coming week, which is still active and in play.
We are seeing price play between two weighted levels with a gap above at 4221 and a gap below at 4169, as support. We will need to see ema5 cross and lock on either weighted level to de

IBEX 35 Hits Historic LevelIBEX 35 Hits Historic Levels, Facing the Challenge of Winning Back Retail Investors
Ion Jauregui – Analyst at ActivTrades
01/12/2025
The IBEX 35 has officially returned to territory unseen since 2007. The Spanish benchmark is trading at historic highs and has established itself in 2025 as the b

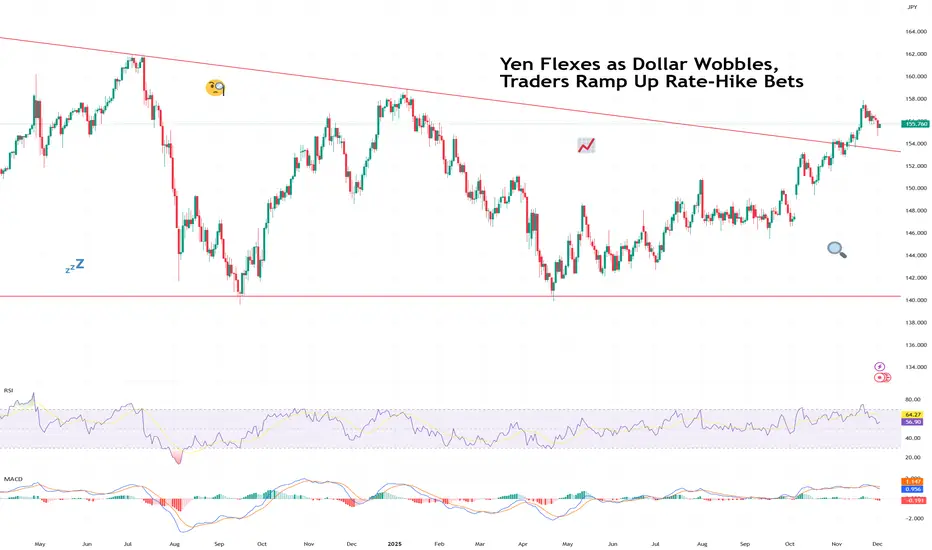
Yen Flexes as Dollar Wobbles, Traders Ramp Up Rate-Hike BetsThe yen came into Monday looking calm… and then proceeded to bench-press the dollar.
The FX:USDJPY pair slid under ¥155, hitting a session low of ¥154.65, after BoJ Governor Kazuo Ueda dropped one of the most powerful phrases in global FX:
“We will weigh the pros and cons of tightening.”
In Tok
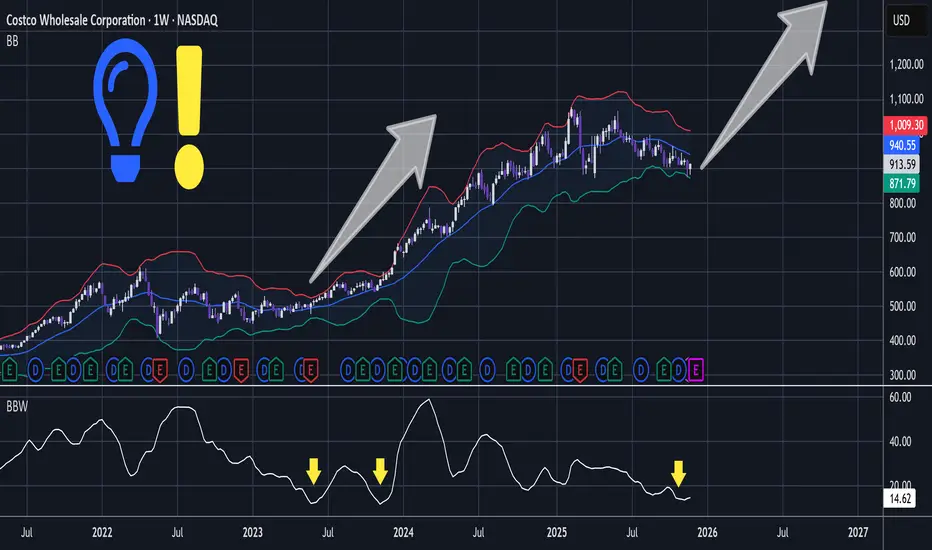
COST - Retail Powerhouse In Ideal HTF PositionShallow compressive action has printed contracting Bollinger Bands.
Notice that the BBW - Bollinger Band Width is similar to the previous correction before breakout.
In lower time frame the significantly sized slump has whipsawed through support and wedge trendline to become a bullish engulf:
T
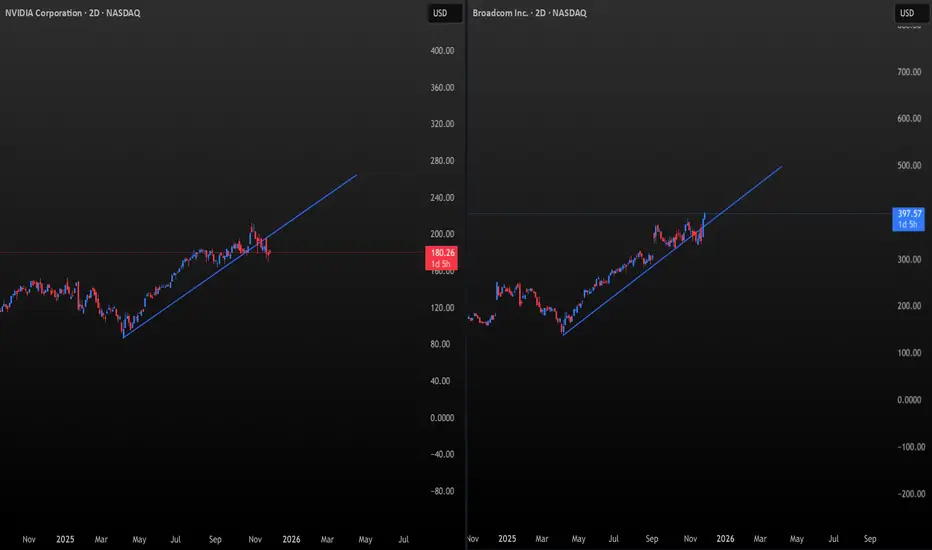
NVDA vs AVGO: The Battle for the AI Throne Has Begun⚡A New Leader Emerges in the Semiconductors
For years, NVDA was the undisputed titan — the gravitational center of the semiconductor universe.
But now, the geometry tells a different story.
THE CHARTS 📐
Both charts use the same natural scaling:
1° of time = $1 of price per unit.
And here’s the
SPX to Money Supply WARNING!If the charts aren’t showing bubble setups, I’m not going to invent them. I post what the data shows. So please don’t shoot the messenger when I say GTFO & STFO.
And just to keep the facts straight:
Brokerage, stock, and crypto accounts are not part of M2.
Why does M2 matter?
It’s the actual spe

See all editors' picks ideas
Volume Gaps & Imbalances (Zeiierman)█ Overview
Volume Gaps & Imbalances (Zeiierman) is an advanced market-structure and order-flow visualizer that maps where the market traded, where it did not, and how buyer-vs-seller pressure accumulated across the entire price range.
The core of the indicator is a price-by-price volume prof

Match Finder [theUltimator5]Match Finder is the dating app of indicators. It takes your current ticker and finds the most compatible match over a recent time period. The match may not be Mr. right, but it is Mr. right now. It doesn't forecast future connection, but it tells you current compatibility for today.
Jokes aside,

Trend Line Methods (TLM)Trend Line Methods (TLM)
Overview
Trend Line Methods (TLM) is a visual study designed to help traders explore trend structure using two complementary, auto-drawn trend channels. The script focuses on how price interacts with rising or falling boundaries over time. It does not generate trade sign

Breakouts & Pullbacks [Trendoscope®]🎲 Breakouts & Pullbacks - All-Time High Breakout Analyzer
Probability-Based Post-Breakout Behavior Statistics | Real-Time Pullback & Runup Tracker
A professional-grade Pine Script v6 indicator designed specifically for analyzing the historical and real-time behavior of price after strong All-Ti

Count█ OVERVIEW
A library of functions for counting the number of times (frequency) that elements occur in an array or matrix.
█ USAGE
Import the Count library.
import joebaus/count/1 as c
Create an array or matrix that is a `float`, `int`, `string`, or `bool` type to count elements from, t

Holographic Market Microstructure | AlphaNattHolographic Market Microstructure | AlphaNatt
A multidimensional, holographically-rendered framework designed to expose the invisible forces shaping every candle — liquidity voids, smart money footprints, order flow imbalances, and structural evolution — in real time.
---
📘 Overview
The Hol

PriceFormatLibrary for automatically converting price values to formatted strings
matching the same format that TradingView uses to display open/high/low/close prices on the chart.
█ OVERVIEW
This library is intended for Pine Coders who are authors of scripts that display numbers onto a user's charts. T

LogNormalLibrary "LogNormal"
A collection of functions used to model skewed distributions as log-normal.
Prices are commonly modeled using log-normal distributions (ie. Black-Scholes) because they exhibit multiplicative changes with long tails; skewed exponential growth and high variance. This approach i

Range Oscillator (Zeiierman)█ Overview
Range Oscillator (Zeiierman) is a dynamic market oscillator designed to visualize how far the price is trading relative to its equilibrium range. Instead of relying on traditional overbought/oversold thresholds, it uses adaptive range detection and heatmap coloring to reveal where pri

Volume Surprise [LuxAlgo]The Volume Surprise tool displays the trading volume alongside the expected volume at that time, allowing users to spot unexpected trading activity on the chart easily.
The tool includes an extrapolation of the estimated volume for future periods, allowing forecasting future trading activity.
🔶 U

See all indicators and strategies
Community trends
Tesla Stock Lifts 2025 Gains to 20% as Traders Eye Santa RallyA megacap squeezing in one more rally before year-end? Yes, please.
🚗 A Holiday Glide Higher for Tesla Shares
Tesla NASDAQ:TSLA is heading into December with solid momentum. Coming into Monday, the stock has risen 20% since January, putting it on track for a third straight annual gain .
Inv
AMZN Options Alert: High-Potential Swing PlayInstrument: AMZN
Signal Type: Swing Trade
Direction: BUY CALLS (though note Katy AI predicts short-term bearish bias)
Confidence: Medium (65%)
Strike Focus: $220
Entry Price: $2.36 – $2.40
Target 1: $4.72 (≈100% gain)
Target 2: $7.08 (≈200% gain)
Stop Loss: $1.18 (≈50% loss)
Expiry: 17 days (2025-12

UNH: 50% Inception"All I want to buy in 2025 is Healthcare" has been what I've told people that ask me about this tech stock or that AI company. It is my nature to look for what sector is the most downtrodden and find opportunity there... NOT in what "everyone" is talking about. I still feel that way as 2025 comes

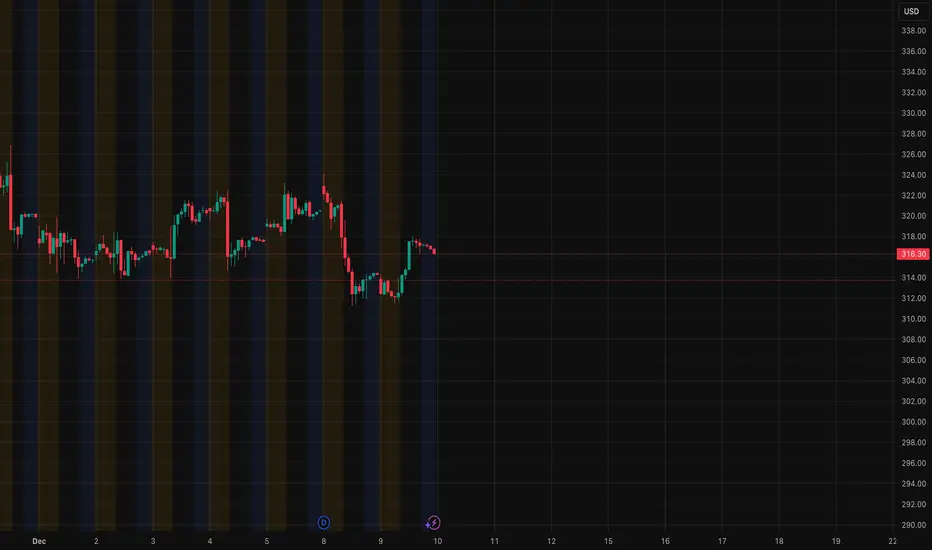
GOOGL at a Key Decision Zone — Dec. 10 TA with GEX InsightGOOGL continues to respect one of the most important levels on its chart: the 311–312 zone. Every time price dips into this area, it gets absorbed instantly, creating a solid base for the recent recovery. That kind of repeated defense usually means real buyers are sitting there, not just random boun
UBER shortSupply Zone had been confirmed
Looks like ABC Pattern.
Stop 93,
Short entry 91
Target 82, 75
Risk management is much more important than a good entry point.
I am not a PRO trader.
In my trading plan, the Max Risk of each short term trade should be less than 1% of an account.

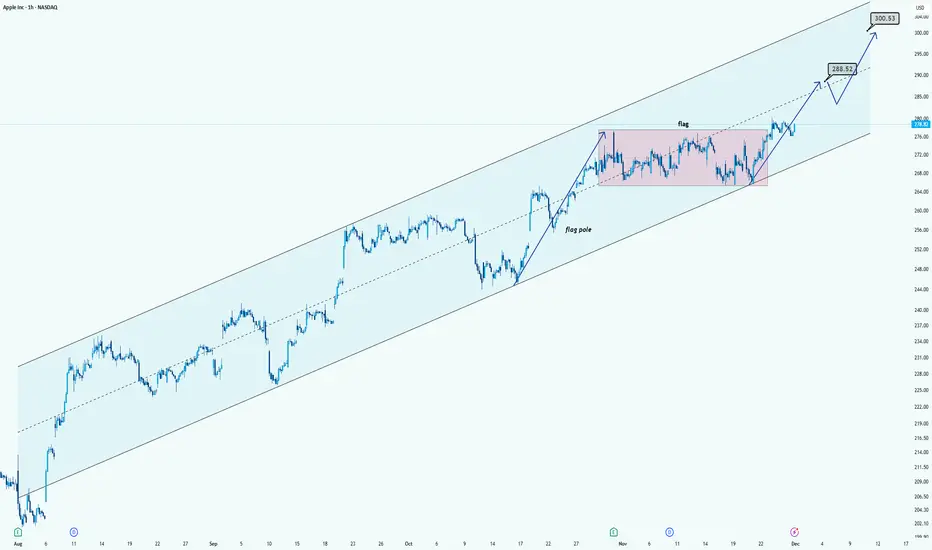
AAPL Chart AnalysisHi!
AAPL is trading inside a clean long-term ascending channel, showing a strong uptrend. Recently, the price formed a bullish flag (pink zone) after a sharp move up. The breakout above the flag signals continuation of the trend.
The chart projects two key upside levels:
$288.52 as the first tar
Micron Technology - This bullrun is still not over!💵Micron Technology ( NASDAQ:MU ) can rally a final +25%:
🔎Analysis summary:
Micron Technology retested major support in mid 2025. After we then witnessed textbook bullish confirmation, it was clear that this stock will rally. With the recent move of +300%, Micron Technology is almost back at

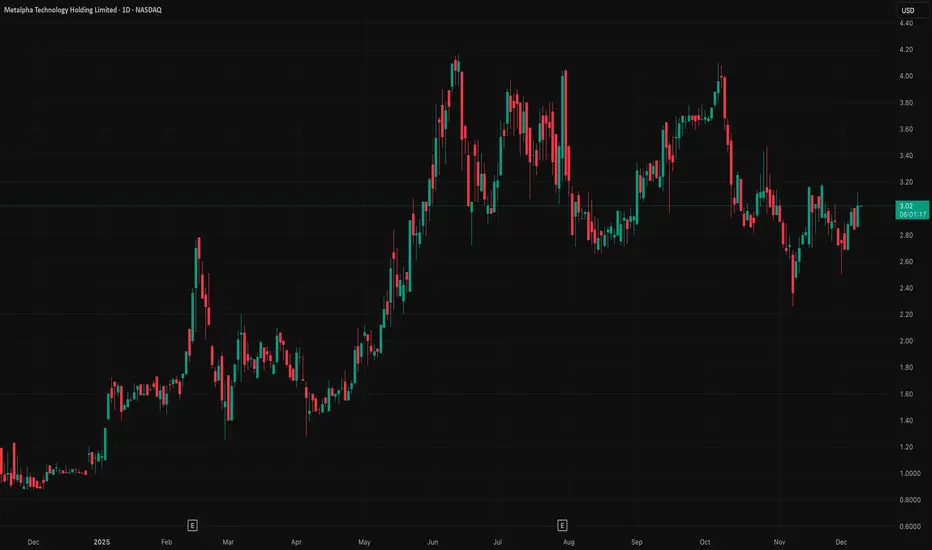
MATH — System A | Research Log
System Data Log
Ticker: MATH
System: A
Position: Long
Entry Date: Dec 09, 2025
System Logic & Observation
This post logs a System A long position for ticker MATH opened on Dec 09, 2025, according to the predefined rules of the system.
The purpose is to observe how the system behaves in real market
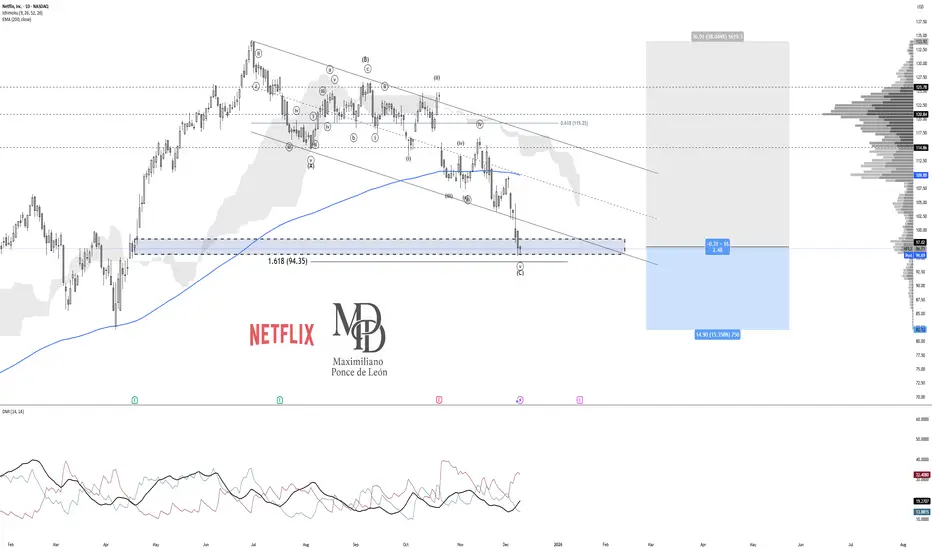
NFLX - Conteo ElliotPossible end of the corrective ABC in NFLX, reaching the 1.618 extension of wave C and reacting in a Demand zone. Entries here seem reasonable with a stop-loss at 82 USD.
For more conservative entries, wait for the 61.8% retracement of the entire ABC (119 USD).
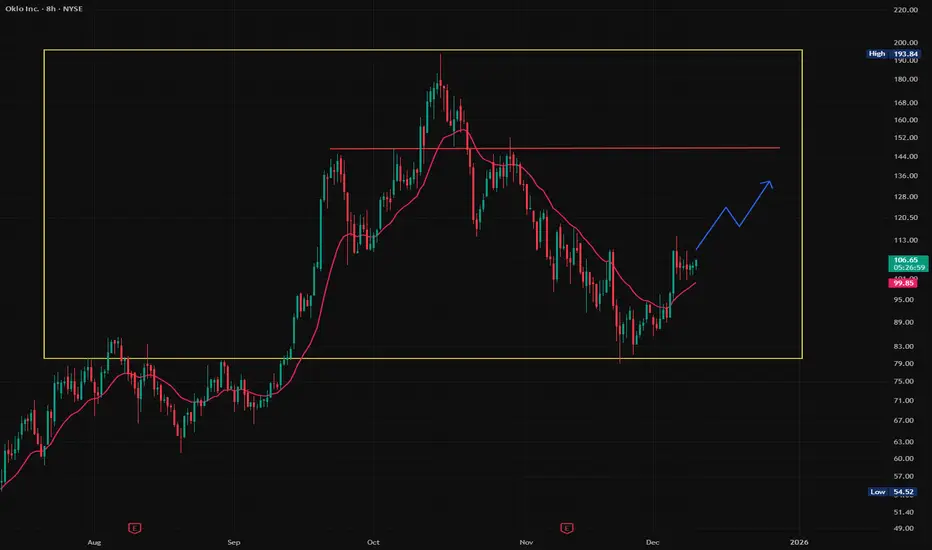
$OKLO — price is carving out a solid bull flag here.Still holding NYSE:OKLO — price is carving out a solid bull flag here. If it breaks, I see $140 as a realistic target over the next few months.
Oklo builds small fission reactors, and reliable baseload power is going to matter more and more as AI demand explodes
See all stocks ideas
Dec 10
UECUranium Energy Corp.
Actual
−0.02
USD
Estimate
−0.01
USD
Dec 10
JILLJ. Jill, Inc.
Actual
0.76
USD
Estimate
0.59
USD
Dec 10
PLABPhotronics, Inc.
Actual
0.60
USD
Estimate
0.45
USD
Dec 10
REVGREV Group, Inc.
Actual
0.83
USD
Estimate
0.78
USD
Dec 10
CHWYChewy, Inc.
Actual
0.14
USD
Estimate
0.12
USD
Dec 10
DAKTDaktronics, Inc.
Actual
0.35
USD
Estimate
0.27
USD
Dec 10
ASYSAmtech Systems, Inc.
Actual
0.07
USD
Estimate
−0.03
USD
Dec 10
SNPSSynopsys, Inc.
Actual
2.90
USD
Estimate
2.78
USD
See more events
Today
LMRILumexa Imaging Holdings Inc.
Exchange
NASDAQ
Offer price
17.00 - 25.00
USD
Tomorrow
W
WLTHWealthfront Corp.
Exchange
NASDAQ
Offer price
12.00 - 14.00
USD
Tomorrow
S
SFDXSFIDA X Inc.
Exchange
NASDAQ
Offer price
5.00 - 6.00
USD
Dec 15
R
RIKURiku Dining Group Ltd.
Exchange
NASDAQ
Offer price
4.00 - 6.00
USD
Dec 15
DTDTDt House Ltd.
Exchange
NASDAQ
Offer price
4.00 - 5.00
USD
Dec 15
ELCGELC Group Holdings Ltd.
Exchange
NASDAQ
Offer price
4.00 - 6.00
USD
Dec 16
U
UPXUptrend Holdings Ltd.
Exchange
NASDAQ
Offer price
4.00 - 5.00
USD
Dec 17
A
ANDGAndersen Group Inc.
Exchange
NYSE
Offer price
14.00 - 16.00
USD
Dec 17
MDLNMedline Inc.
Exchange
NASDAQ
Offer price
—
See more events
Community trends
Bitcoin - Sell this upcoming pump! New Bear Flag - Target 74k!I am currently bullish on Bitcoin in the short term, and I believe Bitcoin will hit 96k, probably this week. The current price is around 91k, so this is definitely a good opportunity to sell or open a short position at 96k on futures because later this month/in January Bitcoin will most likely conti

BITCOIN Why nobody talks about this??That was the last indicator standing and now it is as clear as it can get. With last month's candle close, Bitcoin (BTCUSD) has confirmed that it has already started a new Bear Cycle.
The reason is simple and it is one of the most basic trading indicators out there. The 1M MACD was already on a Bea

Bitcoin at Critical Resistance — Bull Trap!?Over the past couple of hours, Bitcoin ( BINANCE:BTCUSDT ) has surprised many traders—including myself—with its sharp movements. The potential reason behind this could be an anticipated interest rate cut tomorrow. However, the recent JOLTS Job Openings did not fully align with that expectation.
Wi

BTCUSD Buyers Defend Support — Market Targets $91,5K — $93K ZoneHello traders! Here’s my technical outlook on BTC/USD based on the current market structure. After a strong bullish recovery from the lower demand area near $83,500–$85,000, the price formed a steady impulsive move upward and entered a consolidation phase inside the marked range below the key $93,00

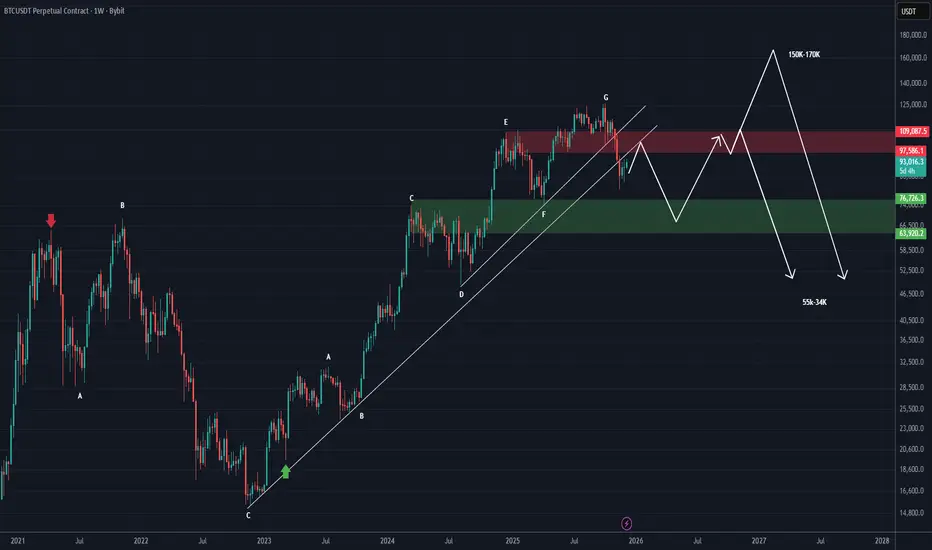
Bitcoin RoadMap (1W) | Important UpdateIt’s better to first have a complete roadmap for Bitcoin for the coming months.
We have cleaned up the chart as much as possible, making the pattern lines and range zones invisible so the chart remains uncluttered.
As you can see, Bitcoin is trading below the upward trendlines and also below the F
BTC/USD 4H CHART PATTERNThis BTC/USD chart shows a clean breakout above a long-term downward trendline that has been holding the price lower for several weeks. Each previous touch of this trendline resulted in rejection, but Bitcoin has now broken through with bullish momentum, supported by price action moving above the Ic

BTCUSDT Long: Demand Line Holds — Path Toward 96,500 Opens UpHello, traders! BTCUSDT is respecting the Triangle Demand Line after completing a full bearish cycle inside the descending channel earlier. Sellers maintained control for an extended period, pushing price steadily lower until it reached the pivot point near 88,800, where buyers finally stepped in an

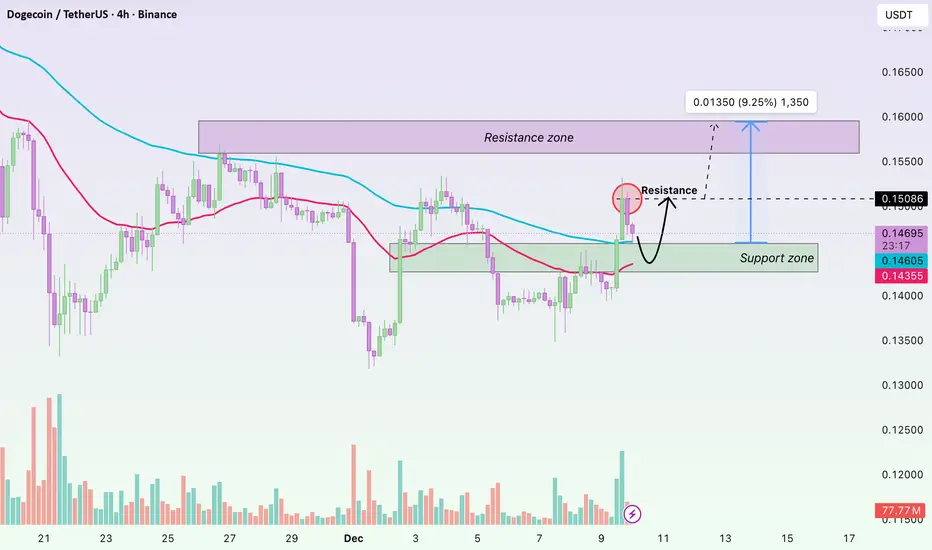
DOGE – Short-Term Breakout: EMA and Volume Support the UptrendHi everyone, Domic here. Dogecoin is showing a strong bullish move after breaking key EMA levels, accompanied by rising volume, indicating that buyers are in control. On the H4 chart, the 34 EMA (red) and 89 EMA (blue) serve as markers of the short-term trend. DOGE moving above both EMAs while form
Solana ~ TRADE The CHOP: 3 Ways to Make ATLEAST +15%Choppy markets are identified by low volume and sideways trading / range trading. It seems uninteresting in most cases, but you don't have to sit around and wait for the next big impulse wave!
Here are three plays YOU can take during choppy markets:
1) 4H : Short Resistance
Chop trading can be a

BITCOIN New LOWS SOON 4th wave has ended ?I had thought we would see 96/101 but the rally seems to have formed a abcde if we can NOT get above 96k fast I would look for this next wave down to have started .I have posted the math as to why 83/84 was important and why we stopped at 80k Fib relationships since the high within t

See all crypto ideas
Lingrid | GOLD Sideways Movement Ahead of FOMC DecisionOANDA:XAUUSD perfectly played out my previous trading idea . Price is holding inside a well-defined consolidation after its prior surge, with price rotating above the rising channel base. The trend remains constructive, but momentum has cooled, suggesting participants are waiting for a catalyst ra

NQ Short (12-09-25)Basically same idea as Monday, not expecting much until Fed Decision. The O/N did use some failed auctions to pump the NAZ above nearside Danger Zone of 25,620-40 to upper resistance and KL 25,735, we are back under DZ at this time. Range today may be 630-730 for next move should the NAZ stay above

XAUUSD (GOLD) Trend Shift Confirmed After Third Drive ReactionHi!
Gold has completed a clear Three-Drive Reversal pattern, with the third drive tapping into the major support zone around 4165–4175. This area has repeatedly acted as a strong demand pocket, and the sharp reaction confirms buyers are still active. Following the third drive, price broke the minor
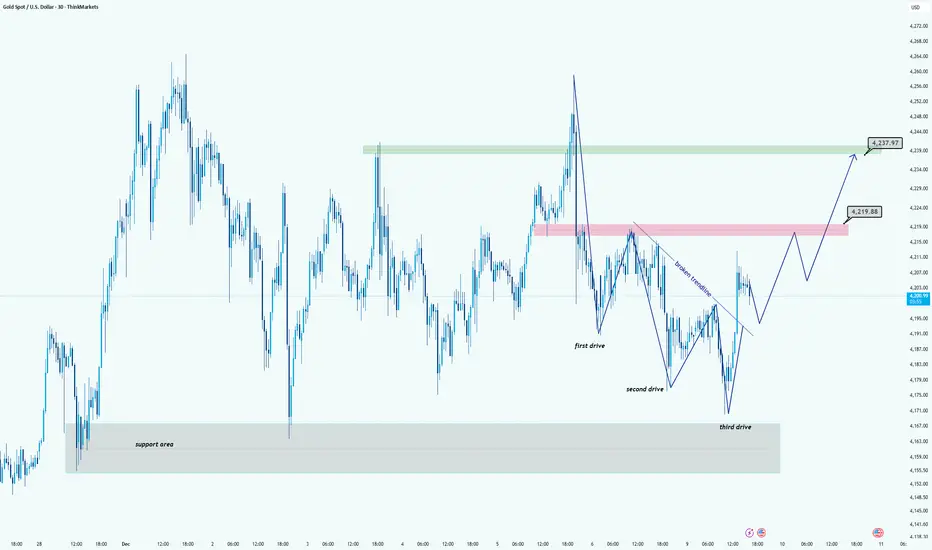
XAUUSD Long: Demand Holds — Price Aiming for $4,260 RetestHello, traders! The current price action on GOLD (XAUUSD) is developing within a clearly defined ascending channel, showing that the broader bullish structure remains intact despite recent corrective movements. Earlier, the market formed a Double Top pattern near the upper Supply Zone around $4,260,

GOLD → Price within range ahead of Fed meeting FX:XAUUSD is consolidating within a wide range amid expectations of the Fed's interest rate meeting. The fact that interest rates will be lowered has most likely already been factored in by the market. There is a possibility of a long squeeze...
New threats of tariffs by Trump (on fertilizers

XAUUSD Range Resistance Holds — Pullback Toward $4,170 in FocusHello, traders! Here’s my technical outlook on GOLD (XAUUSD) based on the current market structure visible on the chart. After a strong rebound from the previous lower demand area, price moved into a steady ascending structure, respecting the rising Support Line and forming higher highs and higher l
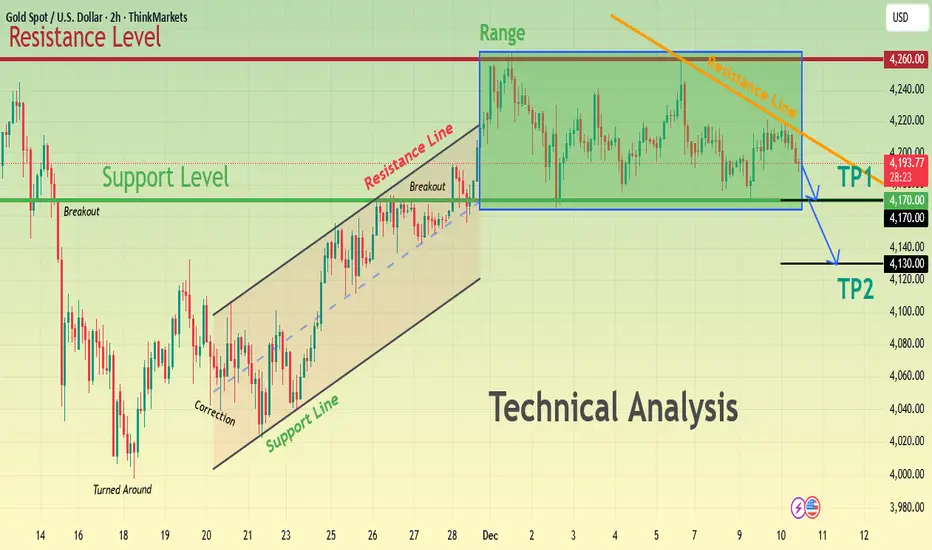
Gold ideaGold (1H) is holding above a rising support trend line, maintaining a bullish structure. As long as price stays above the 4,174–4,192 support zone, a move toward 4,261 remains likely.
XAUUSD: The Uptrend Is Gaining Momentum AgainGold traded cautiously yesterday as investors waited for this week’s FOMC meeting. But this very “quiet phase” is building the foundation for a new upward leg, as the fundamental factors still lean strongly toward the Bulls.
1. The Fed Is Nearing a Policy Shift – A Direct Boost for Gold
Lower int

Gold 1H – Will 4232 Liquidity Trigger Reversal or 4188 Hold Flow🟡 XAUUSD – Intraday Smart Money Plan | by Ryan_TitanTrader (10/12)
📈 Market Context
Gold trades inside a politically-driven liquidity landscape after former U.S. President Donald Trump signaled that rate-cut willingness will be his litmus test for selecting a new Fed Chair.
This comment injects unce

Gold’s Next Big Move: 4,350 Is Within Reach!Hello everyone, it's Helene here!
Gold is looking pretty interesting right now. As mentioned in the previous analysis, the price shot up. But guess what? Right now, it's slightly pulling back, moving in the opposite direction to the previous uptrend, which looks like a familiar bullish flag pattern

See all futures ideas
EURUSD Bearish Outlook After Trendline BreakQuick Summary
After breaking the ascending trendline, EURUSD is expected to continue moving lower. The market may target the previous two lows to collect liquidity, and there is currently no clear buy signal.
Full Analysis
The recent break of the ascending trendline on EURUSD changes the short te

Lingrid | USDJPY Potential Long on Channel BreakoutFX:USDJPY has successfully broken above the descending channel while holding a sequence of higher lows, signaling a structural shift in favor of buyers. The breakout occurred from a former consolidation zone, with price reclaiming and retesting the 155.60–155.70 area, which now acts as short-term s

EURUSD: Price Holds Channel Support, Aiming for 1.1680Hello everyone, here is my breakdown of the current EURUSD setup.
Market Analysis
EURUSD remains in a broader bullish structure, with recent price action developing inside a well-defined ascending channel. After a strong impulsive rally, the pair broke above the previous consolidation zone and co

GBPUSD Poised to Rally as USD Weakens Into December CutIn today's trading session we are monitoring GBPUSD for a buying opportunity around the 1.32900 zone.
GBPUSD remains in a clear uptrend, and is currently in a correction phase, approaching the 1.32900 support and resistance area, where buyers may step back in.
On the fundamental side, the US Dollar

GBP/USD | Get Ready for a Huge Fall ! (Bearish Move Ahead)By analyzing the #GBPUSD chart on the 4 hour timeframe, we can see that price followed the previous analysis perfectly and rallied more than 200 pips, reaching the 1.338 zone. After that strong move, GBPUSD pulled back and is now trading around 1.33080.
If price breaks below the 1.33050 zone, I expe

EURUSD Rising Channel Intact as Price Targets 1.16800 ResistanceHello traders! Here’s my technical outlook on EUR/USD based on the current market structure. After an earlier breakout from the lower consolidation area, the price entered a steady ascending channel, forming a sequence of higher highs and higher lows while respecting the rising Support Line. The pre

EURUSD Consolidates Near 1.1600 Ahead of Fed MoveEURUSD is consolidating around 1.1600 as the market awaits signals from the Fed. The Volume Profile highlights 1.1650 as a major resistance due to concentrated selling, while 1.1550 acts as immediate support thanks to increased trading activity at the lows. Fair Value Gaps around 1.1580 and 1.1650 s

AUDCAD - Stuck in a Range… Bears Eye the Upper Boundary!📦AUDCAD has been moving inside a clear horizontal range , with price repeatedly rejecting the upper resistance zone highlighted in red. Each time price tapped this area, sellers regained control and pushed it downward.
⚔️Price is now approaching that same resistance once again. As long as this zone

CADJPY: Very Risky SHORT - Here's Why...CADJPY: Very Risky SHORT - Here's Why...
CADJPY is about to complete a harmonic bearish pattern. I think the price could reverse direction between 113 - 113.40.
The price is still aggressively rising and the JPY is very weak so far. However, over the past week, the BOJ made two "Verbal Interventi

EURUSD Short: Correction Deepens — Market Targets at 1.1590Hello, traders! The current EURUSD price action shows a well-structured reaction between the Supply and Demand zones, with price respecting key levels and channel formations. Earlier, the market traded inside a Range phase, signaling indecision before breaking the range to the upside and forming a c

See all forex ideas
| - | - | - | - | - | - | - | ||
| - | - | - | - | - | - | - | ||
| - | - | - | - | - | - | - | ||
| - | - | - | - | - | - | - | ||
| - | - | - | - | - | - | - | ||
| - | - | - | - | - | - | - | ||
| - | - | - | - | - | - | - | ||
| - | - | - | - | - | - | - |
Trade directly on the supercharts through our supported, fully-verified and user-reviewed brokers.


