PYPL USPayPal is a rare combination of value and growth.
The company demonstrates strong fundamentals, is strategically focused on the future, and trades at record-low multiples. The combination of financial discipline, capital return, and AI innovation makes it an attractive asset for long-term investor

Black Friday
The greatest deal of the year is here.Get it before the point of no return.

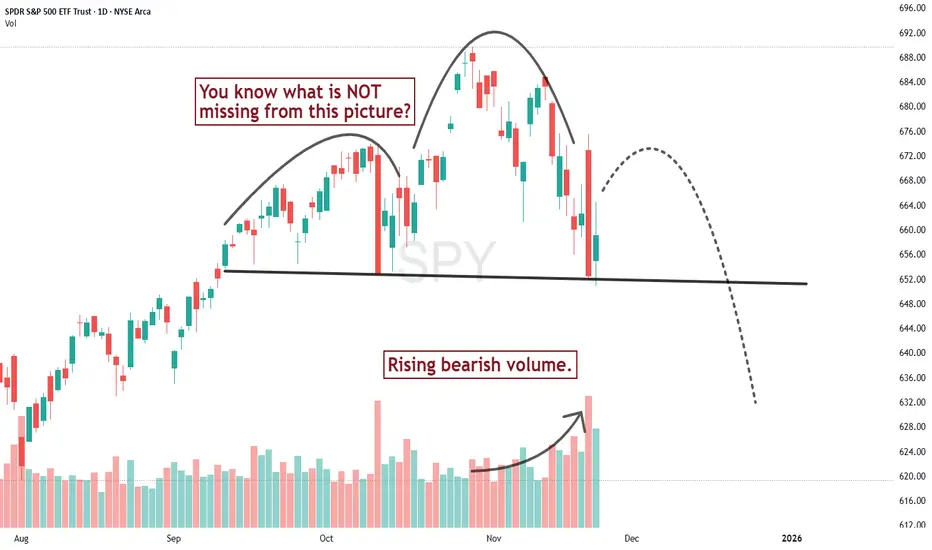
Oh what a difference a day makes!A couple days ago I thought there wasn't sufficient price pattern evidence to talk about a serious change in trend for the S&P 500, mostly because I didn't see the volume pattern confirming the downward slide of the recent high. But Thursday changed that. Redrawing the neckline, we get a chart that
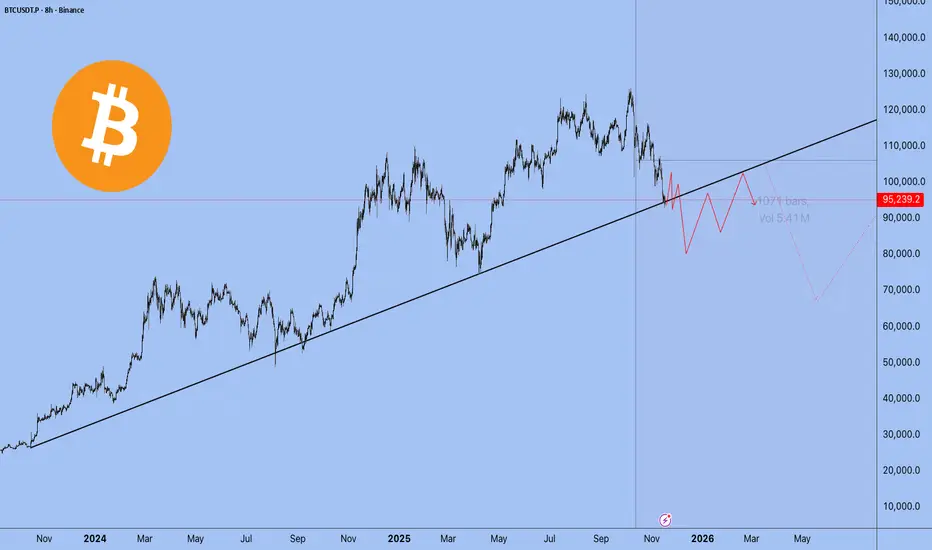
Why This Time Is Not Different — BTC Could Still Drop >50%Bitcoin is moving into a phase where long-term cycles matter more than whatever the market narrative happens to be this week.
And if you look at those cycles, one thing becomes clear: BTC has never avoided a major drop after making a new ATH.
1. The timing keeps repeating — almost to the day
Every

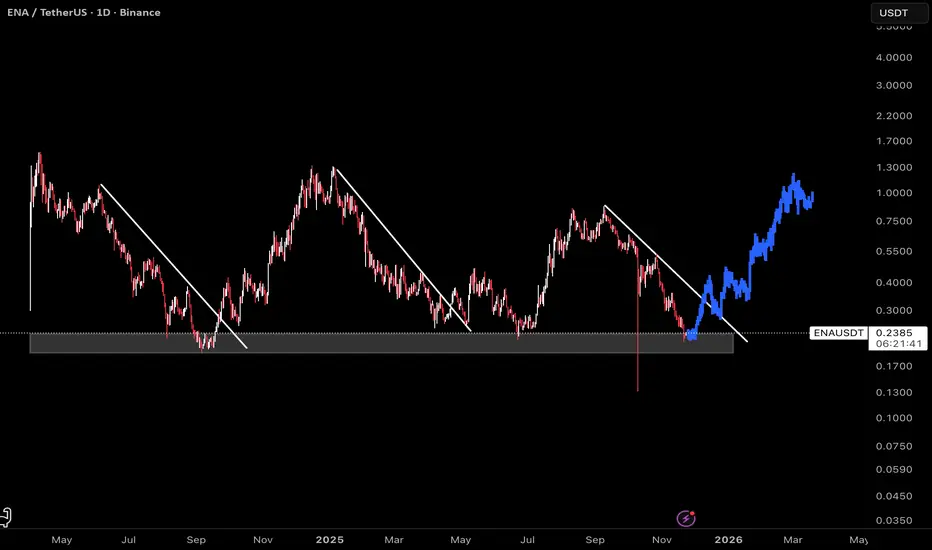
ENA: Bullish SetupThis chart displays ENA on a daily timeframe, with clear structure pointing to a favorable long entry. The current price action is trading within a major support zone, where previous trendline breaks have consistently marked the start of impulsive moves.
Historically, every time ENA breaks out abov
Analysis for What’s Coming - AI Bubble Sentiment The US markets have been described as “on a rally” for quite some time. I would not agree if it is meant to describe the overall US market, but would agree if it refers specifically to AI or tech stocks. Why?
Among the four major US indices, the Russell—representing a much broader base of US-listed

Nvidia Earnings Finally Ease Market Jitters. Are AI Bulls Back?It’s confirmed. This is Nvidia’s stock market and we all live in it.
Nvidia NASDAQ:NVDA reported yet another record-breaking quarter, instantly soothing market nerves after a week filled with talks of “AI bubble,” “valuation fever,” and “maybe Michael Burry is right again.” It was the cherry of t

META now close to a critical trendlineMETA is approaching a significant technical region.
The trendline currently in focus originated on 31 October 2022, and it has remained relevant over time.
This same trendline was retested twice in April of this year, and price action is once again moving toward it after achieving a new all-time

SOL — Deep Pullback Into Major SupportSOL has been in a steady freefall over the past weeks. On the higher timeframes the key support and resistance zones are very clearly defined. The $250 level acted as a big resistance area, with multiple rejections showing sellers were firmly in control up there.
On the downside, the $125 support z

The Market is at 80°C. What Happens at 100°C?Greetings, everyone.
Today, I don't want to talk about the news. I want to talk about what truly matters: market structure. Many traders are currently looking for a news event to explain the current lull and predict Bitcoin's next move. They are looking in the wrong direction.
Remember this: the n
XAUUSD Long: Buyers Eye Push Toward $4,100 ResistanceHello traders! XAUUSD is developing a clear technical structure after reacting multiple times to both the Supply and Demand zones, forming a well-defined pattern of price behavior. Recently, Gold rejected the Supply Line after creating a new Pivot Point near the $4,230 area — the same region where a

See all editors' picks ideas
Count█ OVERVIEW
A library of functions for counting the number of times (frequency) that elements occur in an array or matrix.
█ USAGE
Import the Count library.
import joebaus/count/1 as c
Create an array or matrix that is a `float`, `int`, `string`, or `bool` type to count elements from, t

Holographic Market Microstructure | AlphaNattHolographic Market Microstructure | AlphaNatt
A multidimensional, holographically-rendered framework designed to expose the invisible forces shaping every candle — liquidity voids, smart money footprints, order flow imbalances, and structural evolution — in real time.
---
📘 Overview
The Hol

PriceFormatLibrary for automatically converting price values to formatted strings
matching the same format that TradingView uses to display open/high/low/close prices on the chart.
█ OVERVIEW
This library is intended for Pine Coders who are authors of scripts that display numbers onto a user's charts. T

LogNormalLibrary "LogNormal"
A collection of functions used to model skewed distributions as log-normal.
Prices are commonly modeled using log-normal distributions (ie. Black-Scholes) because they exhibit multiplicative changes with long tails; skewed exponential growth and high variance. This approach i

Range Oscillator (Zeiierman)█ Overview
Range Oscillator (Zeiierman) is a dynamic market oscillator designed to visualize how far the price is trading relative to its equilibrium range. Instead of relying on traditional overbought/oversold thresholds, it uses adaptive range detection and heatmap coloring to reveal where pri

Volume Surprise [LuxAlgo]The Volume Surprise tool displays the trading volume alongside the expected volume at that time, allowing users to spot unexpected trading activity on the chart easily.
The tool includes an extrapolation of the estimated volume for future periods, allowing forecasting future trading activity.
🔶 U

Smooth Theil-SenI wanted to build a Theil-Sen estimator that could run on more than one bar and produce smoother output than the standard implementation. Theil-Sen regression is a non-parametric method that calculates the median slope between all pairs of points in your dataset, which makes it extremely robust to o

Fair Value Gaps by DGTFair Value Gaps
A refined, multi-timeframe Fair Value Gap (FVG) detection tool that brings institutional imbalance zones to life directly on your chart.
Designed for precision, it visualizes how price delivers into inefficiencies across chart, higher, and lower (intrabar) timeframes — offering a fl

TASC 2025.11 The Points and Line Chart█ OVERVIEW
This script implements the Points and Line Chart described by Mohamed Ashraf Mahfouz and Mohamed Meregy in the November 2025 edition of the TASC Traders' Tips , "Efficient Display of Irregular Time Series”. This novel chart type interprets regular time series chart data to create an ir

Simplified Percentile ClusteringSimplified Percentile Clustering (SPC) is a clustering system for trend regime analysis.
Instead of relying on heavy iterative algorithms such as k-means, SPC takes a deterministic approach: it uses percentiles and running averages to form cluster centers directly from the data, producing smoo

See all indicators and strategies
Community trends
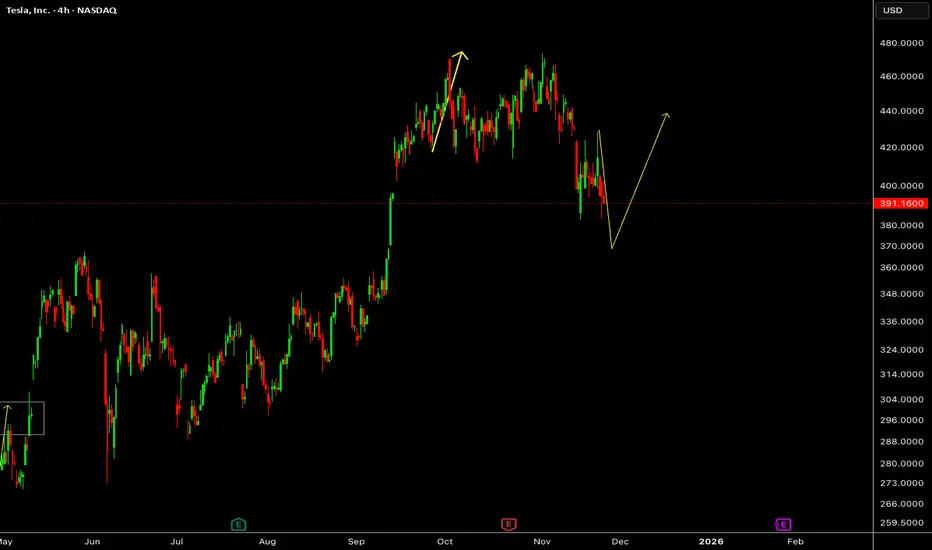
TSLA – Downside Extension Followed by Potential Rebound PhaseTesla has continued to slide after its recent peak, with price action forming a deeper corrective leg. The latest reaction suggests a rebound scenario may develop if momentum begins to shift, paving the way for a possible recovery sequence in the coming sessions.
Disclosure: We are part of Trade Na
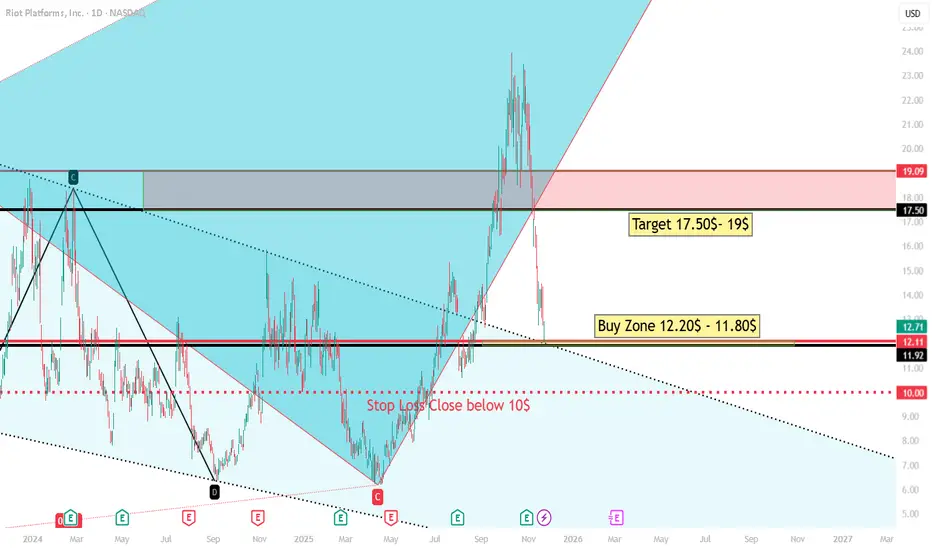
Riot📊 Riot Platforms (RIOT) – Technical Analysis
1. Current Price Action
The stock is trading around $12.7, showing a sharp pullback after a strong rally. The recent decline brought price back into a previously established demand/support region.
2. Key Levels
🔵 Buy Zone: $12.20 – $11.80
This zone is
TSLA:Truncated 5th at 474 A-Bottom 382 Confirmed-3Scenarios MapTSLA: Truncated 5th at 474 ☠️ A-Bottom 382 Confirmed – 3 Scenarios Mapped: B to 440/460 or Bust? C-Targets 287-367 + Fed Cut Catalyst Dec 9-10:
Tesla's 5-wave impulsive rally from $273 to $474.07 is officially terminated in a classic Truncated 5th Wave pattern – one of the most reliable bearish set

Midterm Stock Forecast for NVIDIANASDAQ:NVDA shows weakening momentum after its extended rally, with H1 structure signaling a corrective phase. A drop from $178 toward $150 aligns with cooling AI-driven sentiment and stretched valuation multiples. Fundamentally the long-term demand for GPUs remains strong, but midterm pricing pre

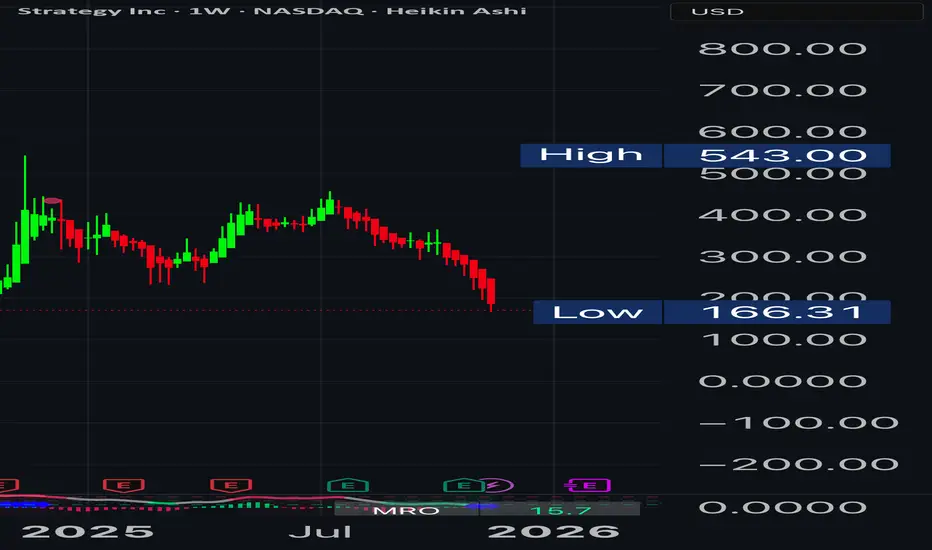
Where It Started — Retail Never Heard the MSCI Whispers⚡️ Where It Started — The Perpetual Offering Nobody Took Seriously (MSCI Was Only Whispers Back Then)
🌐 Referenced Tweet (Announcement of the Perpetual Preferred Offering):
x.com
⸻
⚡️ The Moment No One Realized Was the Start
When this perpetual preferred offering was announced, retail shrugged i
JNJ Price Target Summary (This Week)
Johnson & Johnson (JNJ) is currently trading around $204.
Analyst consensus price targets for the next 12 months are mostly in the $200–$207 range, with the highest targets around $230, but these are long-term estimates — not short-term.
A move to $228 this week is unlikely, as JNJ is a large, st

BEFORE THE RUN: Cup & Handle SUNRUNNASDAQ:RUN is building a clean Cup & Handle setup and is now sitting right in the sweet spot of the Handle - the zone where strong bases tighten up before they break. Price action is contracting, volume has dried up, and the chart is squeezing out the last bit of supply. The breakout trigger is str

KTOS
KTOS Test - testing this on paper trade - turns out there was a false breakout on a upwards trend

Weekly chart showing strong bullish RSI divergence on NOVOPrice continues to make lower lows while RSI forms higher lows, signaling weakening downside momentum. The downtrend line is still intact, but price is compressing and losing bearish strength. A breakout above the trendline would confirm a potential trend reversal. Watching for volume shift and RSI

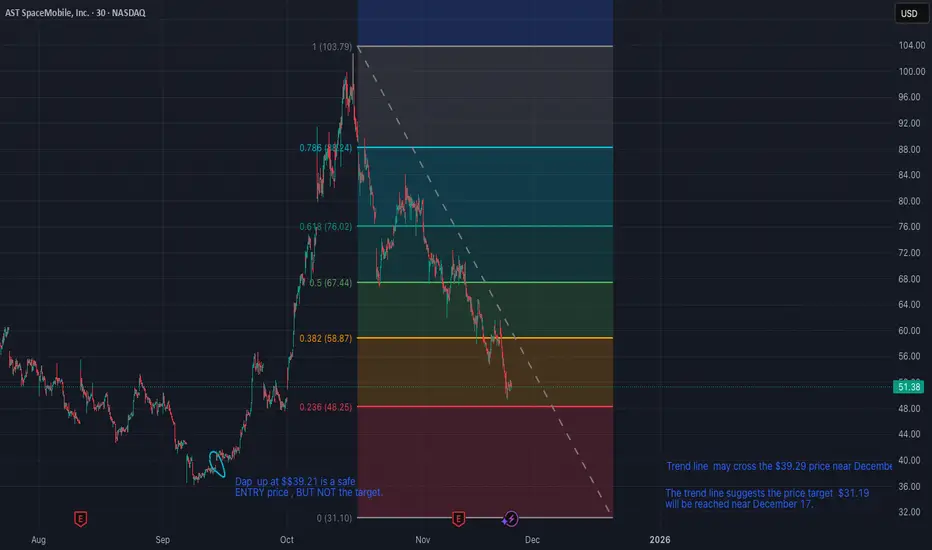
ASTS price gap $31.19 is the buy target I am long ASTS and have been accumulating over the year. I plan to hold long term as I expect ASTS to have explosive growth with a divided in the future.
When a stock price gaps up, that gap gets filled eventually. The bottom of the gap is a good entry point as the price will come back down to fill
See all stocks ideas
Today
PETSPetMed Express, Inc.
Actual
—
Estimate
0.04
USD
Today
LASELaser Photonics Corporation
Actual
—
Estimate
—
Today
PSHGPerformance Shipping Inc.
Actual
—
Estimate
0.18
USD
Today
KNDIKandi Technologies Group, Inc.
Actual
—
Estimate
0.02
USD
Today
UGROurban-gro, Inc.
Actual
—
Estimate
−0.04
USD
Today
GDEVGDEV Inc.
Actual
—
Estimate
0.42
USD
Today
ASYSAmtech Systems, Inc.
Actual
—
Estimate
−0.03
USD
Today
BTCTBTC Digital Ltd.
Actual
—
Estimate
−0.04
USD
See more events
Nov 26
R
RGNTRegentis Biomaterials Ltd.
Exchange
AMEX
Offer price
10.00 - 12.00
USD
Dec 1
E
ELCGELC Group Holdings Ltd.
Exchange
NASDAQ
Offer price
4.00 - 6.00
USD
Dec 1
HWEPHW ELECTRO Co. Ltd.
Exchange
NASDAQ
Offer price
—
Dec 1
PPHCPublic Policy Holding Co. Inc.
Exchange
NASDAQ
Offer price
—
Dec 1
AIGOAigo Holding Ltd.
Exchange
NASDAQ
Offer price
4.00 - 6.00
USD
See more events
Community trends
BTCUSD: Bulls Aim for Recovery Toward $92,000 Resistance ZoneHello everyone, here is my breakdown of the current Bitcoin setup.
Market Analysis
BTCUSD continues to move within a clearly defined Downward Channel, respecting both the descending resistance line and the lower support boundary. After a prolonged bearish continuation from the major Range structu

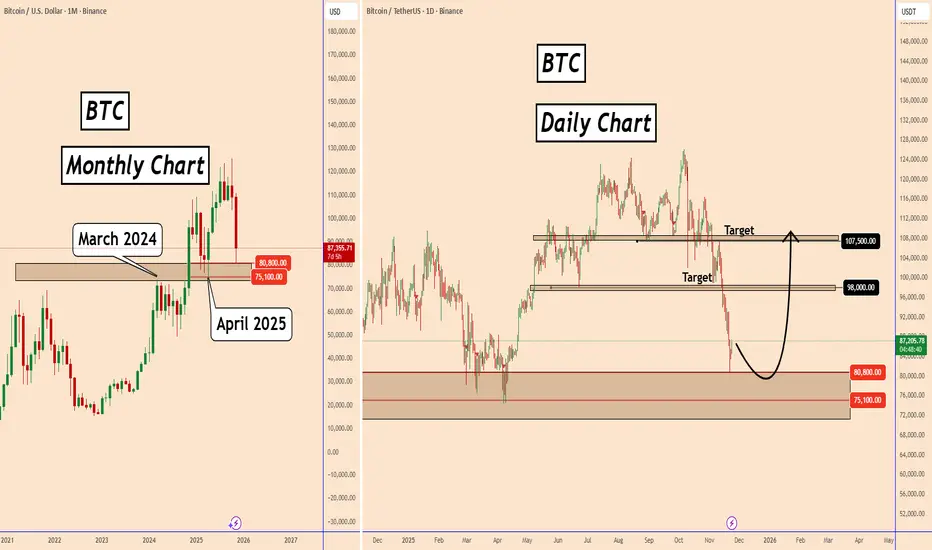
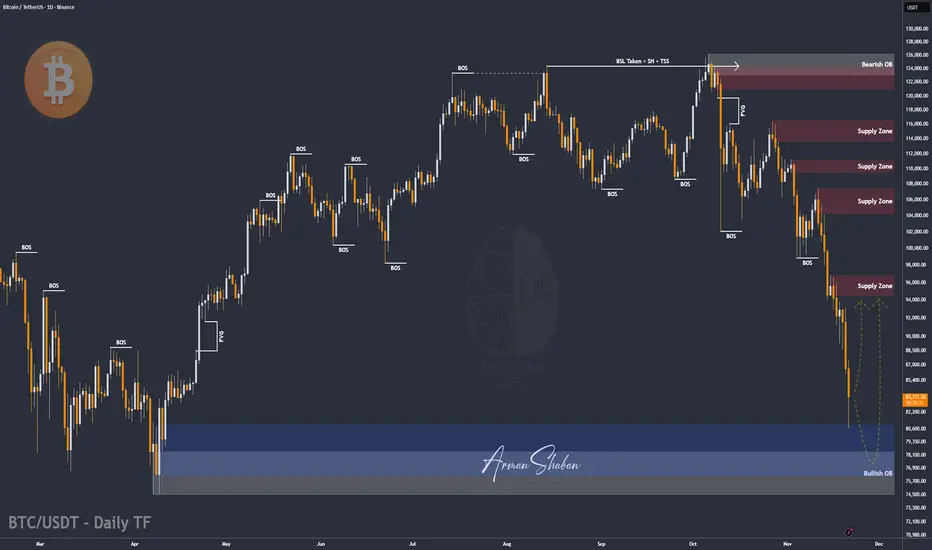
BTC at Key Support Zone - Bullish Setup in Progress?BTC at Key Support Zone - Bullish Setup in Progress?
Bitcoin has reached a major long-term support zone between 75,100 – 80,800, an area that previously acted as strong support in March 2024 and April 2025 on the monthly timeframe. The current monthly candle is testing this zone again, suggesting
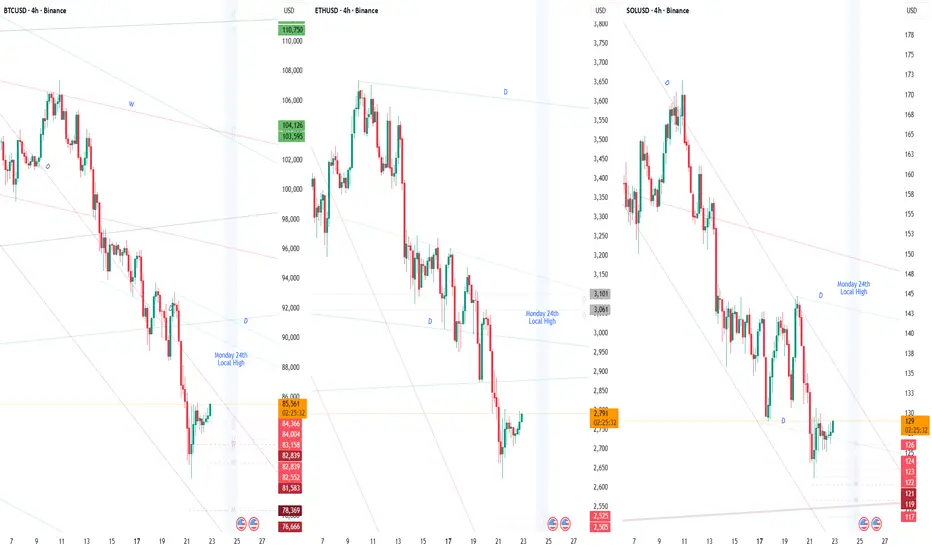
BTC ETH SOL Collapse Is Only Getting StartedI genuinely feel the pain of every crypto long term holder. I've been in crypto since 2014 and already suffered my losses back then. I no longer hold anything long term, when the trend changes, I go SHORT.
This is NOT FINANCIAL advise. You can quickly open an account on any brokerage that offers S
Bitcoin - 66k in 2026 (but first a pump - watch this!)Bitcoin has been going down drastically, as I expected many, many weeks in advance. But this is not the end of the crash! We will see lower prices in 2026, specifically 66k and possibly 50k later in Q3 2026. This is my long-term vision, but in the short term I think Bitcoin should go up to retest th

Bitcoin: Where Is The Bottom?Bitcoin sell off continues through the 90K to 88K support area. There have been no reversal confirmations on this time frame since I wrote my previous report. The reversal pattern that I was anticipating never even began to materialize. Trade opportunities were best found on the day trade time frame

XRP Approaching Key Supply Zone: Break or Reject?Hi!
Bullish Scenario
A bullish continuation becomes likely only if price breaks and closes above the $2.12–$2.18 S&D zone.
If that happens:
Buyers regain control
A retest could confirm support
Next target -> descending trendline at $2.35–$2.45
Conclusion:
Break S&D -> Long toward the desc

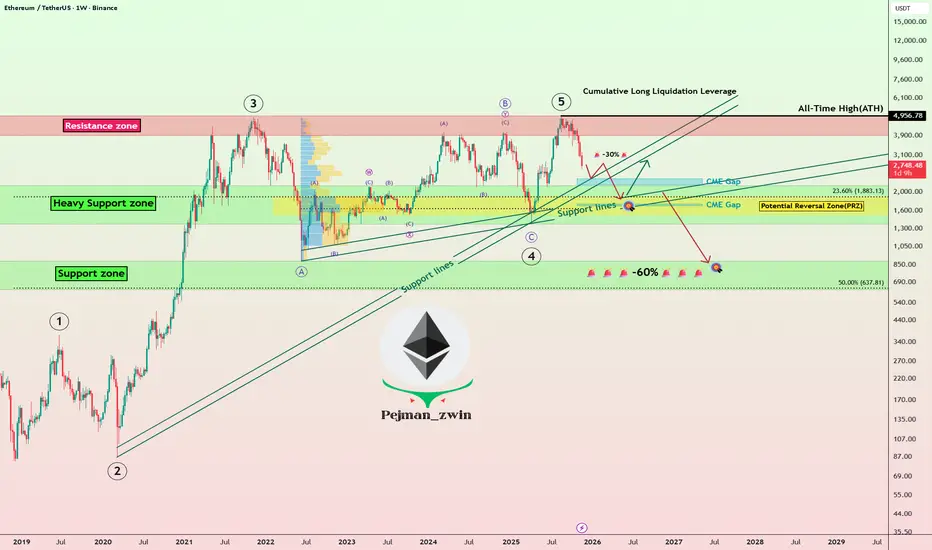
Ethereum Roadmap: Will ETH Bounce or Begin a Deeper Correction!?Today, I’d like to dive into an analysis of Ethereum ( BINANCE:ETHUSDT ). Given that over 80% of tokens in the crypto market are built on the Ethereum blockchain, Ethereum’s performance can serve as a roadmap for other tokens on the network.
So, stay tuned!
In recent times, Ethereum hasn’t been
ENA: Bullish SetupThis chart displays ENA on a daily timeframe, with clear structure pointing to a favorable long entry. The current price action is trading within a major support zone, where previous trendline breaks have consistently marked the start of impulsive moves.
Historically, every time ENA breaks out abov
BTCUSD – 1H Short Setup BITSTAMP:BTCUSD has pushed into a local resistance zone near 87.8k, aligning with the upper volatility band and showing early signs of exhaustion. Price is also interacting with the 38.2% retracement level, which often acts as a reversal pivot in corrective structures.
Bearish Confluences
Overext

BTC/USDT | Bitcoin Hit Major Demand, What’s Next?By analyzing the #Bitcoin chart on the daily timeframe, we can see that the price dropped exactly as expected and fell sharply to $80,500. Once it reached this major demand zone, buyers stepped in and Bitcoin bounced back to around $83,900.
As long as BTC can hold above the large demand zone between
See all crypto ideas
Lingrid | GOLD Weekly Analysis: Coiled Spring at Key CrossroadsOANDA:XAUUSD price action has settled into a tense, range-bound struggle, repeatedly testing the ascending trendline that has defined its path since late October. This persistent retest is a double-edged sword: while it demonstrates underlying buying interest, it also signals exhaustion and a growi

XAUUSDHello Traders! 👋
What are your thoughts on GOLD?
Gold continues to trade in a range-bound and choppy structure, showing back-and-forth movement with no clear directional bias in the short term.
In the current zone, price is trapped between channel resistance and key support, and a breakout from ei

XAUUSD Ascending Channel Strengthens: Bulls Target $4,130 TP1Hello traders! I want to share my view on the current XAUUSD setup. After a deep corrective move, gold has formed a local bottom around the Support Level at $4,000–$4,030, where strong buying pressure has re-entered the market. As shown on the chart, price is gradually climbing within a well-defined

THE KOG REPORTTHE KOG REPORT:
In last week’s KOG Report we gave the potential path as well as the red box defence to look for any reaction in price. We managed to support the lower red box defence giving us a nice long to start the week then resulting in the higher defence holding and giving us an extremely dec

XAU/USD) Bullish trend analysis Read The captionSMC Trading point update
Technical analysis of (XAUUSD) – Bullish Reversal Setup from Demand Zone
1. Key Zone: Strong Demand / Rejection Area
Price has reacted multiple times inside the blue demand zone (around 4040–4035).
This zone aligns with Fibonacci levels (0.705–0.79), strengthening the

GOLD 1H CHART ROUTE MAP UPDATE & TRADING PLAN FOR THE WEEKHey Everyone,
Please see our updated 1h chart levels and targets for the coming week.
We are seeing price play between two weighted levels with a gap above at 4100 and a gap below at 4057. We will need to see ema5 cross and lock on either weighted level to determine the next range.
We will see le

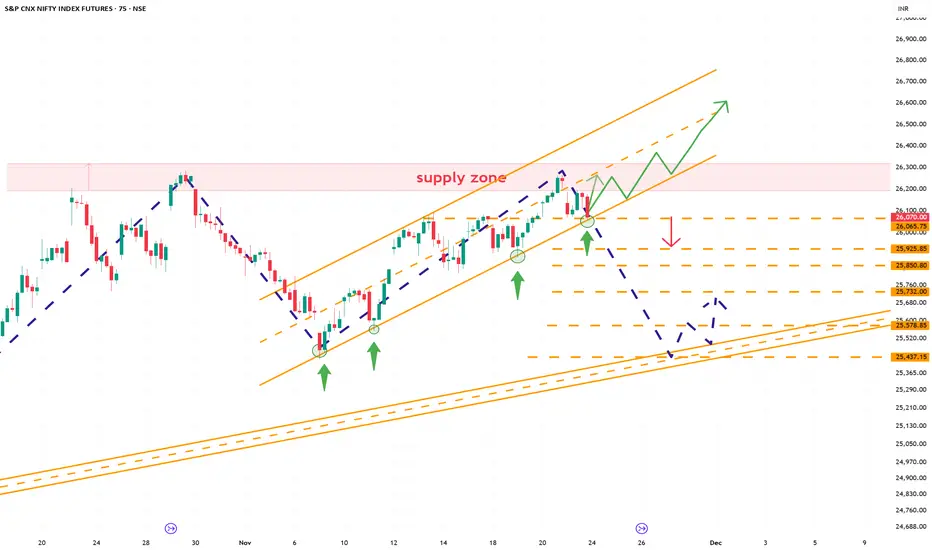
Nifty futures probable price projectionAs it is clear form the chart that price is rejectiing from all time high supply zone.
Price is following a channel and has taken support and moved up. now the price is at same supportive channel.
case 1: if price is respected at the channel then it moves up side till supplyzone and if continues
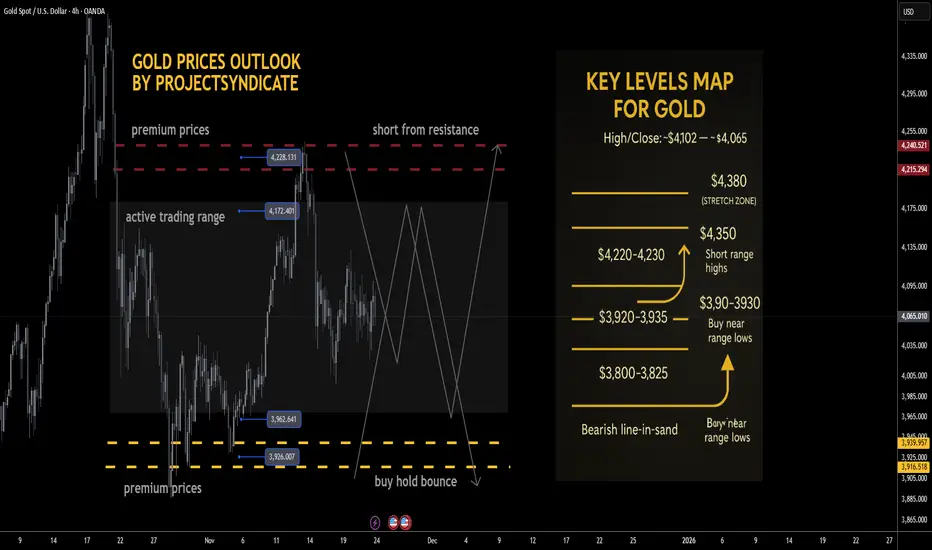
Gold next week: Key S/R Levels and Outlook for Traders🔥 GOLD WEEKLY SNAPSHOT — BY PROJECTSYNDICATE 🏆
High/Close: ~$4,102 → ~$4,065 — tight, inside-feel week with price holding comfortably above the $4,000 handle. Flows look balanced: steady two-way interest, but no strong directional conviction as the market oscillates within a well-defined range.
__
GOLD → Neutral price channel... Waiting for news FX:XAUUSD is testing the lower boundary of the 4060 channel and rebounding, maintaining moderate fluctuations in anticipation of key US data. Focus on 4040 - 4100...
The probability of a Fed rate cut in December has risen to 74% following comments by J. Williams
The unusual situation surroundi

XAUUSD 4H – Liquidity Map & Smart Money Outlook🌐 MARKET CONTEXT
Gold continues to trade within a bearish intraday structure, forming consistent Lower Highs → Lower Lows on the M30 timeframe. Price has been reacting strongly at Premium areas where Buy-Side Liquidity (BSL) accumulates, while showing clean rebounds at deeper Discount levels where

See all futures ideas
AUD/USD – Fundamentals Driving Downtrend | 24.11.2025Bearish Channel + Rate-Cut Expectation Pressure = Downside Continuation Setup
🔍 Technical Setup
AUD/USD continues to trade inside a falling channel, respecting the trendline resistance (multiple rejections marked). Price is currently moving toward the resistance zone, offering a potential sell-on

USDJPY -Min — Volume Buy & Sell Reversal Triggered⚡Base : Hanzo Trading Alpha Algorithm
The algorithm calculates volatility displacement vs liquidity recovery, identifying where probability meets imbalance.
It trades only where precision, volume, and manipulation intersect —only logic.
✈️ Technical Reasons
/ Direction — LONG / Reversal 155.500 Are

EURUSD: Targets focus on declines to 1.1480 support levelHello everyone, here is my breakdown of the current Euro setup.
Market Analysis
EURUSD continues to trade within a clear Downward Channel, maintaining a strong bearish structure characterized by consistent lower highs and lower lows. Early in the chart, the pair formed a prolonged Range Phase, si

GBPUSD Breakout and Potential RetraceHey Traders, in today's trading session we are monitoring GBPUSD for a buying opportunity around 1.30900 zone, GBPUSD was trading in a downtrend and successfully managed to break it out. Currently is in a correction phase in which it is approaching the retrace area at 1.30900 support and resistance

AUD/JPY – H4 - Rising Wedge Breakdown | Key Zones Targeted📝 Description:
The AUD/JPY pair is showing a clear Rising Wedge formation on the 4H timeframe, with three clean touches on the trendline—indicating weakening bullish momentum. Price has now broken below the lower trendline, suggesting increased probability of bearish continuation toward the next

EURUSD: Support & Resistance Analysis for Next Week 🇪🇺🇺🇸
Here is my latest support and resistance analysis
for EURUSD for next week.
Consider these structures for pullback/breakout trading next week.
❤️Please, support my work with like, thank you!❤️
I am part of Trade Nation's Influencer program and receive a monthly fee for using their TradingVie

EURUSD Long: Buyers Eye a Push Toward 1.15700 Supply ZoneHello traders! EURUSD continues to trade within a broader bearish market structure, remaining below the long-term Supply Line, which acts as dynamic resistance and keeps the pair under selling pressure. The chart shows several pivot points forming along both the supply trendline and the rising deman

GBP/USD Long Setup – Demand Zone ReversalPrice has retraced into a clearly defined demand zone on the 1H chart, showing signs of potential bullish reversal. The highlighted area marks a strong support level where buyers previously stepped in. A bullish reaction from this zone is anticipated, supported by the upward arrow projection.
Three

GBPUSD Technical Target Analysis (1H Chart)...📊 GBPUSD Technical Target Analysis (1H Chart)
My chart shows:
A descending trendline that price is currently testing.
Price is sitting inside the Ichimoku cloud, attempting to break upward.
Two Target Point levels marked on my chart.
Based on the structure visible:
---
🎯 Target Levels From

EUR/USD Under Pressure as Macro Signals Turn BearishHello everyone, here’s a closer look at the latest EUR/USD setup.
EUR/USD is falling into a difficult position as both the macro backdrop and the technical landscape point in the same direction: a drop first, followed by a potential rebound. The market feels like it’s pushing against a heavy door

See all forex ideas
| - | - | - | - | - | - | - | ||
| - | - | - | - | - | - | - | ||
| - | - | - | - | - | - | - | ||
| - | - | - | - | - | - | - | ||
| - | - | - | - | - | - | - | ||
| - | - | - | - | - | - | - | ||
| - | - | - | - | - | - | - | ||
| - | - | - | - | - | - | - |
Trade directly on the supercharts through our supported, fully-verified and user-reviewed brokers.


