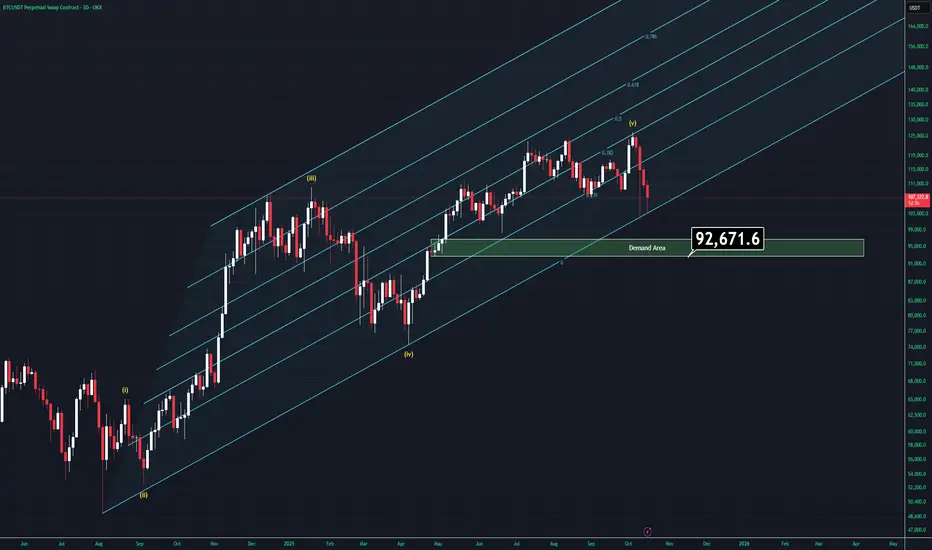
Moment of Fate - BTC Analysis (3D)There are many reasons to go up but also going down is starting to look way more charming than ever right now.
Let's examine what we have;
-FED is about to cut rates for a second time but we'll most likely to see another rate cut in december which is bullish af.
-All companies are keeping buying

The best trades require research, then commitment.
Get started for free$0 forever, no credit card needed

Scott "Kidd" PoteetThe unlikely astronaut

Where the world does markets
Join 100 million traders and investors taking the future into their own hands.
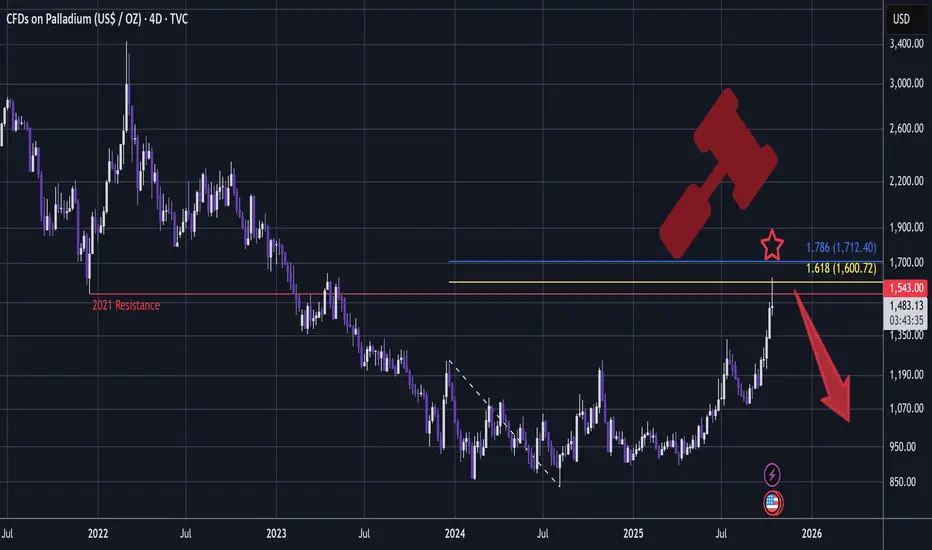
PALLADIUM - Short Setup, Bearish Rotation In MetalsA very bearish setup is developing:
Since the top, there is nowhere on the chart that has a whipsawing candle like this:
A very big Shooting Star!
This setup has my favourite conditions met:
- Whipsawing candle that sweeps liquidity through key resistance (2021)
- Tidy 1.618 Golden Window (1.6
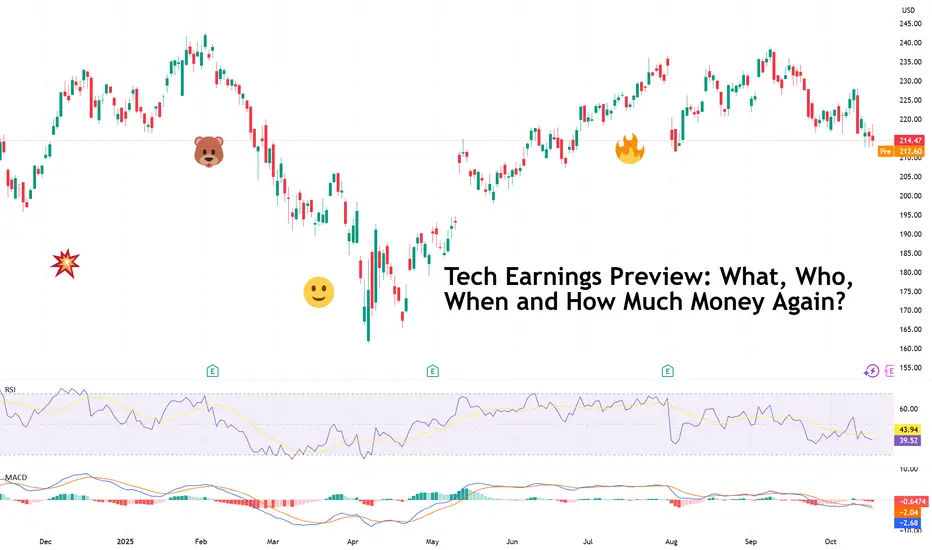
Tech Earnings Preview: What, Who, When and How Much Money Again?“ I don’t know, probably at least around $600 gazillion dollars ,” Zuck, probably if you asked him how much Meta NASDAQ:META will spend over the fiscal year.
It’s earnings season , which means Wall Street’s most expensive hobby — guessing how much the tech giants will make while pretending it’s
Tesla (TSLA) — Momentum Reload or Major Cooldown?The Next $400–$450 Decision Zone!
🧭 Weekly Chart — Big Picture Momentum
Tesla has printed one of the cleanest BOS (Break of Structure) patterns on the weekly timeframe since the post-2023 recovery, confirming that the macro downtrend has flipped into a sustained bullish expansion. The stock ripped

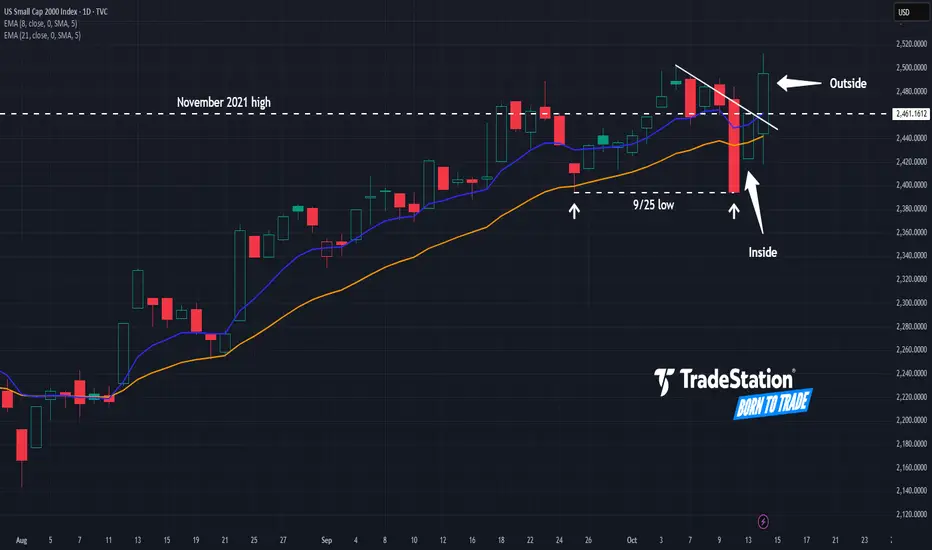
Small Caps: Finally a Breakout?The Russell 2000 has been stuck in a rut for years, but some traders may think the small-cap index has finally achieved escape velocity.
The first pattern on today’s chart is the November 2021 high around 2,460, where prices stalled last November. RUT has gotten above it this month and refused to s
“I Am Become Meme, Destroyer of Short-Sellers”: Gold at $4,200Remember those days where you could short gold and turn a profit? They’re gone. The precious metal is relentlessly pushing higher, breaking every short-seller’s dreams and portfolio.
It’s official — gold has gone full meme. The shiny metal that your grandparents swore by is now trending on Reddit

Gold/Oil Signaling Market Is In A Super Bubble Gold = Fear
Oil = how strong the economy is.
Except for COVID we have never seen such an extreme reading. Yet people are buying up stocks like we will never again be able to produce another stock again as long as we live!
Tulips!
Here are just a few of the factors to consider that make this indic

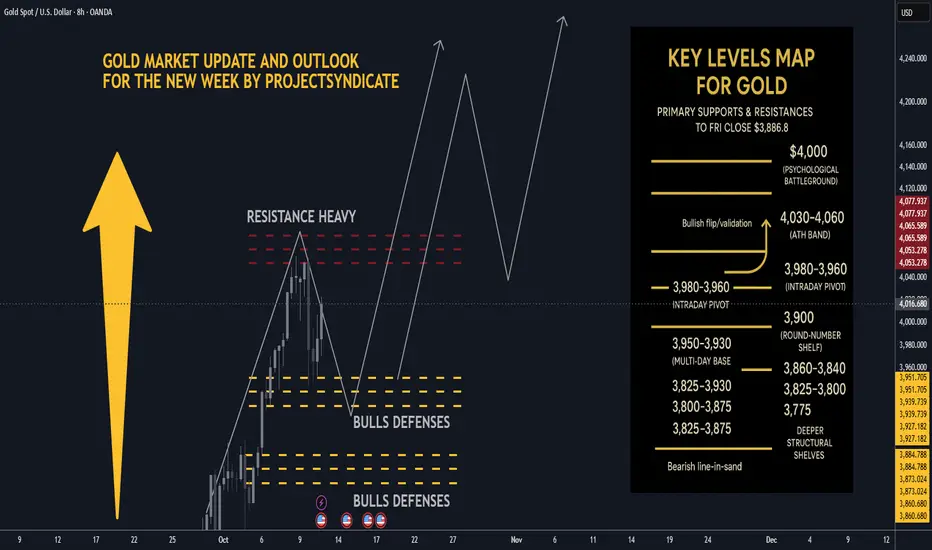
Gold next week: Key S/R Levels and Outlook for Traders🏆 Friday’s Close & Recent ATH:
Gold XAUUSD closed Friday around ~$3,990–$4,020/oz depending on venue most consolidated feeds show prints near $3.99–$4.02k at Friday close. The nearest recent intraday highs printed in the $4,030–$4,060 area across data providers this week, putting $4,000 as the imm
EURUSD: Downtrend will Continue in ChannelHello everyone, here is my breakdown of the current Euro setup.
Market Analysis
The price action has been clearly bearish, with the market being guided lower by a well-defined Downward Channel. This structure has been in place for some time, creating a series of lower highs and lower lows after

AUDUSD Eyes 0.64500 Support as Bullish Structure Holds FirmHey Traders,
In today’s session, we’re closely monitoring AUDUSD for a potential buying opportunity around the 0.64500 zone. The pair continues to trade within a broader uptrend, and the current pullback appears to be a healthy correction toward a key support and resistance confluence near 0.64500.

See all editors' picks ideas
Dynamic Equity Allocation Model"Cash is Trash"? Not Always. Here's Why Science Beats Guesswork.
Every retail trader knows the frustration: you draw support and resistance lines, you spot patterns, you follow market gurus on social media—and still, when the next bear market hits, your portfolio bleeds red. Meanwhile, institution

First Passage Time - Distribution AnalysisThe First Passage Time (FPT) Distribution Analysis indicator is a sophisticated probabilistic tool that answers one of the most critical questions in trading: "How long will it take for price to reach my target, and what are the odds of getting there first?"
Unlike traditional technical indicators

PongExperience PONG! The classic arcade game, now on your charts!
With this indicator, you can finally achieve your lifelong dream of beating the Markets. . . at PONG!
Pong is jam-packed with features! Such as:
2 Paddles
A moving dot
Floating numbers
The idea of a net
This indicator is solel

Options Max Pain Calculator [BackQuant]Options Max Pain Calculator
A visualization tool that models option expiry dynamics by calculating "max pain" levels, displaying synthetic open interest curves, gamma exposure profiles, and pin-risk zones to help identify where market makers have the least payout exposure.
What is Max Pain?
Max

Volume Profile 3D (Zeiierman)█ Overview
Volume Profile 3D (Zeiierman) is a next-generation volume profile that renders market participation as a 3D-style profile directly on your chart. Instead of flat histograms, you get a depth-aware profile with parallax, gradient transparency, and bull/bear separation, so you can see w

RiskMetrics█ OVERVIEW
This library is a tool for Pine programmers that provides functions for calculating risk-adjusted performance metrics on periodic price returns. The calculations used by this library's functions closely mirror those the Broker Emulator uses to calculate strategy performance metrics (

Simple Decesion Matrix Classification Algorithm [SS]Hello everyone,
It has been a while since I posted an indicator, so thought I would share this project I did for fun.
This indicator is an attempt to develop a pseudo Random Forest classification decision matrix model for Pinescript.
This is not a full, robust Random Forest model by any stretch o

Tick CVD [Kioseff Trading]Hello!
This script "Tick CVD" employs live tick data to calculate CVD and volume delta! No tick chart required.
Features
Live price ticks are recorded
CVD calculated using live ticks
Delta calculated using live ticks
Tick-based HMA, WMA, EMA, or SMA for CVD and price
Key tick levels (S

analytics_tablesLibrary "analytics_tables"
📝 Description
This library provides the implementation of several performance-related statistics and metrics, presented in the form of tables.
The metrics shown in the afforementioned tables where developed during the past years of my in-depth analalysis of various str

Adaptive Trend Classification: Moving Averages [InvestorUnknown]Adaptive Trend Classification: Moving Averages
Overview
The Adaptive Trend Classification (ATC) Moving Averages indicator is a robust and adaptable investing tool designed to provide dynamic signals based on various types of moving averages and their lengths. This indicator incorporates multipl

See all indicators and strategies
Community trends
Account Blow Up 10/17/2025💥 Trading Is a Game of Survival
NASDAQ:TSLA blew up my account — I’ll be completely honest about that.
It hurts, but it also teaches. Every great trader has been here once.
I fund my account every two months, which means I won’t be trading until next month. That’s fine — I’m using this reset to

Be careful with AMD!!! Likely reason for the target increase: Rapid growth in the field of artificial intelligence and strong demand for advanced chips, especially in competition with Nvidia.
So if you pay attention to the AMD chart you can see that the price has formed a Ascending Pennant which means it is expected to p

Tech Earnings Preview: What, Who, When and How Much Money Again?“ I don’t know, probably at least around $600 gazillion dollars ,” Zuck, probably if you asked him how much Meta NASDAQ:META will spend over the fiscal year.
It’s earnings season , which means Wall Street’s most expensive hobby — guessing how much the tech giants will make while pretending it’s
BITF / DailyNASDAQ:BITF — 📊 Technical Update (Daily)
As outlined in prior analyses of $BitfarmsLtd., this week Minor Wave 3 completed its extension precisely at the projected Fibonacci target of $6.60.✨
As anticipated, Minor Wave 4 has begun its corrective pullback — currently reflecting a 30% decline, and li

CVNA - Carvana on the way down
Since August, CVNA has been moving sideways without any real direction.
At the upper quarter line, sellers appeared at nearly every price level, keeping CVNA pinned down.
Now that the price is trading below the centerline, the next target is the lower median line (L-MLH).
Is it too late to short

ASML
ASML is a Dutch multinational company specializing in advanced semiconductor manufacturing equipment, primarily known for its extreme ultraviolet (EUV) lithography machines essential for producing cutting-edge chips used in AI, smartphones, and computing.
Current Stock Price
As of October 18, 2025,

Opendoor Technologies Big Correction coming ?In this video I explore the recent explosion in the price of Opendoor Technologies .
Still along way off its All time highs but up some 2000% from the past few months alone
I analyse what could be a very key zone to build upon .
Tools used Fibs, VPR, VWAP, TPO Chart

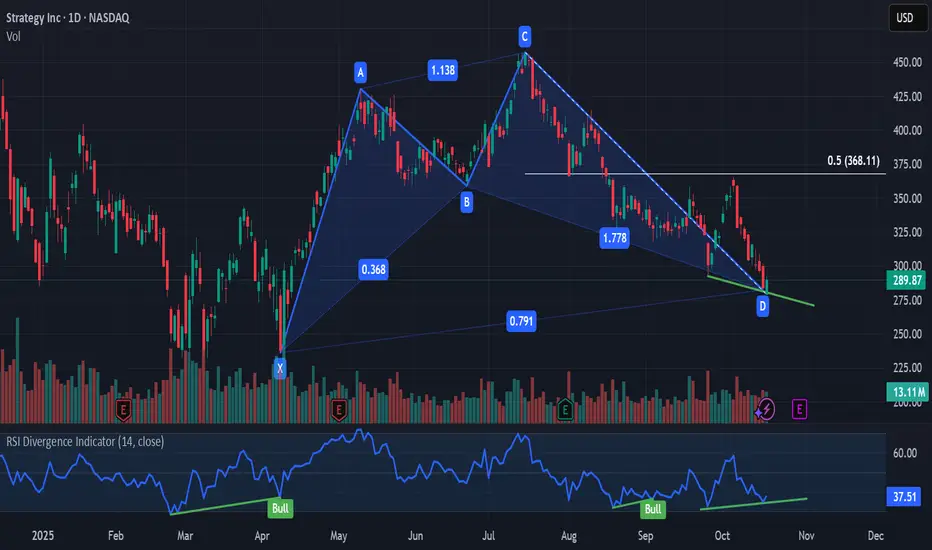
$MSTR bullish cypher patternBullish divergence on Cypher pattern PRZ with CRYPTOCAP:BTC currently trying to bounce during the weekend. possibly targeting 368.11
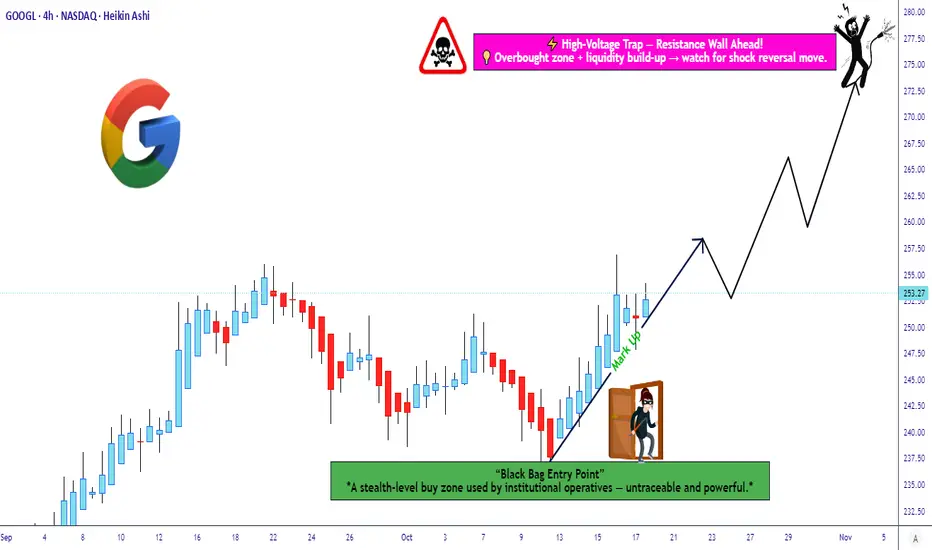
Is This the Perfect Entry Zone for the Next GOOGL Upside Run?🎯 GOOGL: The "Thief's Heist" Trading Strategy | Layered Entry Playbook 📊
💼 Asset: ALPHABET INC. (GOOGL)
Market: NASDAQ | Style: Swing/Day Trade Hybrid
🎭 The Setup: Bulls Running the Show
Bias: 🟢 BULLISH
Listen up, trading family! 👋 GOOGL is setting up what I call the "Thief's Entry Strategy" - a l
IS TESLA ABOUT TO HAVE A MASSIVE SHORT SQUEEZE?Tesla is showing us some very interesting signals on the daily, weekly and even the 3H chart that are worth covering in this video as it could have massive implications for what Q4 2025 may be looking like for Tesla stock NASDAQ:TSLA

See all stocks ideas
Tomorrow
HBTHBT Financial, Inc.
Actual
—
Estimate
0.62
USD
Tomorrow
MRTNMarten Transport, Ltd.
Actual
—
Estimate
0.04
USD
Tomorrow
CMTLComtech Telecommunications Corp.
Actual
—
Estimate
−0.75
USD
Tomorrow
BHBBar Harbor Bankshares, Inc.
Actual
—
Estimate
0.83
USD
Tomorrow
OSBCOld Second Bancorp, Inc.
Actual
—
Estimate
0.26
USD
Tomorrow
GBFHGBank Financial Holdings Inc.
Actual
—
Estimate
0.45
USD
Tomorrow
CASSCass Information Systems, Inc
Actual
—
Estimate
0.63
USD
Tomorrow
LFCRLifecore Biomedical, Inc.
Actual
—
Estimate
−0.31
USD
See more events
Community trends
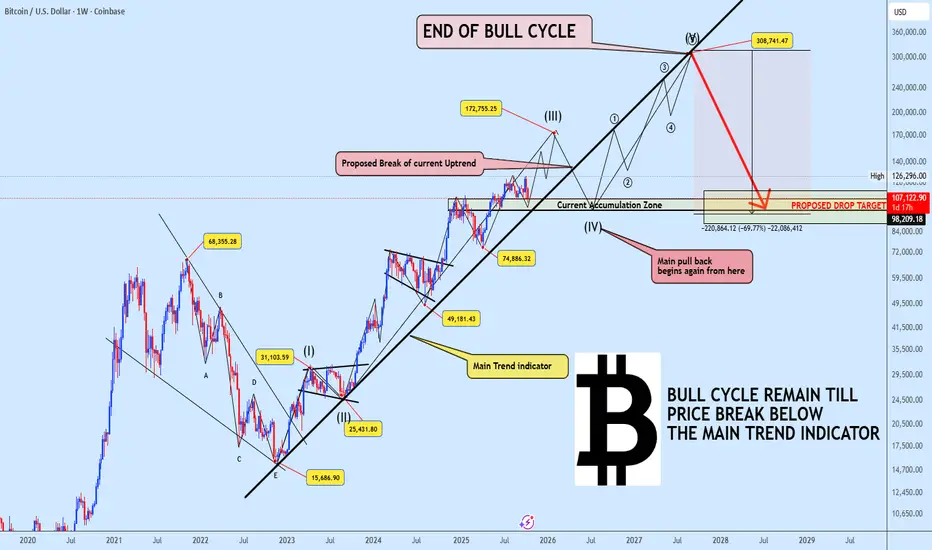
BITCOIN The Super Cycle Still Unfolding Wave 3 in Motion!Bitcoin continues to respect the Main Trend Indicator, keeping the broader super cycle wave (3) intact. Based on our projection, the ongoing bullish leg is expected to complete near $172,000, marking the end of wave (III).
From there, we anticipate a corrective wave (IV) to unfold likely breaking b
Bitcoin - This 2017 trendline predicts a huge crash below 60k!This long-term trendline 2017 - 2021 - 2025 worked perfectly on Bitcoin this year, because we saw 4 major rejections every time the price touched the trendline! Many people said that I must do analysis on the LOG scale only and that this trendline is not valid. Well, the opposite is truth - both lin

BTCUSDT Whales have interest to Buy this cheap priceSuch a low price and near 0.38 & 0.5 Fibonacci levels are one of the best places that market correction ends and price start to pump and hit new high so here we can expect some new users to crypto to sell their tokens in -15% to -40% loss and kicked out of market and then again after price hit 130K$

BTC 2026 Outlook - Roadmap Speculation to $300KHello BTC Watchers.
Let's talk about BTC in the Logarithmic view.
I mapped out the date-ranges, as well as how far the price fell logarithmically after each top. You'll see the word "lines" on the chart. This simply indicates the amount of diagonal trendlines it has fallen. By using this pattern-d

(ALTS MARKET CAP) UPDATE Total 3 or in simple terms ( ALTS MARKET CAP), looks a bit bearish.
We will see a clear move toward the lower trendline support, coinciding with the 0.5 Fibonacci retracement level at approximately $930 billion.
A robust bounce will follow from this level.
If you're an active trader, stay vigilan

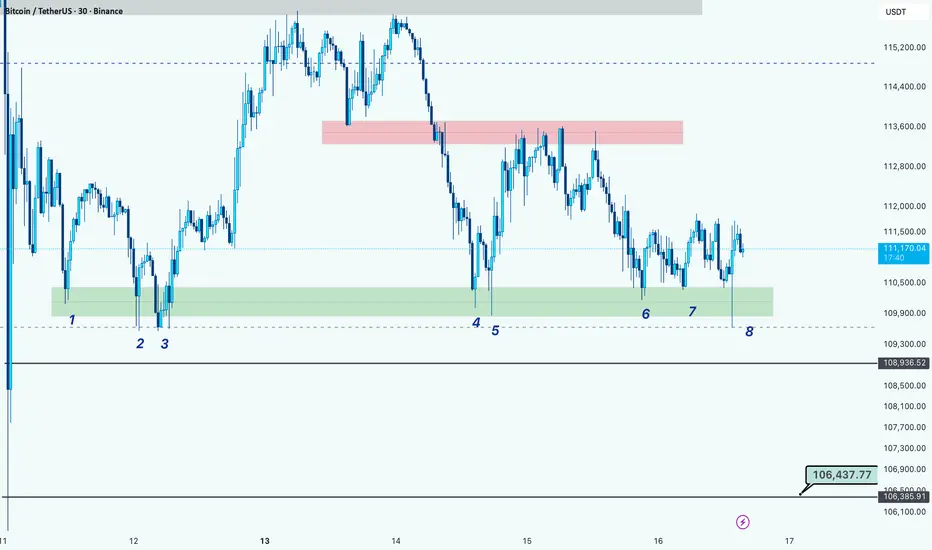
BTC Testing Key Support for the 8th Time, Breakdown Ahead?Hi guys!
BTC has tested the same support zone eight times around the $110,000 – $110,300 range (highlighted in green).
Repeated retests of a support level often signal weakening buyer strength, increasing the probability of a breakdown.
If the price manages to break below this zone, the next key
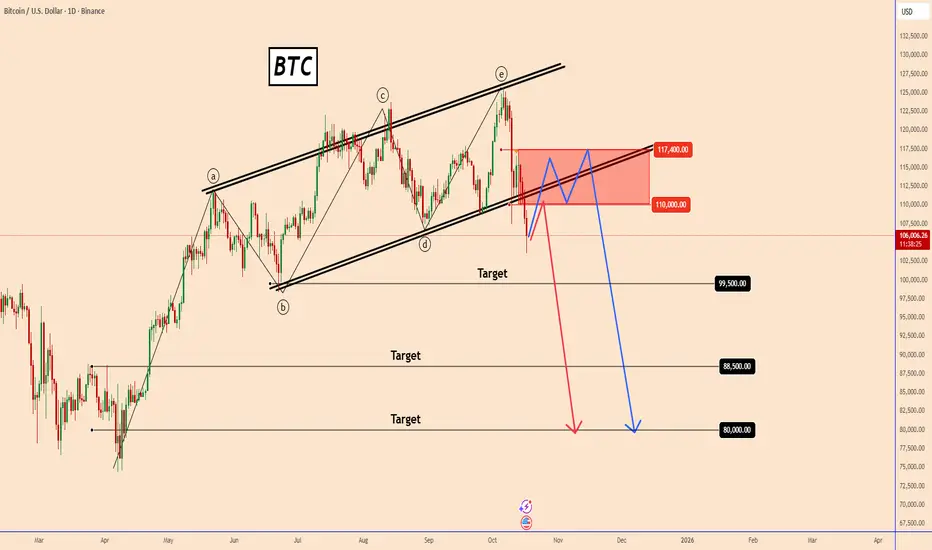
Bitcoin (BTC) Analysis – Daily ChartBitcoin (BTC) Analysis – Daily Chart
Bitcoin has broken below the ascending channel that has held for several months. This breakdown indicates a possible shift in momentum from bullish to bearish.
At the moment, the price is trading around $105,900, with resistance seen near $110,000 and $117,400
Ripple (XRP): Looking For Market Structure BreakBuyers are starting to show small dominance after the breakdown, which could easily turn into a decent market structure break if momentum continues. For now, this looks like a clean recovery phase — if buyers manage to secure this zone, we’ll be looking for continuation toward the upper targets.
Sw

$FLOKI (DAILY): last-ditch SUPPORT tested, ready to exit SPOTWell, I'm properly stuck with my pre-collapse SEED_DONKEYDAN_MARKET_CAP:FLOKI SPOT buys. And things aren't looking so great after a weak bounce on FRIDAY 17...
50 MA crossing below 200 MA, so obviously a DEATH CROSS on the DAILY chart. It's just bearish, and only the last serious support that wor

Moment of Fate - BTC Analysis (3D)There are many reasons to go up but also going down is starting to look way more charming than ever right now.
Let's examine what we have;
-FED is about to cut rates for a second time but we'll most likely to see another rate cut in december which is bullish af.
-All companies are keeping buying
See all crypto ideas
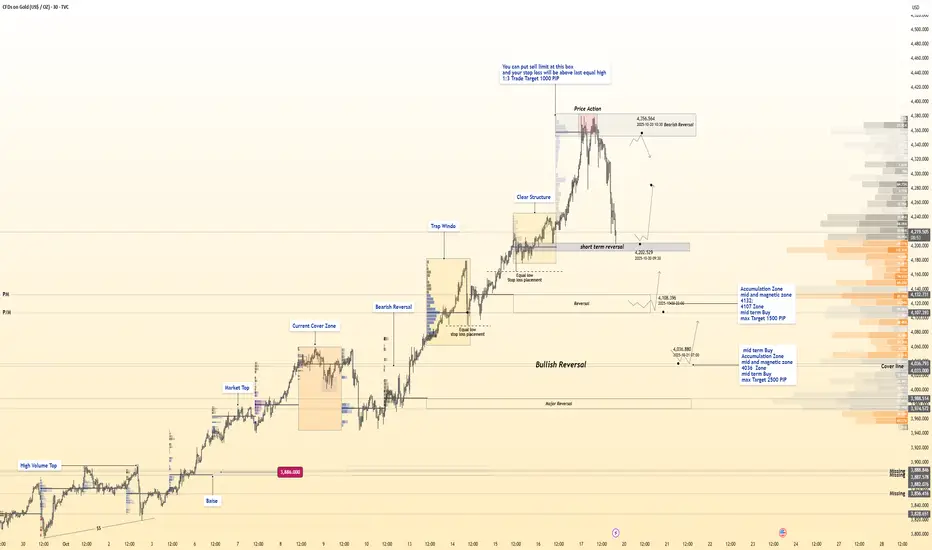
The Ultimate GOLD Reversal Map📊 Hanzo Protocol Note
Every marked level reflects precision between liquidity, delta reaction, and volume logic —
Only structure and flow decide — not bias.
Mid-Term SELL Zone — 4360
Setup: Limit Sell Recommended
Stop Loss: Above recent equal highs
Target: +1000 Pips (1:3 RR)
Reasons:
L
XAU/USD | First LONG, then SHORT! (READ THE CAPTION)By analyzing the Gold (XAUUSD) chart on the 15-minute timeframe, we can see that gold hit all targets between $4,300 and $4,350 and even rallied to $4,380.99, marking a new all-time high (ATH)!
After that, gold started to correct below $4,300, briefly dipping to $4,258 before bouncing back above $4

TradeCityPro | Bitcoin Daily Analysis #200👋 Welcome to the 200th Daily Bitcoin Analysis!
To celebrate this milestone, today’s analysis will be different, our main focus will be on the XAUBTC chart, but first, let’s analyze gold and Bitcoin separately before combining the two.
✅ Gold
📅 Monthly Timeframe
Gold is in a completely bullish tr

Gold ready for retest ath 4380Gold (XAU/USD) showing bullish reaction from the support trendline. The circled candle indicates buyer strength, suggesting a possible recovery toward 4279–4380 resistance levels.
Support Trend Line:
Shows long-term bullish structure — price respecting the ascending trendline.
Support Zone (4181

When Everyone’s Buying, I’m Watching for the TopAs we’ve grown used to by now, Gold sets a new ATH almost every day — and by the time we, in Europe, wake up, it’s already 300–400 pips higher.
Yet despite the strong bullish momentum, speculative trading remains extremely difficult. Sudden drops of hundreds of pips can easily hit your stop loss if

GOLD: STOP TRADING GOLD TODAYGOLD: STOP TRADING GOLD TODAY
Yesterday gold hit a new record high of 4380.
The price went up for no reason in an exponential way.
I have no idea what is going on because these crazy moves are not related to normal market conditions. It is impossible to be a normal market and go up like this more

Latest Gold Price Update Today👋Hello everyone, what are your thoughts on OANDA:XAUUSD ?
At the time of writing, XAUUSD is pulling back after reaching its recent peak. This retracement is mainly due to profit-taking by investors after gold hit a near-record high around $4,380.
However, the overall long-term trend still favo

Gold Price consolidation to downside side What's should Next ?Gold prices have reached a new record high as investors continue to bet on the U.S. Federal Reserve maintaining its path toward lower interest rates. Ongoing geopolitical tensions between China and the U.S. are also supporting gold’s safe-haven demand.
Technical Outlook:
The price recently tested

Gold Performance Recap for the week📝This week, the price of Gold first rose and then fell. The specific trend is as follows:
Monday: Gold broke through the 4059 mark in the Asian trading session, setting a new historical record
Tuesday- Wednesday: The price continued to rise.
Thursday: Gold reached a maximum of 4298.64.
Friday: Firs

XAUUSD: Rally can Reach new ATH - $4520 pointsHello everyone, here is my breakdown of the current Gold setup.
Market Analysis
Gold has been in a very strong and complex uptrend. We saw the price break out of an initial range and then establish a major Trend Line that has guided it higher, breaking through key levels like Support 2 at 3670

See all futures ideas
Euro can Continue its Rally After a Minor CorrectionHello traders, I want share with you my opinion about Euro. The market for the Euro has been through a highly complex series of structural shifts, transitioning from a prior upward channel into a well-defined downward channel. After multiple failed rallies and a final drop into the 1.1600 buyer zone

EURUSD – Pressure Returns, Bears Take ControlThe Euro is facing renewed pressure after the Bank of Italy lowered its 2026 growth forecast to just 0.7%, citing the impact of U.S. tariffs. This has raised concerns that the Eurozone’s overall growth may slow further, potentially forcing the ECB to consider policy easing sooner, which in turn coul

USDJPY Rally Faces Pressure Near 151.250 on Safe-Haven FlowsHey Traders, in the coming week we’re monitoring USDJPY for a selling opportunity around the 151.250 zone.
The pair remains in a broader downtrend, currently in a corrective phase as it approaches this key resistance level.
Meanwhile, DXY is also correcting within its own downtrend, approaching re

CAD/JPY (1H timeframe)...CAD/JPY (1H timeframe) — I'm using the Ichimoku Cloud and a downtrend resistance line that’s just being tested.
Here’s the technical breakdown 👇
🔍 Analysis:
Price is currently around 107.12–107.20, testing the descending trendline.
The Ichimoku cloud (yellow area) is above current price, acting

Approaching Potential SuuportAfter a strong reaction from 1.19187 and then near 1.18200, more distribution has been seen on the top left near 1.17750 zone, on this 30 min chart.
The distribution was followed by a trending move on the downside, contained at 1.15400 zone with a double bottom formation. RSI divergence and absorpt

EURNZD: Trend Long-term bullish trend with room to move higher. Currently in a shallow bearish retracment, but adding a fib we are already into the 79.5 level (deep discount). Watch out for NZD CPI Monday 20th.

USD/JPY Breakout & Retest Buy Setup — Bullish Momentum Building Pair: USD/JPY
Timeframe: M30
Pattern: Falling Channel (Breakout Setup)
Directional Bias: Bullish (Buy Setup)
---
🔍 Technical Analysis
1. Descending Channel:
The price has been moving within a falling channel (marked in blue).
Recently, it broke above the upper trendline — a strong signal o

EURUSDHello Traders! 👋
What are your thoughts on EURUSD?
EUR/USD is currently trading below a key resistance zone and has already pulled back to the broken ascending trendline.
The price action suggests weakening bullish momentum, indicating a possible continuation to the downside.
After some short-term

EUR/AUD Bulls Fighting Back — Retail 76% Short!🔹 COT (Commitment of Traders)
Euro (EUR):
Non-commercial longs: 252,472 (−789)
Non-commercial shorts: 138,127 (+2,625)
→ Institutional traders have trimmed long positions and increased shorts, signaling a softening bullish bias on the euro.
Australian Dollar (AUD):
Non-commercial longs: 41,994 (+1,7

EURUSD – Bullish Breakout in Progress👋Hello everyone, what do you think about FX:EURUSD ?
Today, this pair continues to show strong signs of recovery after a prolonged downtrend. The price action has successfully broken above the descending trendline, which had acted as resistance for several weeks. This breakout, combined with the

See all forex ideas
| - | - | - | - | - | - | - | ||
| - | - | - | - | - | - | - | ||
| - | - | - | - | - | - | - | ||
| - | - | - | - | - | - | - | ||
| - | - | - | - | - | - | - | ||
| - | - | - | - | - | - | - | ||
| - | - | - | - | - | - | - | ||
| - | - | - | - | - | - | - |
Trade directly on the supercharts through our supported, fully-verified and user-reviewed brokers.


