Giveaway 2025: Merry Christmas & Happy Holidays!Another year, another stack of charts, lessons learned the hard way, and moments where the market reminded us who’s really in charge.
As 2025 winds down, we want to say a genuine thank you. Your ideas, comments, chart screenshots, hot takes, and valuable feedback are what make TradingView what it i
Your 2025 space mission is here
Suit up and get ready to explore every highlight of your trading galaxy.


BTCUSDTHello Traders! 👋
What are your thoughts on Bitcoin?
Bitcoin has entered a corrective phase after a strong bearish move and is currently ranging between a clearly defined support and resistance zone. As long as price remains inside this range, no major directional move is expected.
At the moment,

EUR/AUD at a Crossroads!The EUR/AUD pair is trading in an upward trend on the four-hour timeframe following the pullback that took place between November 25 and December 10.
The pair is now at a crossroads between continuing the upward trend from the current support levels at 1.77340 and 1.77154, targeting 1.77792 as the

Navigating Volatility Amid Unprecedented Scale and Future InvestNASDAQ:META Meta Platforms, Inc. (META) presents a compelling bullish case rooted in its unparalleled execution within the digital advertising core business, juxtaposed against significant strategic investments in future technologies—investments that, while costly, are funded by immense cash flows
GC(XAU/USD) technical analysis and directional opinion*In this analysis I will not include macroecnomic analysis as we all know broad financial market is waiting for BoJ to create clear directional bias upcoming end of this week on Friday. However I will make a seperate post regarding "How to decode BoJ decision" on the day before the Japanese rate dec

Nasdaq-100: Lower Low and Lower High?The Nasdaq-100 made a lower low, and now it might have made a lower high.
The first pattern on today’s chart is the November 21 low of 23,854, some 353 points below the October trough. That broke a series of higher lows since April.
Second, the tech-heavy index peaked at 25,835 on December 10. Tha

Lingrid | GOLD Sideways Movement Ahead of FOMC DecisionOANDA:XAUUSD perfectly played out my previous trading idea . Price is holding inside a well-defined consolidation after its prior surge, with price rotating above the rising channel base. The trend remains constructive, but momentum has cooled, suggesting participants are waiting for a catalyst ra

BOJ to Stress Test Global Markets? Why a Black Swan Is PossibleWhile US markets are busy debating AI valuations and parsing the Fed’s latest rate cut , something far more understated — and potentially more disruptive — is brewing across the Pacific.
The Bank of Japan is expected to raise interest rates on Friday, marking what could be its first hike in 11 mon

GOOG: Is a 10% Surge Imminent? The Setup for $340 Explained🚀 NASDAQ:GOOG : Is a 10% Surge Imminent? The Setup for $340 Explained
In the noisy world of trading, clarity is power.
Today, we are looking at Alphabet Inc. (GOOGL). We are not predicting the future, we are simply preparing for a high-probability outcome.
We have identified a textbook Bull Fla

DOGE pulls back before major decline DOGECOIN is in a range formed against the backdrop of a downtrend. The market is under pressure from above at 0.155 - 0.153 - 0.150. The structure is bearish. The rebound from 0.134 is directed towards 0.1415. A false breakout could trigger a decline.
There is no volume from the bulls, and the mark

See all editors' picks ideas
Multi-Distribution Volume Profile (Zeiierman)█ Overview
Multi-Distribution Volume Profile (Zeiierman) is a flexible, structure-first volume profile tool that lets you reshape how volume is distributed across price, from classic uniform profiles to advanced statistical curves like Gaussian, Lognormal, Student-t, and more.
Instead of forcin

Multi-Ticker Anchored CandlesMulti-Ticker Anchored Candles (MTAC) is a simple tool for overlaying up to 3 tickers onto the same chart. This is achieved by interpreting each symbol's OHLC data as percentages, then plotting their candle points relative to the main chart's open. This allows for a simple comparison of tickers to tr

Vdubus Divergence Wave Pattern Generator V1The Vdubus Divergence Wave Theory
10 years in the making & now finally thanks to AI I have attempted to put my Trading strategy & logic into a visual representation of how I analyse and project market using Core price action & MacD. Enjoy :)
A Proprietary Structural & Momentum Confluence System

Per Bak Self-Organized CriticalityTL;DR: This indicator measures market fragility. It measures the system's vulnerability to cascade failures and phase transitions. I've added four independent stress vectors: tail risk, volatility regime, credit stress, and positioning extremes. This allows us to quantify how susceptible markets are

Volatility Risk PremiumTHE INSURANCE PREMIUM OF THE STOCK MARKET
Every day, millions of investors face a fundamental question that has puzzled economists for decades: how much should protection against market crashes cost? The answer lies in a phenomenon called the Volatility Risk Premium, and understanding it may fundam

Volume Gaps & Imbalances (Zeiierman)█ Overview
Volume Gaps & Imbalances (Zeiierman) is an advanced market-structure and order-flow visualizer that maps where the market traded, where it did not, and how buyer-vs-seller pressure accumulated across the entire price range.
The core of the indicator is a price-by-price volume prof

Match Finder [theUltimator5]Match Finder is the dating app of indicators. It takes your current ticker and finds the most compatible match over a recent time period. The match may not be Mr. right, but it is Mr. right now. It doesn't forecast future connection, but it tells you current compatibility for today.
Jokes aside,

Trend Line Methods (TLM)Trend Line Methods (TLM)
Overview
Trend Line Methods (TLM) is a visual study designed to help traders explore trend structure using two complementary, auto-drawn trend channels. The script focuses on how price interacts with rising or falling boundaries over time. It does not generate trade sign

Breakouts & Pullbacks [Trendoscope®]🎲 Breakouts & Pullbacks - All-Time High Breakout Analyzer
Probability-Based Post-Breakout Behavior Statistics | Real-Time Pullback & Runup Tracker
A professional-grade Pine Script v6 indicator designed specifically for analyzing the historical and real-time behavior of price after strong All-Ti

Count█ OVERVIEW
A library of functions for counting the number of times (frequency) that elements occur in an array or matrix.
█ USAGE
Import the Count library.
import joebaus/count/1 as c
Create an array or matrix that is a `float`, `int`, `string`, or `bool` type to count elements from, t

See all indicators and strategies
Community trends
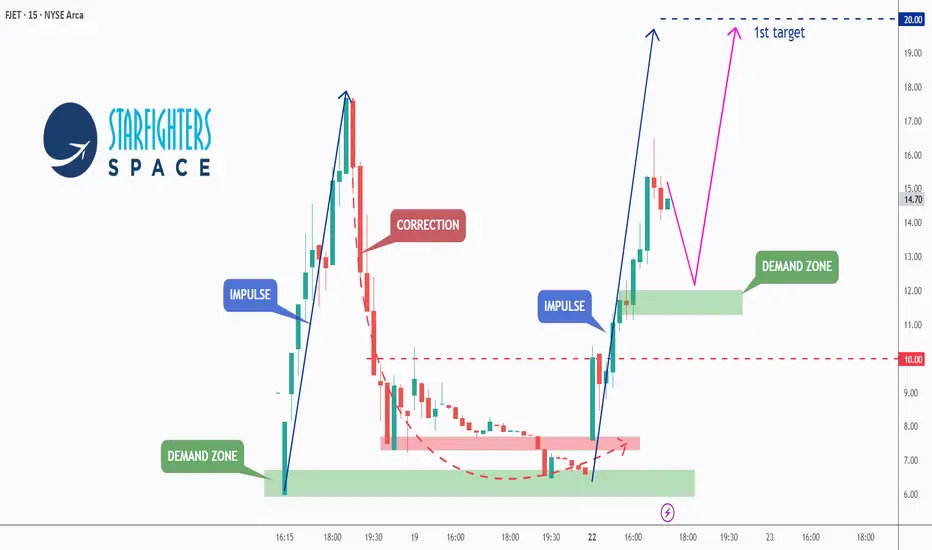
FJET - From Private Skies to Public Markets!!Most retail investors never had access to the biggest space winners.🌌
SpaceX went from a private valuation near $46B to over $800B without ever giving the public a chance to participate.
This time, the door is open❗️
Starfighters Space, Inc. AMEX:FJET has officially entered the public
Intc The technicals are pointing towards 41-45$ in the next 2weeks..
3 things make me come to that conclusion.
1. Inverted hammer at the end of a downtrend with volume.
2. Retest of up trend from 19$ lows
3. 4hour Money flow and Macd went too oversold on the most recent pullback.. each time t

Impulse Wave 3 extended inside rising channel •Elliott Wave
• Impulse Wave 3 extended inside rising channel
• Current consolidation = micro Wave 4
• Wave 5 expected if structure holds
⸻
Fibonacci
Measured last impulse leg:
• 38.2% → 176
• 50% → 168
• 61.8% → 159 (last bullish defense)
Extensions:
• 1.0 → 220
• 1.272 → 245
• 1.618 →

TMC SwingReasoning:
Strong Industry/Sector
50MA Pullback
If Labelled a Swing trade(2-6 Week Holds)
Entry: Full position on breakout
Profit Taking: Sell 1/3 at Goal 1
Final Exit: Remainder at Goal 2
If labelled a long term trade (3-12 Month Holds)
Entry: Full position on breakout
Profi

$INTC TechnicalsHere is where we stand:
- Peeking above a squeeze on the flag - continuing the uptrend.
- Needs a strong close over the 50MA ($36.89) - it was on its way on Friday, before triple witch pushed it under in the last 8 minutes of trading.
- This is the first close (yesterday) that volume exceeded aver

RIVIAN - DAY TRADE SET-UPGood Morning,
Hope all is well. Please see Rivian day trade idea. Entry levels, stops and take profits.
Trade Safely
EnjoY!

MSTR may experience a monster recover? Using Elliott Waves to speculate on that. The risk-reward is too good to ignore, although this company carries inherently a high risk just because if its business model.

SMR 1D: Small reactors. Big nerves.I am looking at NuScale Power without emotions. After a strong impulsive move, the price is in a deep correction phase and is now forming a base. The key focus is not old trendlines, but current market behavior. On the daily chart, RSI reached oversold levels and started to turn up, while price is n

NVDADear Traders,
here my analysis for NVDA On weekly i see it can be bullish..
lets see if it can play

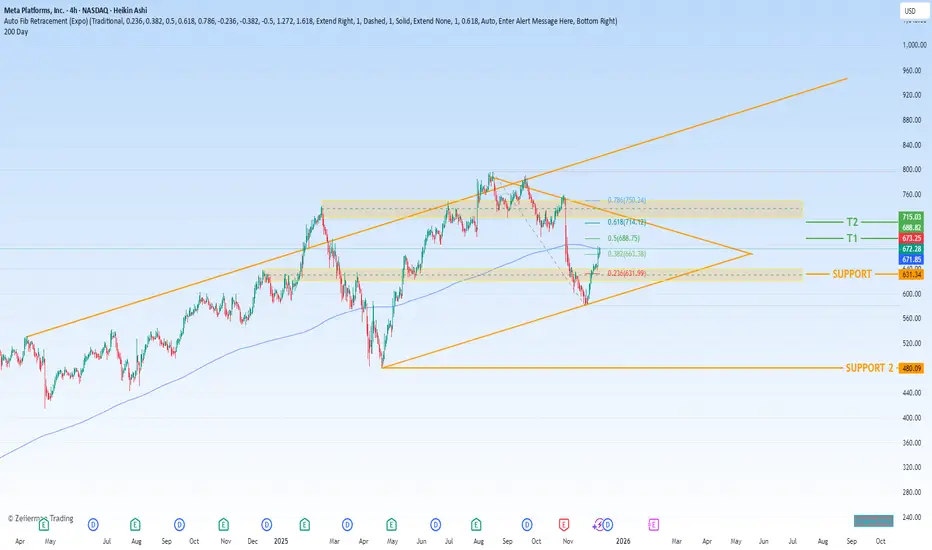
META Regains Direction as Price Rebuilds MomentumMeta Platforms is showing a constructive shift in price behaviour on the 4H timeframe after a corrective phase, with structure beginning to realign in favour of continuation. The recent recovery suggests buyers are gradually reasserting control as the market reassesses growth expectations and broade

See all stocks ideas
Today
EBFEnnis, Inc.
Actual
0.42
USD
Estimate
0.41
USD
Tomorrow
GTIMGood Times Restaurants Inc.
Actual
—
Estimate
—
Tomorrow
USBCUSBC, Inc.
Actual
—
Estimate
−2.40
USD
Tomorrow
LMNRLimoneira Co
Actual
—
Estimate
−0.11
USD
Dec 31
MSSMaison Solutions Inc.
Actual
—
Estimate
0.00
USD
Dec 31
JVACoffee Holding Co., Inc.
Actual
—
Estimate
—
Dec 31
KAVLKaival Brands Innovations Group, Inc.
Actual
—
Estimate
—
Jan 1
LNNLindsay Corporation
Actual
—
Estimate
1.47
USD
See more events
Community trends
Bitcoin - Channel no one talks about! (new Year's crash!)Bitcoin's price and development (code) are completely controlled by banks and government. They already have a roadmap on Bitcoin price, so they know what the price will be in 2030. Bitcoin technology is great for total control because all transactions are public. How to profit from that? First of al

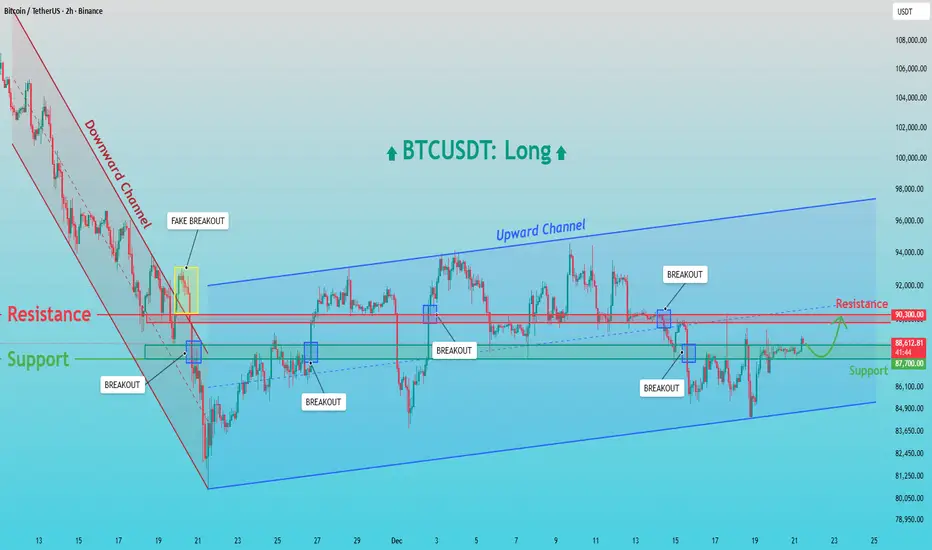
BTCUSDT: Holds Demand - Retest of 90,300 Resistance LikelyHello everyone, here is my breakdown of the current BTCUSDT setup.
Market Analysis
BTCUSDT recently transitioned from a strong downward channel into a broader bullish recovery phase. After a prolonged bearish move, price formed a base near the channel low, where selling pressure weakened. This le
Bitcoin: Won't Break Support, Back To 95K?Bitcoin continues to maintain the broader support around the low 80Ks. While this formation appears to be a lower high consolidation (bearish), it could also be the key inflection point for a reversal back into a bullish structure. This possibility aligns with the broader bullish trend which is stil

ETH/USD Bearish Structure with Downside TargetsETH/USD is showing clear bearish pressure after repeated failures to sustain above the highlighted supply zone around the 3,050–3,100 area. Price action indicates a lower high structure, followed by a strong rejection from the Ichimoku cloud, suggesting sellers remain in control. The cloud ahead is

BITCOIN - Manipulation and liquidity hunting before the crash BINANCE:BTCUSDT.P is stuck in the range of 85K - 90K. There is no liquidity in the market, but at the same time, the downward trend continues...
Earlier, we discussed such a nuance as the breakdown of support for the upward local trend. The global trend is bearish, and this nuance generally in

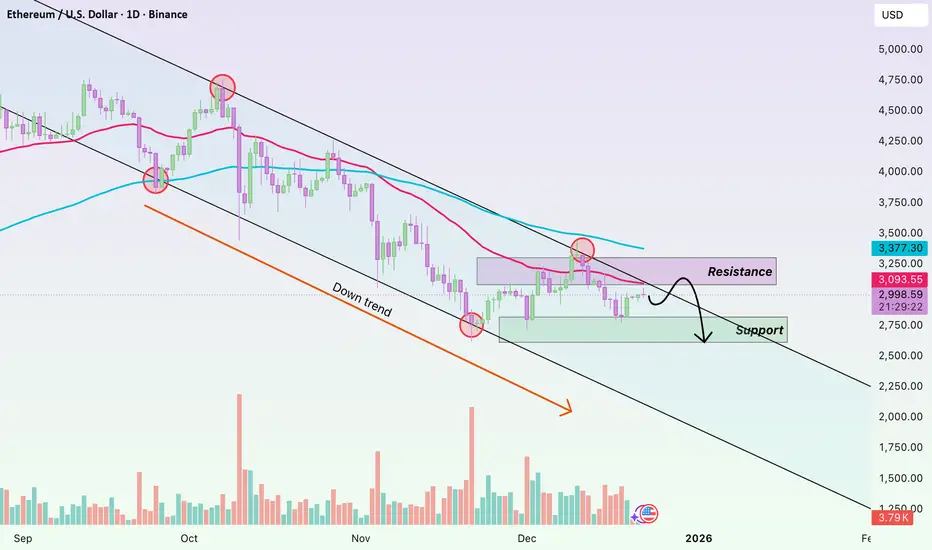
ETHUSD – Technical Rebound Within a DowntrendHello, this is Domic.
Looking at the ETH daily chart, the current picture is quite clear: the primary trend remains bearish, and the recent upside move should only be viewed as a technical rebound.
Price is still trading below both EMA34 and EMA89, with EMA34 having crossed below EMA89 and both m
BITCOIN 'From Denial of the Bear Cycle to Bitcoin going to 0'We've been showing you since September why Bitcoin (BTCUSD) was structured to start a new Bear Cycle in October, mostly based on the very accurate 4-year Cycle Theory. Recently we've published analyses of the last indicators that practically confirmed that the market has already entered this Bear Cy

AAVE: The Squeeze Is OnWe're watching a textbook compression pattern on AAVE—price trapped between ascending support at $173.25 and descending resistance at $198.53. These narrowing wedges don't last forever. The question isn't if it breaks, it's which direction and how violently. Current price: $175.48.
1. THE TECHNICA

Ethereum (ETHUSDT): Short-Term Recovery Attempt Hi guys!
ETH is still trading inside a well-defined descending channel, keeping the broader short-term structure bearish. The previous upside breakout attempt near the upper boundary resulted in a clear fakeout, confirming strong supply pressure at higher levels. Following that rejection, price exp

Elise | BTCUSD – 30M – Compression Below Major SupplyBITSTAMP:BTCUSD
After a strong impulsive rally from the HTF demand zone (~86.8K), BTC transitioned into consolidation while respecting trend support. Multiple reactions from the trendline (purple circles) confirm buyer presence. However, upside progress is slowing as price meets heavy sell-side li

See all crypto ideas
Lingrid | GOLD Weekly Outlook: Pause Before the Next Surge OANDA:XAUUSD push toward the $4,400 psychological barrier encountered resistance, stalling just shy of a decisive breakout as market momentum softened ahead of the year-end holidays. This is not a reversal, but a classic consolidation—a necessary pause to digest gains and reset for the next leg hig

XAUUSD Demand Holding - Resistance Retest in PlayHello traders! Here’s my technical outlook on Gold (XAUUSD, 4H) based on the current chart structure. After a strong bullish impulse from the 3,650–3,700 area, price formed a clear ascending channel, respecting both rising support and resistance. Higher highs and higher lows continue to confirm bull

GOLD 1H CHART ROUTE MAP UPDATE & TRADING PLAN FOR THE WEEKHey Everyone,
Please see our 1h chart levels and targets for the coming week.
We are seeing price play between two weighted levels with a gap above at 4360 and a gap below at 4327, as support. We will need to see ema5 cross and lock on either weighted level to determine the next range.
We will se

XAUUSDHello Traders! 👋
What are your thoughts on GOLD?
Gold is currently trading near its all-time high (ATH) and the upper boundary of a short-term ascending channel.
This zone has acted as a strong resistance area, where price has been rejected multiple times in the past.
As long as price remains belo

GOLD - We've updated ATH. What's next? A correction?FX:XAUUSD hit a new all-time high, approaching $4,425, for a bunch of reasons, one of which is increased interest in hedging against geopolitical risks...
Fundamental situation:
The US has increased sanctions pressure on Venezuela. Israel is considering options for attacking Iran's nuclear p

XAU/USD | Gold Breaks Above $4400 and Prints a New ATH!By analyzing the #Gold chart on the 4H timeframe, we can see that after the analysis we posted on Thursday, price first had a small correction and then resumed its move higher. With the market reopening today, gold showed strong momentum and finally broke above $4400, printing a new all-time high. P

XAUUSD Bullish Continuation Toward 4374XAUUSD (30M) Short Description:
Gold is holding above key support around 4335–4320 after a pullback. Price is showing bullish continuation potential, with resistance near 4357. A break and hold above resistance could push price toward the 4374 target, while major support remains around 4307.

THE KOG REPORT THE KOG REPORT:
In last week’s KOG Report we again published the predictive path and expected price to stay within the range but attempt that high. We managed to follow that path nearly to the tee capturing the high, the low and then the RIP from the level of defence we had given.
A great week

New Highs, No Sell-Off — Smart Money In?Based on the current news backdrop combined with the price structure on the chart , I continue to hold the view that XAUUSD is in a clear and healthy uptrend — not a temporary or emotional spike.
Gold setting a new all-time high around 4,400 shows that the market is strongly pricing in the

Elise | XAUUSD – 30M -Liquidity Sweep → Trend Continuation SetupOANDA:XAUUSD
The sharp downside spike into 4308 was a liquidity grab, not a breakdown. Buyers stepped in aggressively, flipping momentum and pushing price back into a controlled bullish leg. Current pullback is corrective, not impulsive — suggesting continuation toward higher resistance if structu

See all futures ideas
GBP/USD - H4 Weekly Outlook- Channel Breakout📝 Description 🔍 Setup (Market Structure) OANDA:GBPUSD
GBP/USD is trading inside a rising channel on H4 and has recently shown a channel breakout attempt followed by a retest near the upper zone. Price is now consolidating under a key resistance area, making this a decision week.
🔴Higher highs &

EURUSD Short: Head & Shoulders at Resistance - Target 1.1670Hello, traders! EURUSD previously traded within a well-defined Descending Channel, confirming sustained bearish pressure and controlled sell-side momentum. Price consistently respected the channel boundaries, forming a sequence of lower highs and lower lows. Multiple breakout attempts occurred withi

USDCAD – Bullish Harmonic Completion at Key SupportUSDCAD – Bullish Harmonic Completion at Key Support
USDCAD has completed a clear bullish harmonic pattern, with price reacting precisely from the D completion zone.
This pattern is increasing the probability of a technical rebound from this area.
After the strong bearish leg into point D, price

EURUSD Breakout and Potential RetraceHey Traders, in today's trading session we are monitoring EURUSD for a buying opportunity around 1.17200 zone, EURUSD was trading in a downtrend and successfully managed to break it out. Currently is in a correction phase in which it is approaching the retrace area at 1.17200 support and resistance

GBP/USD | BSLs ahead! (READ THE CAPTION)As you can see in the hourly chart of GBPUSD, it has broken through both the FVG and IFVG and is now in the supply zone. There are BuySide Liquidities above at 1.34466 and 1.34559 which I expect to be swept away.
Mind the fact that we don't have any impactful news today and is practically the last

EURUSD Fake Breakout Signals Pullback to 1.1700 SupportHello traders! Here’s my technical outlook on EURUSD (4H) based on the current chart structure. EURUSD is trading within a broader bullish recovery after completing a prolonged corrective phase. Earlier, price broke above a descending resistance line, which marked a clear shift in market structure a

USDCAD bullish consolidation structure insideUSDCAD consolidation in a strong bearish trend for a long period, with price consistently making lower highs and lower lows. This selling pressure pushed the market down toward a major demand/support zone around 1.3750–1.3780, where price finally started to slow down.
After reaching this support ar

AUDUSD Pressured by the Trendline – Chasing BUYs Is Very RiskyOn the H4 timeframe, AUDUSD presents a very clear technical picture: the primary trend remains bearish / sideways-dow n , and the current upswing is more of a technical pullback into supply rather than a genuine trend reversal.
On the chart, price is being pressed down by a descending trendline

Lingrid | EURUSD Brief Decline Before Bullish MoveFX:EURUSD perfectly played out my previous trading idea . Price recently tagged the upper resistance band near 1.1800, printing a higher high before momentum cooled and price rotated lower into the broken range. The pullback is unfolding toward the channel border and former breakout area, which ma

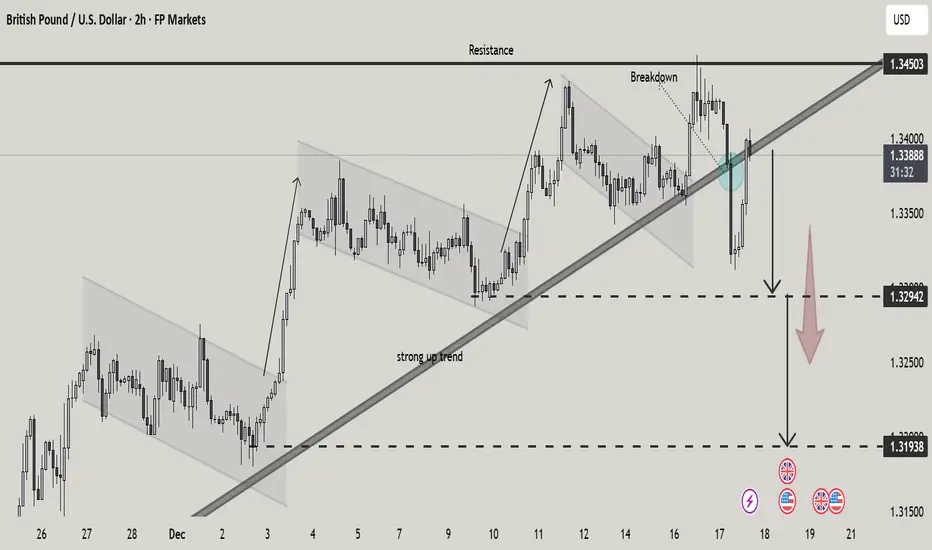
GBPUSD Trendline Breakdown Deeper Pullback from Key ResistanceThis 2-hour GBP/USD chart highlights a strong bullish structure built on a rising trendline, with price respecting higher lows throughout early December. Multiple ascending and corrective channels show controlled upside momentum.
Price recently tested a major resistance zone near 1.3450, failed to h
See all forex ideas
| - | - | - | - | - | - | - | ||
| - | - | - | - | - | - | - | ||
| - | - | - | - | - | - | - | ||
| - | - | - | - | - | - | - | ||
| - | - | - | - | - | - | - | ||
| - | - | - | - | - | - | - | ||
| - | - | - | - | - | - | - | ||
| - | - | - | - | - | - | - |
Trade directly on Supercharts through our supported, fully-verified, and user-reviewed brokers.


