From Shutdown Relief to AI Anxiety — Two Narratives Driving ESMarket Theme
The week began on a strong footing, driven by a bullish Sunday reopen in ES after news broke that the 43-day government shutdown was set to end, following the Senate’s late-night support for a potential agreement on November 9th. This relief catalyst created early upside momentum, pus

The best trades require research, then commitment.
Get started for free$0 forever, no credit card needed

Scott "Kidd" PoteetThe unlikely astronaut

Where the world does markets
Join 100 million traders and investors taking the future into their own hands.

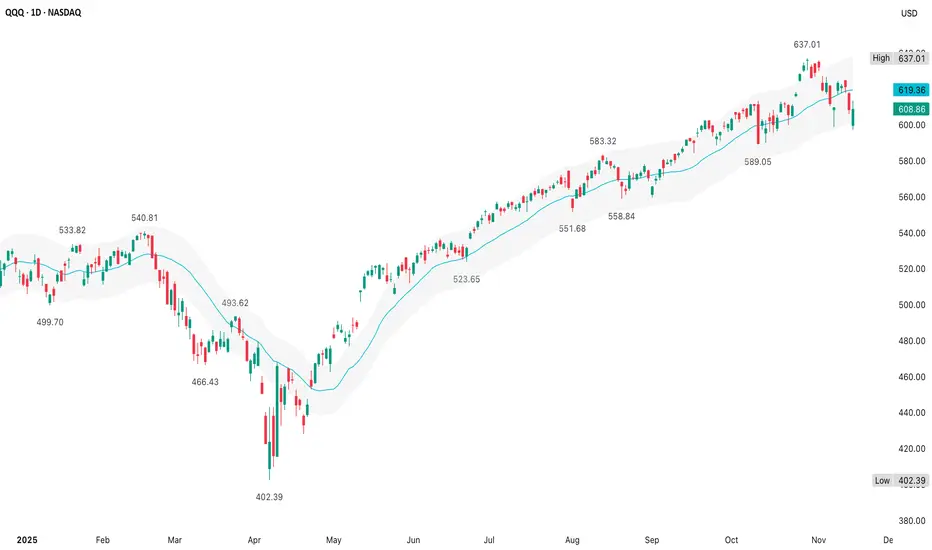
QQQ (14 November)The +/- 3% envelope with the 20d MA works well for mean-reversion strategies since it clearly shows inflection points where price may snap back toward the average
How far is price from its 20d MA & is price near extremes of the 3% bands?
Bollinger Bands adjust dynamically with volatility
Price
Technical analysis of bitcoin key levels and wedge chart pattern1. Trend Structure
The descending trendline (Resistance line) at the top of the chart remains valid.
The price has repeatedly faced rejection at this level, indicating that the medium-term downtrend is still intact.
2. Key Price Levels and Indicators
50-week EMA
The price has recently

Bitcoin FOMOThe technical levels I am watching in the near term are:
Upside Resistance:
104800
117,500
All Time High
Downside Support
87,700
84,100
Throughout this bull cycle, starting from the low in November 2022, following the January 2023 Ichimoku breakout that truly triggered the bull tre

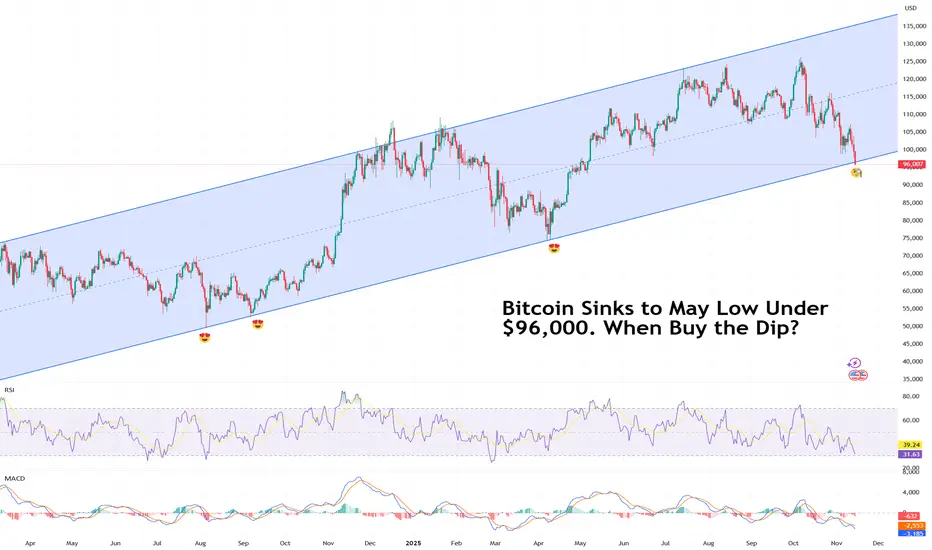
Bitcoin Sinks to May Low Under $96,000. When Buy the Dip?Because sometimes the dip just keeps on dipping.
Bitcoin BITSTAMP:BTCUSD can’t seem to catch a break. The flagship crypto slid below $96,000 on Friday, a level last seen in May, and traders aren’t exactly rushing to buy the dip.
The decline caps a tough few weeks for the OG coin, now lower by
When Arctic Storm Meets Government ShutdownNYMEX: Micro Henry Hub Natural Gas Futures ( NYMEX:MNG1! )
A “Perfect Storm” is brewing by weather catastrophe and man-made events.
On Thursday, November 6th, forecaster Atmospheric G2 said that it predicted colder than normal weather over the Eastern US for November 11-15. Driven by the expectati

ASTS 4H: space internet or orbital dream?AST SpaceMobile (ASTS) is consolidating above the $61–69 zone, right near the 0.618 Fibonacci level of its last major rally. On the 4H chart, momentum shows early reversal signs: falling volume on pullbacks, stochastic turning up, and buyers defending local lows. The bullish setup holds as long as p

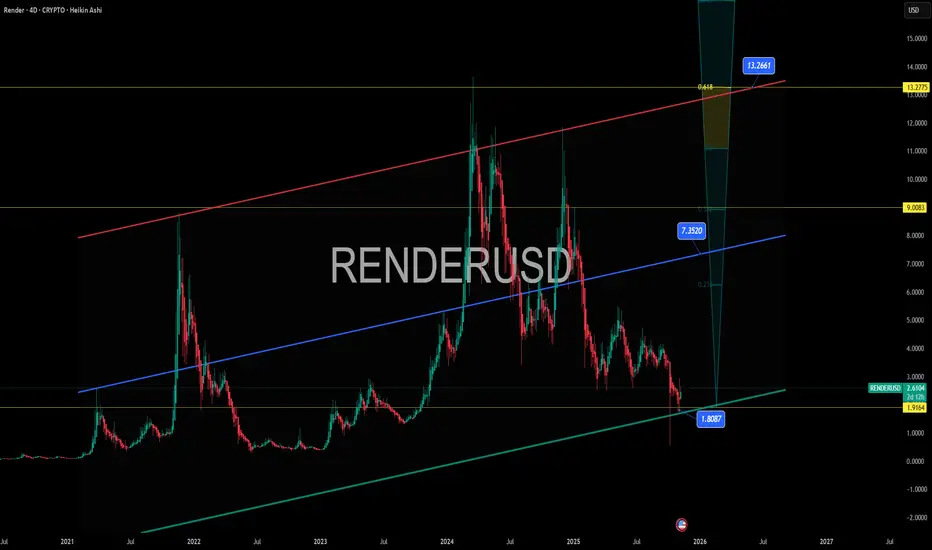
RENDER – Nvidia’s Favorite GPU Coin Testing Demand Zone RENDER – Nvidia’s Favorite GPU Coin Testing Demand Zone 🔍🎯
Render just kissed the $1.91–$2.00 demand zone — the base of the macro channel and a textbook long-term retest level.
This is not just any altcoin. Render powers the Las Vegas Virtual Dome and is the only crypto Nvidia has ever name-drop
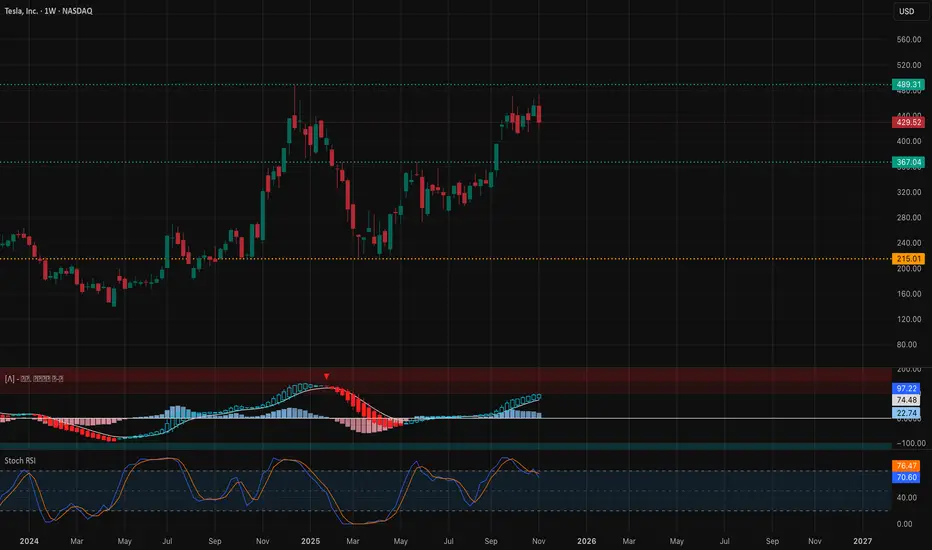
TSLA Setting Up for a Big Move This Week (Nov 10–14)Here’s the full multi-timeframe outlook for TSLA based on SMC structure, channels, BOS/CHoCH shifts, momentum, and the GEX map. Each section is separated so you can attach the matching chart under it.
1. Weekly Timeframe (1W)
Macro Structure
TSLA is still holding its bigger weekly breakout after cl
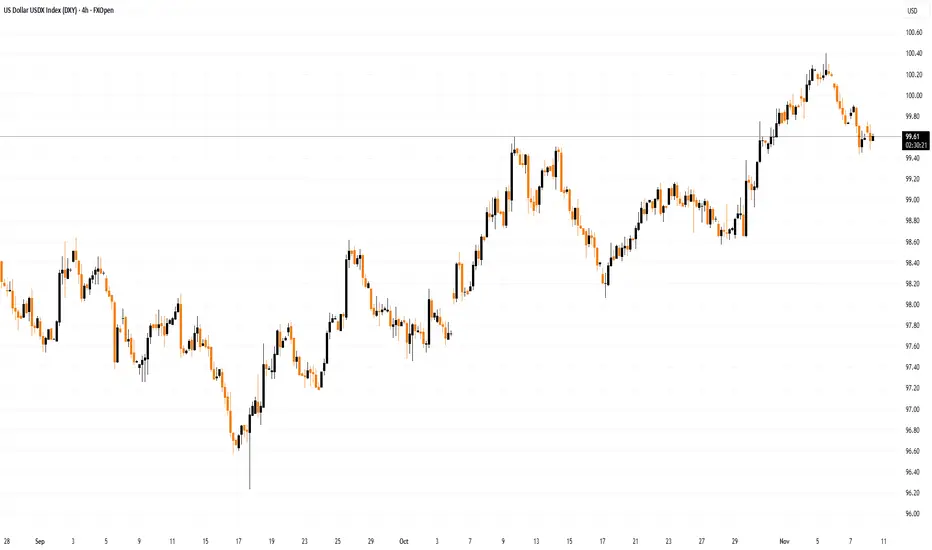
Dollar Index Pulls Back from a Key HighDollar Index Pulls Back from a Key High
As the Dollar Index (DXY) chart shows, the index is currently trading below its 5 November high, which formed after a false bullish breakout (marked by an arrow) above the 1 August peak — a scenario previously outlined in the post “The Dollar Index Near a Ke
See all editors' picks ideas
Holographic Market Microstructure | AlphaNattHolographic Market Microstructure | AlphaNatt
A multidimensional, holographically-rendered framework designed to expose the invisible forces shaping every candle — liquidity voids, smart money footprints, order flow imbalances, and structural evolution — in real time.
---
📘 Overview
The Hol

PriceFormatLibrary for automatically converting price values to formatted strings
matching the same format that TradingView uses to display open/high/low/close prices on the chart.
█ OVERVIEW
This library is intended for Pine Coders who are authors of scripts that display numbers onto a user's charts. T

LogNormalLibrary "LogNormal"
A collection of functions used to model skewed distributions as log-normal.
Prices are commonly modeled using log-normal distributions (ie. Black-Scholes) because they exhibit multiplicative changes with long tails; skewed exponential growth and high variance. This approach i

Range Oscillator (Zeiierman)█ Overview
Range Oscillator (Zeiierman) is a dynamic market oscillator designed to visualize how far the price is trading relative to its equilibrium range. Instead of relying on traditional overbought/oversold thresholds, it uses adaptive range detection and heatmap coloring to reveal where pri

Volume Surprise [LuxAlgo]The Volume Surprise tool displays the trading volume alongside the expected volume at that time, allowing users to spot unexpected trading activity on the chart easily.
The tool includes an extrapolation of the estimated volume for future periods, allowing forecasting future trading activity.
🔶 U

Smooth Theil-SenI wanted to build a Theil-Sen estimator that could run on more than one bar and produce smoother output than the standard implementation. Theil-Sen regression is a non-parametric method that calculates the median slope between all pairs of points in your dataset, which makes it extremely robust to o

Fair Value Gaps by DGTFair Value Gaps
A refined, multi-timeframe Fair Value Gap (FVG) detection tool that brings institutional imbalance zones to life directly on your chart.
Designed for precision, it visualizes how price delivers into inefficiencies across chart, higher, and lower (intrabar) timeframes — offering a fl

TASC 2025.11 The Points and Line Chart█ OVERVIEW
This script implements the Points and Line Chart described by Mohamed Ashraf Mahfouz and Mohamed Meregy in the November 2025 edition of the TASC Traders' Tips , "Efficient Display of Irregular Time Series”. This novel chart type interprets regular time series chart data to create an ir

Simplified Percentile ClusteringSimplified Percentile Clustering (SPC) is a clustering system for trend regime analysis.
Instead of relying on heavy iterative algorithms such as k-means, SPC takes a deterministic approach: it uses percentiles and running averages to form cluster centers directly from the data, producing smoo

Adaptive Volume Delta Map---
📊 Adaptive Volume Delta Map (AVDM)
What is Adaptive Volume Delta Map (AVDM)?
The Adaptive Volume Delta Map (AVDM) is a smart, multi-timeframe indicator that visualizes buy and sell volume imbalances directly on the chart.
It adapts automatically to the best available data resolution

See all indicators and strategies
Community trends
Nvidia - Now is the time to go short!💣Nvidia ( NASDAQ:NVDA ) is now creating a top:
🔎Analysis summary:
Just a couple of days ago, Nvidia perfectly retested a major resistance trendline. Always in the past, such a retest was followed by a major move towards the downside. Therefore, Nvidia is preparing for a major drop, which coul

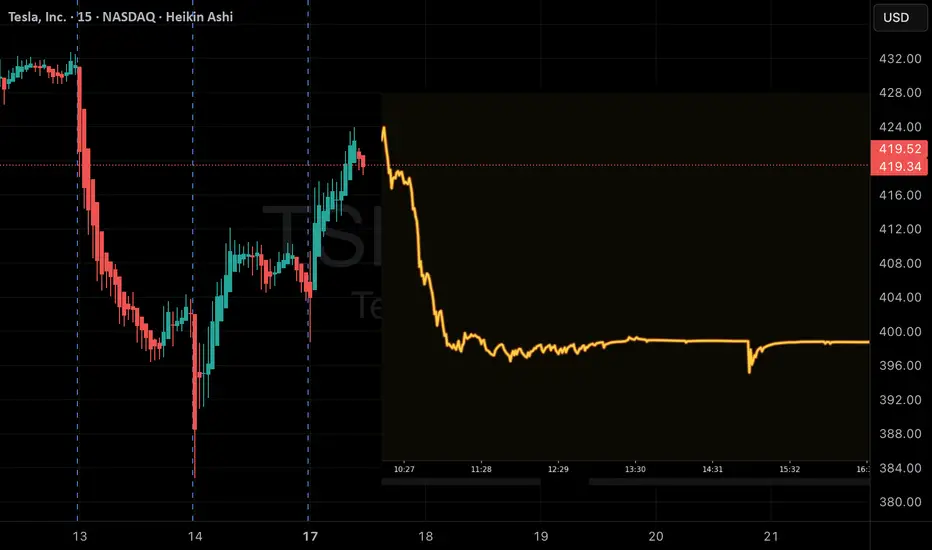
Double Top - Rejection CandlesI do believe we are in the beginning innings of a mild "bear" market for the rest of the year. Too many folks wanting to sell high beta/valuation names. Add the Mag 7 collapse risk and TSLA is particularly vulnerable and may get unwound back to mid 300s.
We do have NVDIA earnings this Wednesday a

GooglGoogl finished with a weekly bearish engulfing
It's first since March 2025
Currently 25% extended from its weekly 20sma .. last 3 times googl extended past its 20sma over 16% a draw down occurs
Completely detached from its monthly Bollingerband; This a huge red flag! You don't chase longs u

CoreWeave Set to Drive Lower?📉 NASDAQ:CRWV remains in a strong and clean downtrend, ever since topping out near the $170 region. The chart continues to show a consistent sequence of Lower Highs → Lower Lows, telling us that sellers are still fully in control. Each time the price tried to bounce, it was immediately rejected a

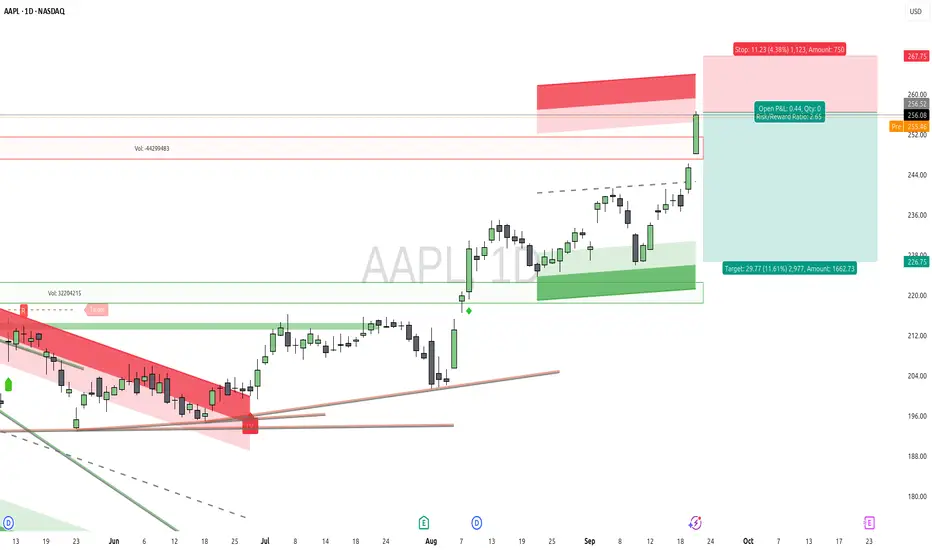
$AAPL: The Market's Breath | A Contrarian Perspective at a Point"My capital is finite, but opportunity is infinite. I will not risk my finite capital on an 'okay' setup when a perfect one is inevitable. I can miss this move and feel nothing, because the next one is already forming."
This is a core tenet for those of us who aim to trade without limits—not finan
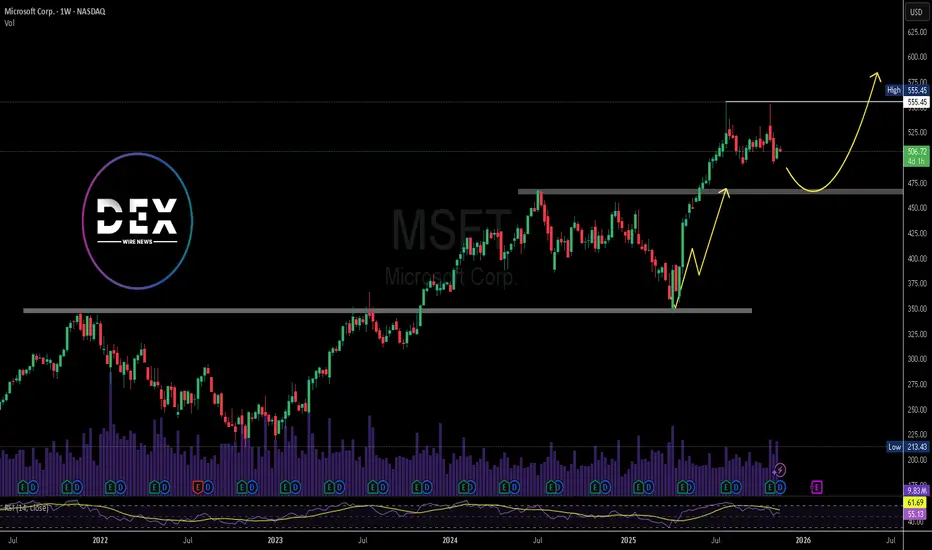
Microsoft Approaches Key Level, Expands Xbox Design Lab GloballyMicrosoft has announced a major expansion of its Xbox Design Lab through a new global partnership with ESW, significantly widening its international ecommerce footprint. Xbox Design Lab allows gamers to create personalized Xbox Wireless Controllers and Elite Series 2 controllers. With ESW now servin
META now close to a critical trendlineMETA is approaching a significant technical region.
The trendline currently in focus originated on 31 October 2022, and it has remained relevant over time.
This same trendline was retested twice in April of this year, and price action is once again moving toward it after achieving a new all-time

TTD massive and explosive growth TTD has proven to be an underrated competitor in the stock market . It has beaten earnings in the last report , and has touched its proven major major support level of 45 numerous rimes. Based on Jesus and my analysis. It’s expected to go above 72$ this week with a massive recovery book to the upsid

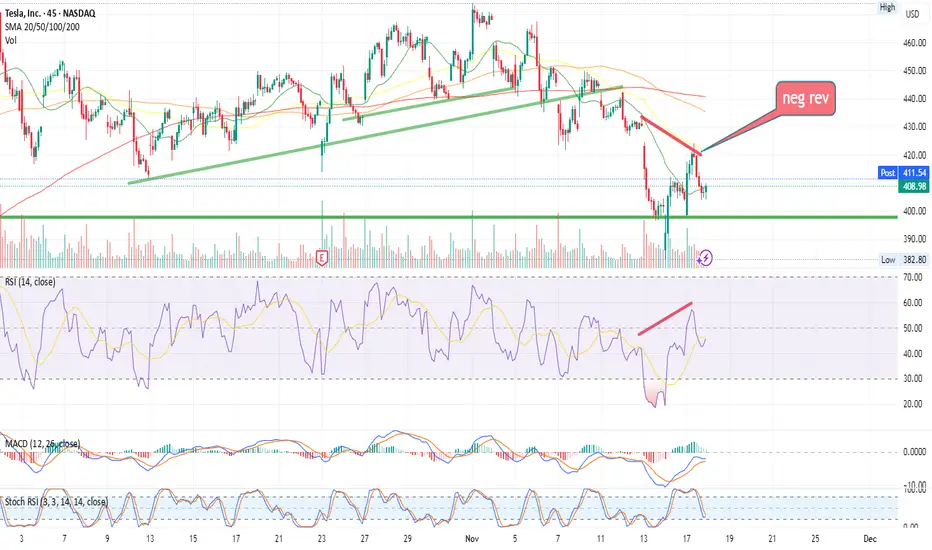
tsla negative rev on smaller timelooking like tomorrow will be seeing a downward continuation on the smaller time. to invalidate we need a push above 425.00 to have a failed signal.
QuantSignals V3 | TSLA Breakdown SetupTSLA QuantSignals Katy 1M Prediction 2025-11-17
Symbol: TSLA
Price: 415.30
Model: Katy AI — 1M Prediction
Trend: Bearish
Confidence: 75%
🔮 Vision Summary
TSLA shows a bearish short-term structure, with the model forecasting a move toward 403.52
(-2.84%). Momentum is shifting lower, and volatility
See all stocks ideas
Today
HDHome Depot, Inc. (The)
Actual
3.74
USD
Estimate
3.84
USD
Today
ASAmer Sports, Inc.
Actual
0.33
USD
Estimate
0.25
USD
Today
OCSLOaktree Specialty Lending Corporation
Actual
0.41
USD
Estimate
0.39
USD
Today
ITRNIturan Location and Control Ltd.
Actual
0.74
USD
Estimate
0.69
USD
Today
MDTMedtronic plc.
Actual
1.36
USD
Estimate
1.31
USD
Today
ENREnergizer Holdings, Inc.
Actual
1.05
USD
Estimate
1.12
USD
Today
ACMAECOM
Actual
1.36
USD
Estimate
1.34
USD
Today
ULBIUltralife Corporation
Actual
−0.07
USD
Estimate
0.21
USD
See more events
Community trends
Bitcoin: Extreme support 91k! Big pump soon (easy, watch this)Bitcoin is in a critical situation because the price broke the falling wedge, and instead of a bullish breakout, we see a bearish breakdown! I expected this price action, please look at my previous posts. The falling wedge in general is a bullish pattern, but in bear markets they are bearish pattern

Bitcoin – A Gentle Slide Into A Strong ReactionBitcoin continues to trade inside a clean falling channel, moving lower in a controlled manner as it approaches a major support zone. The overall flow remains bearish in the short term, however the structure suggests we are nearing an area where a short term bullish reaction becomes highly probable.

The Market is at 80°C. What Happens at 100°C?Greetings, everyone.
Today, I don't want to talk about the news. I want to talk about what truly matters: market structure. Many traders are currently looking for a news event to explain the current lull and predict Bitcoin's next move. They are looking in the wrong direction.
Remember this: the n
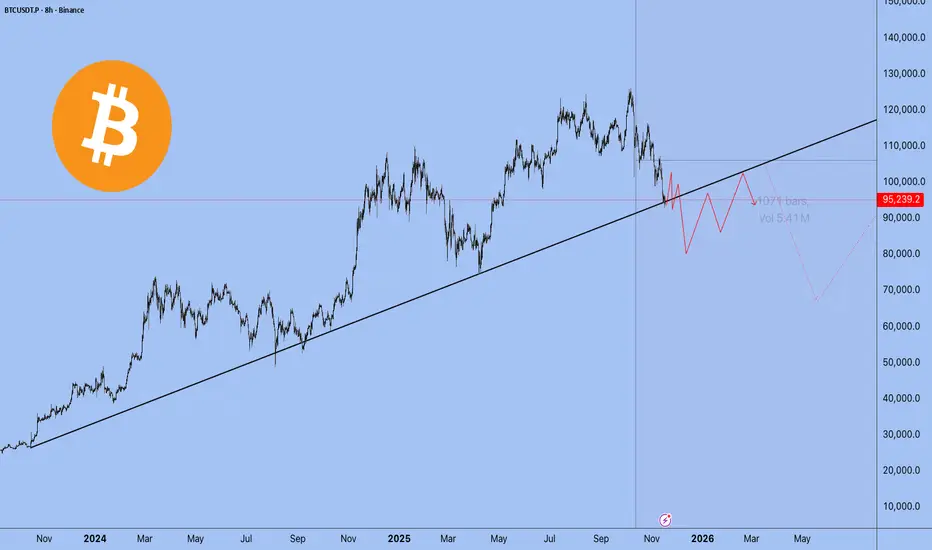
BITCOIN : First Drop Then Shoot Up To $150,000Overview🧠
Bitcoin is in a bearish trend since it reversed from our previous trading zone. We expect the price to continue declining between 60,000 and 70,000. This is a suitable time to consider buying Bitcoin. Once the trade is activated, there are three potential targets: 90,000, 120,000 and 150,

BTCUSDTHello Traders! 👋
What are your thoughts on BITCOIN?
Bitcoin has dropped into the marked support zone, where a bullish reaction is likely in the short term. From this area, price may attempt a move back toward the descending trendline.
The key focus will be on how price reacts once it reaches the t

Bitcoin (BTCUSDT) – Short-Term Bearish StructureHi!
The chart shows BTC moving inside a descending channel, with consistent lower highs and lower lows confirming a controlled downtrend. Recent price action attempted to push back into the QML (Quasimodo Level) area, but the reaction there shows clear rejection, suggesting supply remains in contro

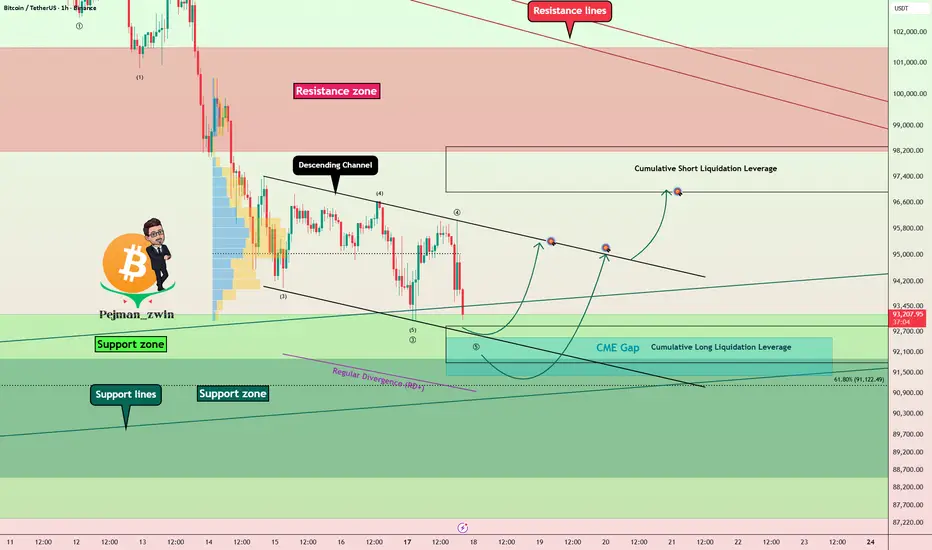
Bitcoin Roadmap: Major Support Ahead — Bounce or Breakdown?As expected in the previous idea , Bitcoin ( BINANCE:BTCUSDT ) has dropped to $93,040(Target done) .
The question now is whether Bitcoin will continue its downward trend or not.
Currently, Bitcoin is moving near the Support zone($93,200-$87,340) and key Support lines .
From the perspect
BITCOIN The 1W MA50 Bear confirmation you didnt want, happened..Bitcoin (BTCUSD) just closed last week below its 1W MA50 (blue trend-line) for the first time since March 06 2023. Since that break-out, the 1W MA50 had been tested and held on 3 major occasions within the Bull Cycle, providing the most optimal mid-Cycle entries during those 2.5 years.
What's even

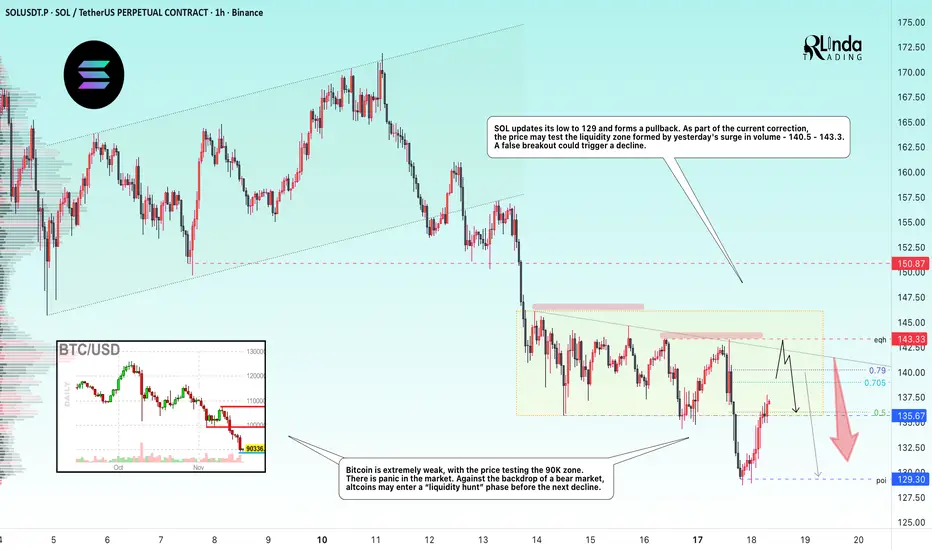
SOLANA → Hunting for liquidity in a weak market BINANCE:SOLUSDT is forming a countertrend correction. Zone of interest: 140.0–143.5. The lack of bullish potential and positive fundamentals could cause another decline...
Bitcoin is extremely weak, with the price testing the 90K zone. There is panic in the market. Against the backdrop of a be
BTCUSD Rebounds From Channel Support — Targeting $93K PullbackHello traders! Let’s break down the current BTCUSD market structure. Bitcoin continues to move within a well-defined descending channel, where price has repeatedly respected both the resistance and support lines. Every touch of the upper boundary resulted in a Turned Around reaction, confirming stro

See all crypto ideas
Gold 30-Min — Volume Sell Reversal Triggered⚡Base : Hanzo Trading Alpha Algorithm
The algorithm calculates volatility displacement vs liquidity recovery, identifying where probability meets imbalance.
It trades only where precision, volume, and manipulation intersect —only logic.
✈️ Technical Reasons
/ Direction — SHORT / Reversal 4090 Area

XAU/USD | Gold Approaching Key Intraday Supply Zone! (READ)By analyzing the #Gold chart on the 4H timeframe, we can see that after dropping to 3998 dollars, price found strong demand and has now climbed back up to around 4050 dollars.
Keep an eye on the 4056–4064 zone for a potential SELL reaction, as this is a key supply area.
This analysis will be updated

NQ Year End Range (11-17-25)Recent price action is looking like what we saw late 2024 into 2025, prior to 26% drop (Feb,25). You can view the Post here:
The lift back up from the 26% drop has been a 60% run up on low volume, including the 10 minute 12% pop from Wash ST. "time to buy" Tweet. NAZ under long term TL (Orange tren

Lingrid | GOLD Key Confluence Zone -Long OpportunityOANDA:XAUUSD is testing the confluence support after completing a clean pullback from the previous weekly high (PWH) and the resistance zone. The market structure shows price reacting along the channel border while holding above the broader triangle breakout region and key psychological level at 4,

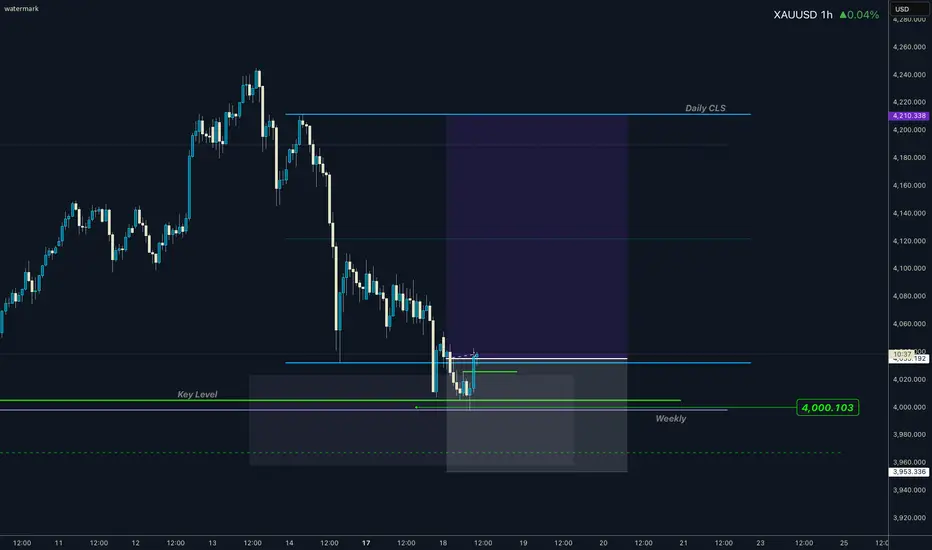
GOLD I Daily CLS I Model 1 nested in Weekly CLSHi friends, new range created. As always we are looking for the manipulation in to the key level around the range. Don't forget confirmation switch from manipulation phase to the distribution phase to make the setup valid. Stay patient and enter only after change in order flow. If price reaches 50%
XAUUSD: Double Flag Setup, but with a "Warning"Things could get interesting this week.
In my previous analysis, I pointed out a big flag structure, with a smaller flag forming on top of it. But for the bullish scenario to actually happen, that second flag needs to break to the upside with strength…
THE PROBLEM? This retracement is already dee

XAUUSDHello Traders! 👋
What are your thoughts on GOLD?
Gold completed the expected bullish correction, reached the resistance zone and the broken trendline, and was strongly rejected from that area.
This rejection confirms continued bearish pressure in the market.
In the current region, we expect gold t

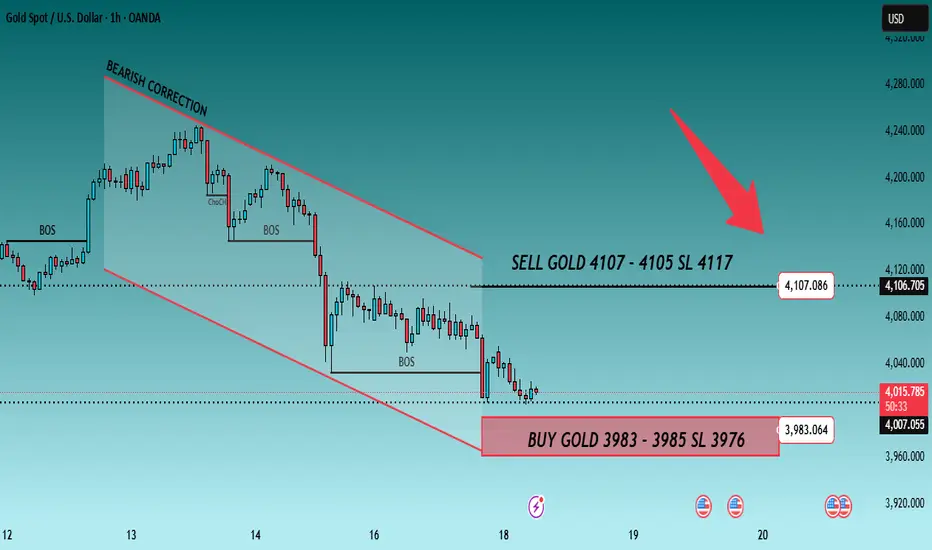
GOLD H1 – Hawkish Fed Pressure Ahead of Key NFP Data🟡 XAUUSD – Intraday Smart Money Plan | by Ryan_TitanTrader (18/11)
📈 Market Context
Gold is trading inside a bearish corrective channel as markets react to hawkish Federal Reserve commentary and positioning ahead of this week’s U.S. NFP data.
• Fed officials signaled a stronger stance against prema
XAUUSD: Bullish Rebound Setup as Price Holds Above Wedge SupportHello everyone, here is my breakdown of the current Gold setup.
Market Analysis
XAUUSD is currently maintaining a bullish market structure after rebounding from the key Wedge Support Line, which continues to act as a major dynamic support for the ongoing uptrend. The chart shows that Gold previou

XAUUSD (Gold) Retest setup from Demand zoneXAUUSD (Gold) showing downtrend approaching a marked demand zone with projected bullish arrows indicating a possible reversal and target level above.
The chart price moving with downtrend into labled demand zone. The chart includes BOS and CHOCH markers indicating structure breaks. Two projected a

See all futures ideas
EUR/USD - Ascending Triangle (17.11.2025)🧠 Setup Overview TICKMILL:EURUSD
EUR/USD has formed an ascending triangle, but instead of breaking upward, price failed at the horizontal resistance and slipped below the rising trendline — signaling potential bearish reversal. The pair is rejecting the 1.1650–1.1660 supply zone, and downside mo

EURUSD Rejected From Resistance — Pullback Toward 1.1560 in PlayHello traders! Let’s analyze the current EURUSD market structure. EURUSD continues to move within a broad descending channel, where both the Resistance Line and the Support Line have been respected multiple times, confirming a well-defined bearish market structure. Throughout the past sessions, pric

GBPUSD Buy Strategy: From Safe Zone to the TopGuys,
I have prepared a GBPUSD analysis for you.
📌 When GBPUSD reaches the 1.31642 - 1.31495 zone, I will open a buy position, aiming for the 1.37937 level as my target.
My friends, I share these analyses thanks to each like I receive from you. I sincerely thank all of you who support me with you

EURUSD - Outlook for next week!Introduction
EURUSD has been steadily climbing, maintaining a firm uptrend that continues to show strength in market structure. The series of higher highs and higher lows suggests that bullish momentum remains intact, with the market consistently respecting key demand zones on its way upward. As th
USDCHF I Monthly CLS I Model 1 I Target 50% of the rangeHi friends, new range created. As always we are looking for the manipulation in to the key level around the range. Don't forget confirmation switch from manipulation phase to the distribution phase to make the setup valid. Stay patient and enter only after change in order flow. If price reaches 50%

Sell EURAUDEURAUD great shorting opportunity. A trend line-based entry can be utilized here to execute this bearish flag pattern on EURAUD. November was always bearish

EUR/USD Targets 1.16300 After Trendline Rejection“EUR/USD trend is respecting the ascending support line with BOS confirmations. Price is expected to retest the trendline and push upward toward the 1.16300 target zone.”
If you want a title also, just tell me!

Warning: AUD/USD Sinking – Any Reversal Ahead?Hello everyone, today we’ll analyze the AUD/USD pair in the context of its clear downtrend.
In terms of news, the USD is strengthening due to expectations that the Federal Reserve (Fed) will keep interest rates high, putting pressure on the AUD. Additionally, the lack of supportive data from A

USD/CAD: Breakout Alert: 2 Strong Bullish Patterns Say YesAs you can see, 📈USDCAD is resuming its growth.
After completing a bullish accumulation, the price is currently breaking both the neckline of an ascending triangle and of an inverted head and shoulders formation on a 4H timeframe.
I anticipate that the price will continue to rise and reach the 1.

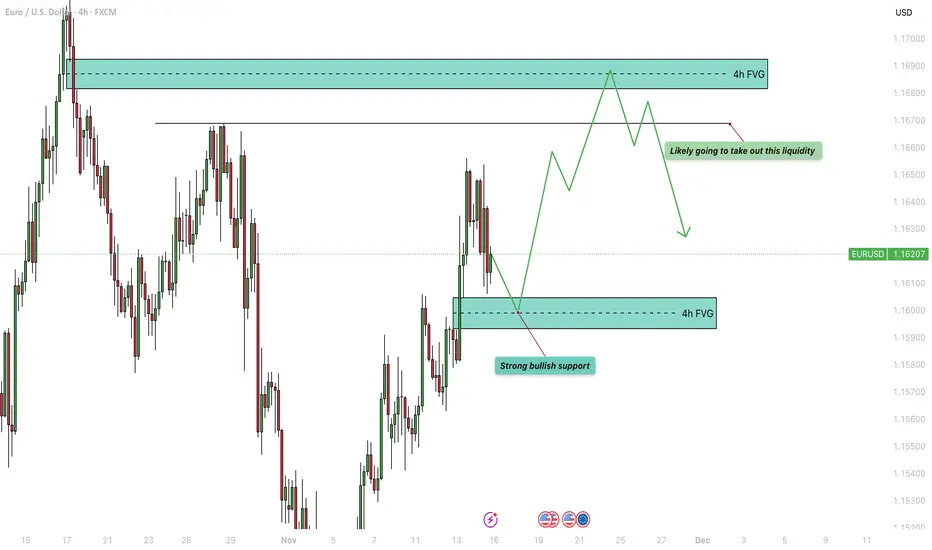
18.11.25 Morning ForecastPairs on Watch -
FX:EURAUD
FX:EURUSD
A short overview of the instruments I am looking at for today, multi-timeframe analysis down to what I will be looking at for an entry. Enjoy!

See all forex ideas
| - | - | - | - | - | - | - | ||
| - | - | - | - | - | - | - | ||
| - | - | - | - | - | - | - | ||
| - | - | - | - | - | - | - | ||
| - | - | - | - | - | - | - | ||
| - | - | - | - | - | - | - | ||
| - | - | - | - | - | - | - | ||
| - | - | - | - | - | - | - |
Trade directly on the supercharts through our supported, fully-verified and user-reviewed brokers.


