2025 Ends With a Breakout?Year Ends With a Breakout, yes!🚀📈
Bitcoin just delivered what the market was waiting for — a clean breakout back into the channel 🎯
This is how we close the year… with intent.
Key Technicals:
• Major support holding at 88,273 – 88,535
• ATA 200 support confirmed
• Price reclaimed the channel
Your 2025 space mission is here
Suit up and get ready to explore every highlight of your trading galaxy.


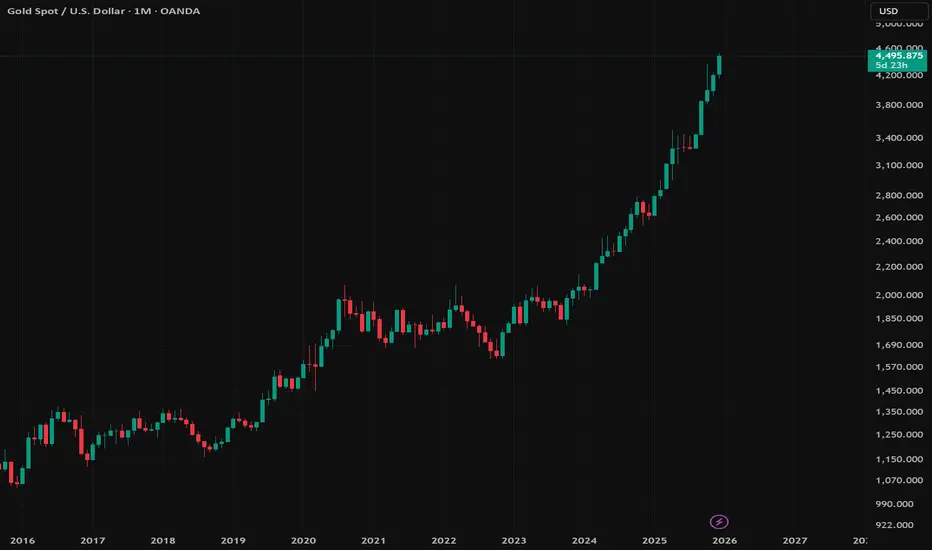
Gold Costs 175 Hours Of Work To BuyI like to price everything I buy in hours of work.
That’s the only price that actually matters.
Money can be replaced. Time can’t. When I look at a purchase in terms of how much of my life it costs, it becomes instantly clear whether it’s worth it.
My kids hate me for it because their view is that

JPM — Bullish Channel at Decision PointTechnical Overview
• Price is moving inside a well-defined ascending channel
• Currently testing the upper channel resistance
• Trend remains bullish as long as price holds above the channel midline & SMA
Bullish Scenario
• Confirmation: Strong daily close above the channel top (~330)
• Tar

Silver Price Surpasses $80 for the First Time.Silver Price Surpasses $80 for the First Time. Why Could This Be a Bearish Sign?
As the XAG/USD chart shows, earlier this morning the price of one ounce of silver reached above $83 for the first time. However, this move was followed by an abnormally sharp reversal to the downside.
Why Did the S

Silver’s 2025 Explosion — How High Can It Go?In 2025, Silver ( OANDA:XAGUSD ) has experienced a remarkable surge, making it one of the most notable assets of the year. As we approach the end of 2025, I’ve decided to analyze silver to see how far its bullish trend might continue. So, stay with me as we delve into the reasons behind silver’s ri

Bitcoin vs Gold: The Big Monthly Retest- Price is now back inside a huge support area that has mattered since 2021.
- In the past, this zone often marked bottoms where Bitcoin stopped losing vs gold and sometimes started a new run up.
- Recent move down = gold stronger than BTC lately.
- The idea on the chart:
- Some sideways

Bitcoin ascending channel and Cups -Next cycle Cup entered ? YES
Bitcoin ascending channel and Cups -Next cycle Cup entered
PA entered channel in march 2017 and has never left, other than to go to ATH.
Bitcoin has spent more time in and above this channel than out of it.
Since entering channel, PA has always bounced off the lower line of channel
For the sake

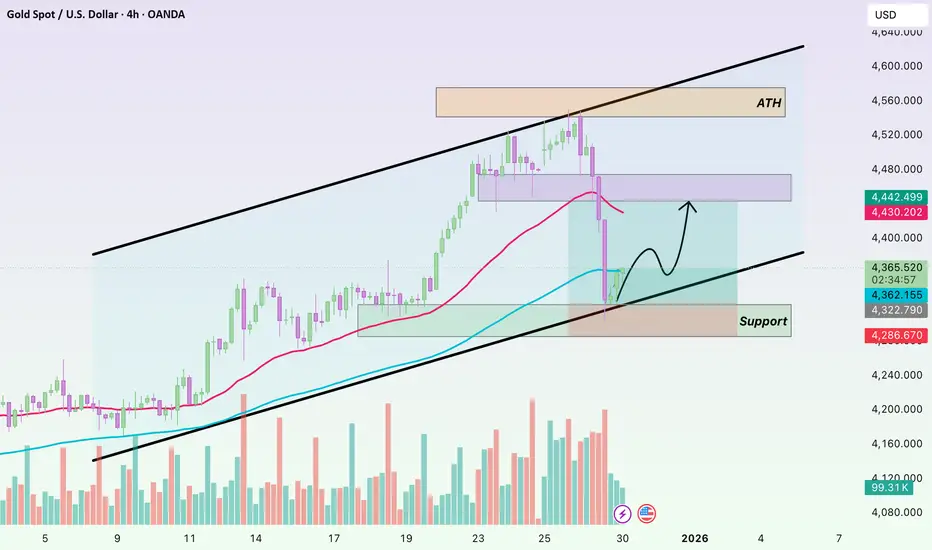
Gold – Potential 2025 Annual High Zone (Ongoing Price Discovery)Gold – Potential 2025 Annual High Zone
Date: December 26, 2025
Current Spot Price: 4489
Context:
Gold remains in an active price discovery phase, and the 2025 annual high has not yet been fully established. Recent upside expansion confirms that the market is still searching for its final year-end e
SPY – Dec 26 Trading Outlook | Trend Support vs Gamma Ceilingit’s now pressing into a zone where trend structure and GEX start to conflict. Tomorrow is about whether this pullback is a pause for continuation or the start of a deeper mean reversion.
Price action / structure (15m)
SPY remains in an intraday uptrend, respecting the rising trendline from the rec

Silver - This metal is blowing up now!💣Silver ( OANDA:XAGUSD ) is rallying even higher:
🔎Analysis summary:
Just a couple of months ago, we witnessed another bullish break and retest on Silver. It was quite obvious that Silver will rally accordingly and just recently, we experienced another +150% rally. However, looking at the hig

See all editors' picks ideas
Arbitrage Detector [LuxAlgo]The Arbitrage Detector unveils hidden spreads in the crypto and forex markets. It compares the same asset on the main crypto exchanges and forex brokers and displays both prices and volumes on a dashboard, as well as the maximum spread detected on a histogram divided by four user-selected percenti

Multi-Distribution Volume Profile (Zeiierman)█ Overview
Multi-Distribution Volume Profile (Zeiierman) is a flexible, structure-first volume profile tool that lets you reshape how volume is distributed across price, from classic uniform profiles to advanced statistical curves like Gaussian, Lognormal, Student-t, and more.
Instead of forcin

Multi-Ticker Anchored CandlesMulti-Ticker Anchored Candles (MTAC) is a simple tool for overlaying up to 3 tickers onto the same chart. This is achieved by interpreting each symbol's OHLC data as percentages, then plotting their candle points relative to the main chart's open. This allows for a simple comparison of tickers to tr

Vdubus Divergence Wave Pattern Generator V1The Vdubus Divergence Wave Theory
10 years in the making & now finally thanks to AI I have attempted to put my Trading strategy & logic into a visual representation of how I analyse and project market using Core price action & MacD. Enjoy :)
A Proprietary Structural & Momentum Confluence System

Per Bak Self-Organized CriticalityTL;DR: This indicator measures market fragility. It measures the system's vulnerability to cascade failures and phase transitions. I've added four independent stress vectors: tail risk, volatility regime, credit stress, and positioning extremes. This allows us to quantify how susceptible markets are

Volatility Risk PremiumTHE INSURANCE PREMIUM OF THE STOCK MARKET
Every day, millions of investors face a fundamental question that has puzzled economists for decades: how much should protection against market crashes cost? The answer lies in a phenomenon called the Volatility Risk Premium, and understanding it may fundam

Volume Gaps & Imbalances (Zeiierman)█ Overview
Volume Gaps & Imbalances (Zeiierman) is an advanced market-structure and order-flow visualizer that maps where the market traded, where it did not, and how buyer-vs-seller pressure accumulated across the entire price range.
The core of the indicator is a price-by-price volume prof

Match Finder [theUltimator5]Match Finder is the dating app of indicators. It takes your current ticker and finds the most compatible match over a recent time period. The match may not be Mr. right, but it is Mr. right now. It doesn't forecast future connection, but it tells you current compatibility for today.
Jokes aside,

Trend Line Methods (TLM)Trend Line Methods (TLM)
Overview
Trend Line Methods (TLM) is a visual study designed to help traders explore trend structure using two complementary, auto-drawn trend channels. The script focuses on how price interacts with rising or falling boundaries over time. It does not generate trade sign

Breakouts & Pullbacks [Trendoscope®]🎲 Breakouts & Pullbacks - All-Time High Breakout Analyzer
Probability-Based Post-Breakout Behavior Statistics | Real-Time Pullback & Runup Tracker
A professional-grade Pine Script v6 indicator designed specifically for analyzing the historical and real-time behavior of price after strong All-Ti

See all indicators and strategies
Community trends
QuantumScape (QS): Cup-and-Handle Structure Intact – Handle LowsI wanted to share a technical perspective on QuantumScape (QS), as the Cup-and-Handle formation remains intact on the higher-timeframe chart.
From a pure price-action standpoint, QS has already completed a well-defined cup, marked by a rounded base following the prior drawdown, and is now trading a

$HIMS - RSI+MACD Divergences for Bullish PlaysI think that NYSE:HIMS has an upside potential considering there are clear positive divergences in RSI and MACD. These have also been highlighted at various instances in the past where the price rocketed upwards after giving divergences in RSI and MACD; the price, at that point, either consolidate

FTAI Aviation, ready for take off?Potential FTAI daily and possibly weekly trade setup:
Going a bit early on this one before the new year but assuming the daily spike doesn't immediately get rejected before the weekly close on the 2nd of January this chart is looking decent.
Technical evidence (Both on daily and weekly chart but h

Copper is primed and READYSo this decade precious metals have finally shown volatility. Gold and Silver have been a highlight especially with the past Administration boasting EV, GREEN-NEW DEAL, and now with AI; Precious metals are showing that people as of right now prefer a physical safe haven asset rather than “code” lik

$AVGO I see roughly a 70% probability that Broadcom retraces bacNASDAQ:AVGO , just re-entered this short with a tight stop around $354.
From a longer-term perspective, I see roughly a 70% probability that Broadcom retraces back into the $200s sometime in 2026. The stock has overshot a multi-year trendline, and current bullish momentum appears to be stalling rig

Alphabet - This stock is reversing now!🔪Alphabet ( NASDAQ:GOOG ) is reversing very soon:
🔎Analysis summary:
Alphabet created a textbook all time high break and retest back in mid 2025. The recent rally has therefore been totally expected. But now, Alphabet is totally overextended, retesting a major resistance trendline and about t

12/31/25 - $mstr - 1.05x mnav... kinda obvious12/31/25 :: VROCKSTAR :: NASDAQ:MSTR
1.05x mnav... kinda obvious
- saylor has like 80% of the DAT liquidity which is all that matters in this game, bc it allows you to do all sorts of interesting things e.g. have the suite of products (perpetuals) he's launched
- so this will obviously trade on a

Tesla (TSLA) Shares Fail to Hold at an All-Time HighTesla (TSLA) Shares Fail to Hold at an All-Time High
Yesterday, Tesla (TSLA) shares declined by more than 3%, with the following developments observed:
→ the session opened with a bearish gap;
→ the price fell nearly 8% from the all-time high recorded on 22 December;
→ the psychological $500 level

$SOUNEntry : CMP
TP 1 : $27.61
TP 2 : $41.85
SL : if you wish only
On my stock setups, STOP LOSS are just levels to stop putting money and wait for better opportunity
Financial Disclaimer:
This is not financial advice. This is a technical perspective based on price action and market structure. Always

TSLATesla: A Bet on AI, Not Just Cars
NASDAQ:TSLA is no longer just a car manufacturer — it’s a massive bet on AI and Robotaxis. This vision is precisely what keeps the stock at its current valuation.
Why is the stock so expensive?
The market is pricing in future dominance in two key areas:
Robota

See all stocks ideas
Today
PKEPark Aerospace Corp.
Actual
—
Estimate
—
Today
LFCRLifecore Biomedical, Inc.
Actual
—
Estimate
−0.14
USD
Tomorrow
HURCHurco Companies, Inc.
Actual
—
Estimate
—
Jan 6
ANGOAngioDynamics, Inc.
Actual
—
Estimate
−0.10
USD
Jan 6
PENGPenguin Solutions, Inc.
Actual
—
Estimate
0.44
USD
Jan 6
AIRAAR Corp.
Actual
—
Estimate
1.04
USD
Jan 7
CALMCal-Maine Foods, Inc.
Actual
—
Estimate
1.95
USD
Jan 7
MSMMSC Industrial Direct Company, Inc.
Actual
—
Estimate
0.95
USD
See more events
Community trends
Bitcoin will die! Silver pumped +200% - GOLD (2026 prediction)Bitcoin will die in 2026, and a lot of traders will get liquidated! Silver pumped by 200% this year, gold by 75%, and the US stock index Nasdaq by 61%, while Bitcoin dropped from 126k to 80k in 2025. I will tell you exactly why in this analysis!
First, let's take a look at Bitcoin and the main reas

BTC - Where the 2026 Bottom Might Actually FormLet me be clear from the start.
This is not about calling a bottom today.
It’s about comparing this cycle to the previous ones.
📉 From a structural point of view:
Price is trading below the key moving average, and as long as that MA is not reclaimed to the upside, the trend remains bearish.
At t

2025 Ends With a Breakout?Year Ends With a Breakout, yes!🚀📈
Bitcoin just delivered what the market was waiting for — a clean breakout back into the channel 🎯
This is how we close the year… with intent.
Key Technicals:
• Major support holding at 88,273 – 88,535
• ATA 200 support confirmed
• Price reclaimed the channel
What I Expect from 2026Scenarios • Markets • Levels • Positioning
First of all, I want to thank everyone for the activity under my previous post .
More than 300 likes are not just numbers to me — they show that you read, think, and ask the right questions. These are exactly the people who motivate me to keep sharing my

BTCUSDT Above Support - $88,900 Resistance in PlayHello traders! Here’s my technical outlook on BTCUSDT (1H) based on the current chart structure. BTCUSDT is trading within a broader ascending channel, confirming an overall bullish structure despite recent volatility. After a sharp drop earlier on the chart, price formed a clear base and started to

BTCUSDT: Range Compression Signals Potential Break Above $90,100Hello everyone, here is my breakdown of the current BTCUSDT setup.
Market Analysis
BTCUSDT is trading within a broader consolidation after a strong bearish impulse earlier in the chart. Following the sell-off, price found a key support base around the 87,300 Support Zone, from which buyers steppe

BTCUSDT Long: Buyers Defend Channel Support, Upside in FocusHello traders! Here’s a clear technical breakdown of BTCUSDT (4H) based on the current chart structure. After a prolonged consolidation phase defined by a broad range, BTC established multiple internal breakouts, highlighting volatility but no clear directional dominance. This range acted as an accu

BTC vs Silver: Is This a New Major Bottom?1️⃣ BTC/Silver at Channel Support = Where Big Bottoms Formed Before 📉➡️📈**
- Every time BTC/SILVER touched the bottom of this rising channel, a major bottom followed:
- 🦠 Covid crash → huge recovery after
- 🐻 Bear‑market low of the current cycle → next bull phase started
- 🔁 Today the rat

Bitcoin Today: A Controlled Pullback Within a Healthy UptrendHello, I’m Camila.
By closely observing the Bitcoin chart over recent sessions, I see the market moving in line with a very familiar medium-term bullish scenario. After a clear rebound from the lows, price is now trading within a well-controlled bullish structure, forming higher lows along the way

Happy New Year XRP: These Events Set Up Major Moves for 2026.Hello There,
welcome to my new analysis about XRP. In recent times a very important dynamic with XRP caught my attention. Throughout 2025, major events happened that are setting up an important foundation for XRP and the upcoming year. These events are building major cornerstones that will have an

See all crypto ideas
Lingrid | GOLD Swap Zone Bounce Signals Trend ContinuationOANDA:XAUUSD reacted strongly after pulling back from the 2025 high, finding demand inside the 4,270–4,280 swap zone, where prior structure and the rising trendline converge. The rebound from this area suggests selling pressure may be losing control rather than accelerating into a trend reversal.

XAUUSD Fake Breakout at 4,520 - Price Tests Buyer Zone at 4,260Hello traders! Here’s my technical outlook on XAUUSD (4H) based on the current chart structure. Gold is trading within a broader ascending channel, confirming a dominant bullish structure despite the recent sharp pullback. After a strong impulsive rally, price respected the channel support and conti

Gold Starts 2026 with a Setup — Correction or New Rally Ahead?Wishing you all a Happy New Year 2026 in advance.
First and foremost, I wish you good health — because everything starts from there.
I hope your hearts feel lighter, your minds stay calm, and the new year brings many positive and meaningful moments into your lives.
May most of your trades end in

Gold Price Update – Clean & Clear ExplanationGold was in a strong bullish trend earlier, moving higher inside an ascending channel and making higher highs and higher lows. This shows that buyers were fully in control during that phase.
However, price recently faced strong resistance near the 4,395–4,430 area, from where heavy selling entered

Precious Metals Outlook for 2026Without any doubt, 2025 has largely been the year of precious metals (besides A.I).
Gold, silver, and later platinum dominated market narratives, with December standing out as a particularly explosive month — especially for silver and platinum.
And while making predictions for 2026 is inherently d

XAUUSDHello Traders! 👋
What are your thoughts on Gold?
Gold entered a corrective phase after reaching the upper boundary of the ascending channel. This correction extended toward the lower boundary of the channel and the marked support zone, where price showed a strong bullish reaction. The subsequent r

XAUUSD Short: Trend Line Break Signals Downside ContinuationHello traders! Here’s a clear technical breakdown of XAUUSD (3H) based on the current chart structure. Gold previously traded inside a well-defined range, indicating a phase of accumulation before buyers gained control. From this range, price broke out to the upside and followed a rising trend line,

Gold 30M – Support Hold After Strong Sell-Off Price broke the ascending trendline, showing **short-term bearish pressure** within a larger structure Strong support at 4,365–4,380**; holding this zone can trigger a corrective bounce.
* **Resistance at 4,430–4,445**; breakout above opens move toward 4,480–4,500 while a break below **4,360 inval

Why Did XAUUSD Drop Sharply in the Latest Session?I don’t see this decline as abnormal. It is more the result of several factors aligning at the same time.
First, large-scale profit taking. Since the beginning of 2025, gold has gained more than 70%. As price approached the 4.55x area — a very strong psychological level — institutional money bega
XAUUSD: Bullish Trend Remains Intact in Rising ChannelHello everyone, here is my breakdown of the current XAUUSD (Gold) setup.
Market Analysis
Gold has confirmed a bullish shift after breaking out of a prior triangle structure, where price was previously compressed between descending resistance and ascending support. This breakout marked a clear cha

See all futures ideas
EURUSD: Bullish Structure Holds - Market Eyes 1.1810 ResistanceHello everyone, here is my breakdown of the current EURUSD setup.
Market Analysis
EURUSD is trading within a well-defined bullish structure after breaking out of a descending triangle formation, signaling a clear shift in control from sellers to buyers. The initial breakout was followed by a brie

EURUSD Failed Break Above 1.1800 Opens Path to 1.1740Hello traders! Here’s my technical outlook on EURUSD (4H) based on the current chart structure. EURUSD is trading within a broader bullish structure after breaking above a descending resistance formation earlier on the chart, signaling a clear shift in market control from sellers to buyers. Followin

AUDUSD – Bullish Buy Setup | 4H Timeframe📈 AUDUSD – Bullish Buy Setup | 4H Timeframe
AUDUSD is in a strong bullish trend on the 4H chart, supported by a bullish EMA crossover.
🔁 Technical Confirmation:
• EMA 20 has crossed above EMA 50, signaling bullish momentum
🟢 Buy Entry Zone:
• Buying opportunity around 0.66600, aligning with trend

EURUSD Bearish Continuation After Trend BreakQuick Summary
EURUSD remains bearish after the strong sell-off since the start of the week, the Price is expected to continue lower toward 1.17028 after this level Buy positions will only be considered as a mitigation move if a clear retracement target appears
As long as no corrective objective is

GBP/USD – A Pullback Before the Uptrend ContinuesHello everyone, my name is Camila.
Observing the GBP/USD chart on the H3 timeframe, I assess that the market is moving in line with the characteristics of a healthy uptrend. Price is trading steadily within an ascending channel, with a clear higher high – higher low structure maintained consistent

EURUSD Long: Demand at 1.1720 Sets Up a Push Toward 1.1770Hello traders! Here’s a clear technical breakdown of EURUSD (2H) based on the current chart structure. After forming a solid pivot low, EURUSD transitioned into a bullish trend, supported by a rising trend line that guided price action higher. Following this move, the market entered a consolidation

EURUSD: 1.1800 proved to be a strong resistance zone so farEURUSD: 1.1800 proved to be a strong resistance zone so far
It seems that EURUSD found a very strong resistance zone near 1.1800, as I explained in our previous analysis.
The price was rejected several times over the past two weeks, and near this area the chances of a move down increase.
Perhaps

AUDUSD: Bullish Pullback Within Uptrend!!Hey Traders,
In today’s trading session, we are monitoring AUDUSD for a potential buying opportunity around the 0.66500 zone.
Technically, AUDUSD continues to trade within a well-defined uptrend and is currently in a healthy correction phase. Price is approaching the 0.66500 support zone, which co

USD/JPY | Next targets ahead! (READ THE CAPTION)By analysing the 2H chart of USDJPY, we can see that after reaching the FVG zone at 156.484-156822 twice, and sweeping the BuySide Liquidity above 156.545 level, it has dropped in price all the way to 155.856 and it is currently being traded at 155.930.
For the time being, USDPJY Bullish Targets are

GBPUSD 1H Intraday Outlook: Sweep Into SupportGBPUSD 1H Intraday Outlook: Sweep Into Support, Reclaim Setup Toward 1.3500+
GBPUSD on the 1H chart printed a sharp selloff from the upper range, then dipped into a well-defined demand pocket before bouncing back. This is the classic “liquidity sweep + reclaim attempt” structure: price sold hard, ta

See all forex ideas
| - | - | - | - | - | - | - | ||
| - | - | - | - | - | - | - | ||
| - | - | - | - | - | - | - | ||
| - | - | - | - | - | - | - | ||
| - | - | - | - | - | - | - | ||
| - | - | - | - | - | - | - | ||
| - | - | - | - | - | - | - | ||
| - | - | - | - | - | - | - |
Trade directly on Supercharts through our supported, fully-verified, and user-reviewed brokers.


