Analysis for What’s Coming - AI Bubble Sentiment The US markets have been described as “on a rally” for quite some time. I would not agree if it is meant to describe the overall US market, but would agree if it refers specifically to AI or tech stocks. Why?
Among the four major US indices, the Russell—representing a much broader base of US-listed

Black Friday
The greatest deal of the year is here.Get it before the point of no return.

Nvidia Earnings Finally Ease Market Jitters. Are AI Bulls Back?It’s confirmed. This is Nvidia’s stock market and we all live in it.
Nvidia NASDAQ:NVDA reported yet another record-breaking quarter, instantly soothing market nerves after a week filled with talks of “AI bubble,” “valuation fever,” and “maybe Michael Burry is right again.” It was the cherry of t

META now close to a critical trendlineMETA is approaching a significant technical region.
The trendline currently in focus originated on 31 October 2022, and it has remained relevant over time.
This same trendline was retested twice in April of this year, and price action is once again moving toward it after achieving a new all-time

SOL — Deep Pullback Into Major SupportSOL has been in a steady freefall over the past weeks. On the higher timeframes the key support and resistance zones are very clearly defined. The $250 level acted as a big resistance area, with multiple rejections showing sellers were firmly in control up there.
On the downside, the $125 support z

The Market is at 80°C. What Happens at 100°C?Greetings, everyone.
Today, I don't want to talk about the news. I want to talk about what truly matters: market structure. Many traders are currently looking for a news event to explain the current lull and predict Bitcoin's next move. They are looking in the wrong direction.
Remember this: the n
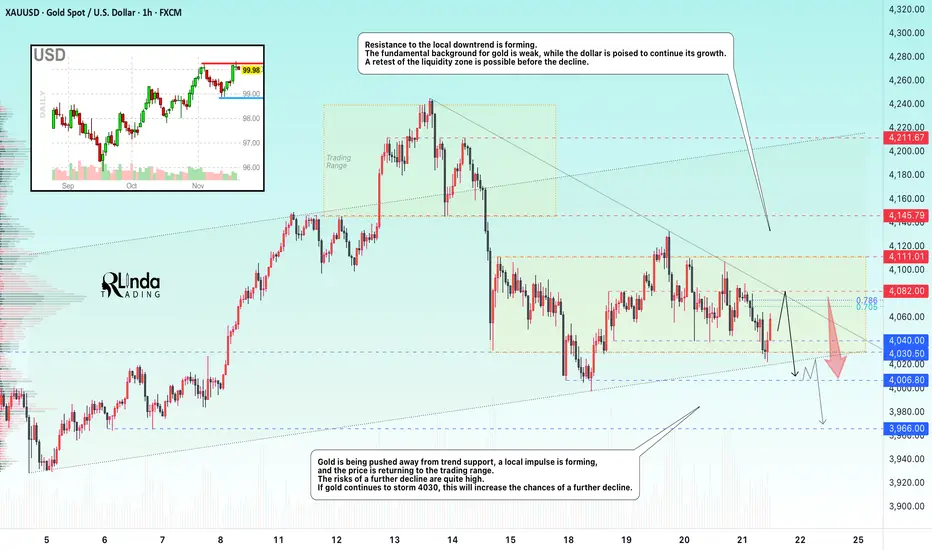
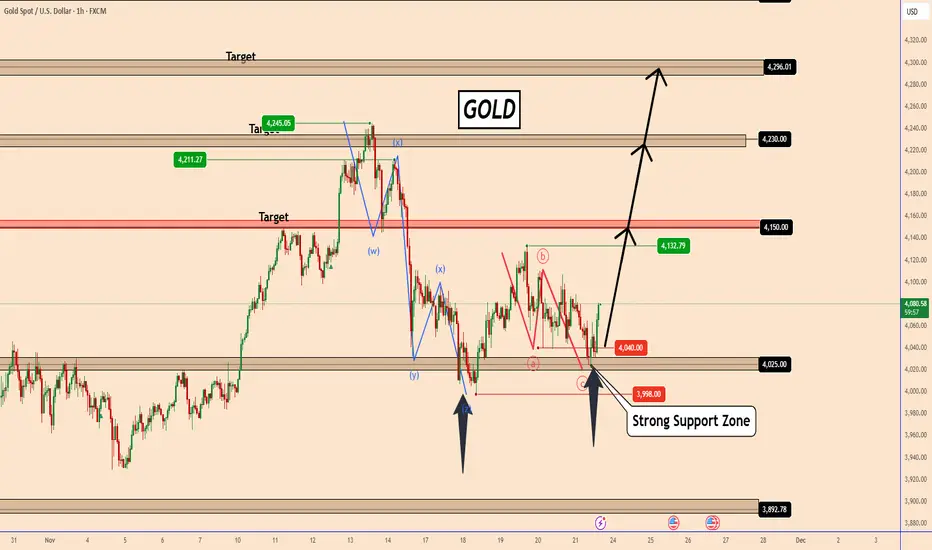
XAUUSD Long: Buyers Eye Push Toward $4,100 ResistanceHello traders! XAUUSD is developing a clear technical structure after reacting multiple times to both the Supply and Demand zones, forming a well-defined pattern of price behavior. Recently, Gold rejected the Supply Line after creating a new Pivot Point near the $4,230 area — the same region where a

From Shutdown Relief to AI Anxiety — Two Narratives Driving ESMarket Theme
The week began on a strong footing, driven by a bullish Sunday reopen in ES after news broke that the 43-day government shutdown was set to end, following the Senate’s late-night support for a potential agreement on November 9th. This relief catalyst created early upside momentum, pus

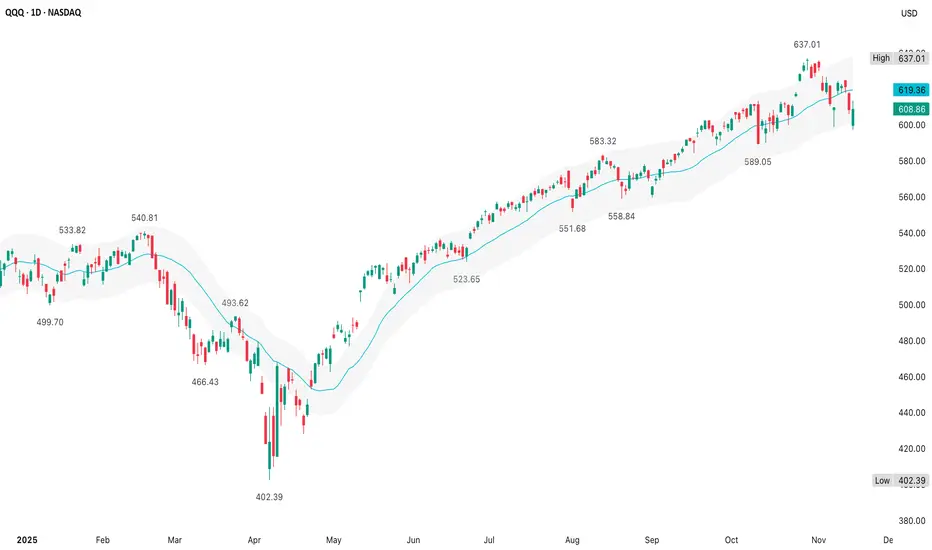
QQQ (14 November)The +/- 3% envelope with the 20d MA works well for mean-reversion strategies since it clearly shows inflection points where price may snap back toward the average
How far is price from its 20d MA & is price near extremes of the 3% bands?
Bollinger Bands adjust dynamically with volatility
Price
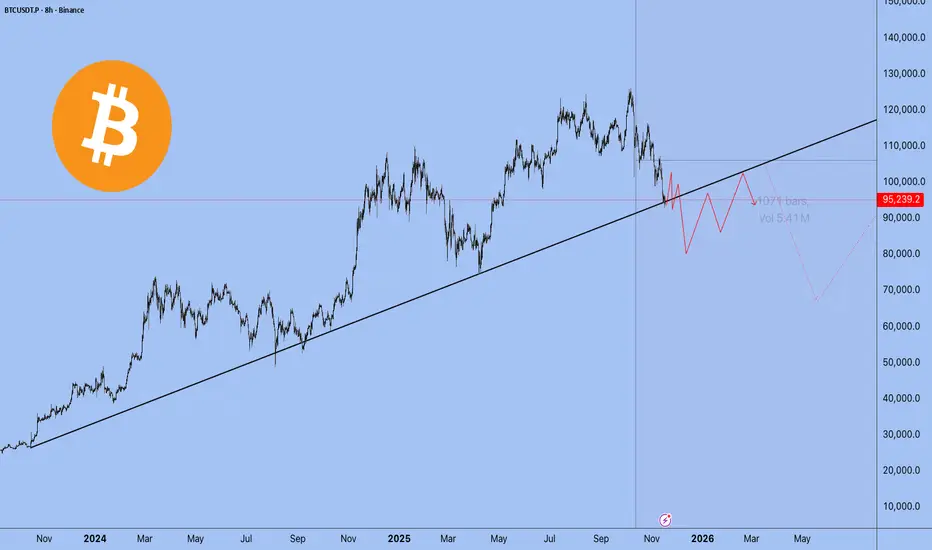
Technical analysis of bitcoin key levels and wedge chart pattern1. Trend Structure
The descending trendline (Resistance line) at the top of the chart remains valid.
The price has repeatedly faced rejection at this level, indicating that the medium-term downtrend is still intact.
2. Key Price Levels and Indicators
50-week EMA
The price has recently

Bitcoin FOMOThe technical levels I am watching in the near term are:
Upside Resistance:
104800
117,500
All Time High
Downside Support
87,700
84,100
Throughout this bull cycle, starting from the low in November 2022, following the January 2023 Ichimoku breakout that truly triggered the bull tre

See all editors' picks ideas
Holographic Market Microstructure | AlphaNattHolographic Market Microstructure | AlphaNatt
A multidimensional, holographically-rendered framework designed to expose the invisible forces shaping every candle — liquidity voids, smart money footprints, order flow imbalances, and structural evolution — in real time.
---
📘 Overview
The Hol

PriceFormatLibrary for automatically converting price values to formatted strings
matching the same format that TradingView uses to display open/high/low/close prices on the chart.
█ OVERVIEW
This library is intended for Pine Coders who are authors of scripts that display numbers onto a user's charts. T

LogNormalLibrary "LogNormal"
A collection of functions used to model skewed distributions as log-normal.
Prices are commonly modeled using log-normal distributions (ie. Black-Scholes) because they exhibit multiplicative changes with long tails; skewed exponential growth and high variance. This approach i

Range Oscillator (Zeiierman)█ Overview
Range Oscillator (Zeiierman) is a dynamic market oscillator designed to visualize how far the price is trading relative to its equilibrium range. Instead of relying on traditional overbought/oversold thresholds, it uses adaptive range detection and heatmap coloring to reveal where pri

Volume Surprise [LuxAlgo]The Volume Surprise tool displays the trading volume alongside the expected volume at that time, allowing users to spot unexpected trading activity on the chart easily.
The tool includes an extrapolation of the estimated volume for future periods, allowing forecasting future trading activity.
🔶 U

Smooth Theil-SenI wanted to build a Theil-Sen estimator that could run on more than one bar and produce smoother output than the standard implementation. Theil-Sen regression is a non-parametric method that calculates the median slope between all pairs of points in your dataset, which makes it extremely robust to o

Fair Value Gaps by DGTFair Value Gaps
A refined, multi-timeframe Fair Value Gap (FVG) detection tool that brings institutional imbalance zones to life directly on your chart.
Designed for precision, it visualizes how price delivers into inefficiencies across chart, higher, and lower (intrabar) timeframes — offering a fl

TASC 2025.11 The Points and Line Chart█ OVERVIEW
This script implements the Points and Line Chart described by Mohamed Ashraf Mahfouz and Mohamed Meregy in the November 2025 edition of the TASC Traders' Tips , "Efficient Display of Irregular Time Series”. This novel chart type interprets regular time series chart data to create an ir

Simplified Percentile ClusteringSimplified Percentile Clustering (SPC) is a clustering system for trend regime analysis.
Instead of relying on heavy iterative algorithms such as k-means, SPC takes a deterministic approach: it uses percentiles and running averages to form cluster centers directly from the data, producing smoo

Adaptive Volume Delta Map---
📊 Adaptive Volume Delta Map (AVDM)
What is Adaptive Volume Delta Map (AVDM)?
The Adaptive Volume Delta Map (AVDM) is a smart, multi-timeframe indicator that visualizes buy and sell volume imbalances directly on the chart.
It adapts automatically to the best available data resolution

See all indicators and strategies
Community trends
Patience pays off? Long METAI've been patient with META. I've been wanting to go long here since earnings, but I also wanted to see if we'd get closer to the lower trendline. Luckily I waited. But I'm at a point I don't want to wait longer to start my position/trade.
The reasons:
1. That lower trendline has held since October

AAPLAAPL has just executed a textbook bullish breakout from a 10-month ascending triangle, decisively clearing multi-year resistance at ~$255–260 on strong volume. The former resistance zone now acts as support, with a measured move targeting $293–$296 and potential for $300+ in an impulsive upward phas

Fundamental Rerating Ahead📌 Regional Health Properties (RHEP) – Technical & Fundamental Analysis
Company Overview
Regional Health Properties, Inc. (RHEP) is a U.S. healthcare real-estate operator focused primarily on skilled nursing and senior care facilities. The company recently completed a transformative integration with

PYPL USPayPal is a rare combination of value and growth.
The company demonstrates strong fundamentals, is strategically focused on the future, and trades at record-low multiples. The combination of financial discipline, capital return, and AI innovation makes it an attractive asset for long-term investor

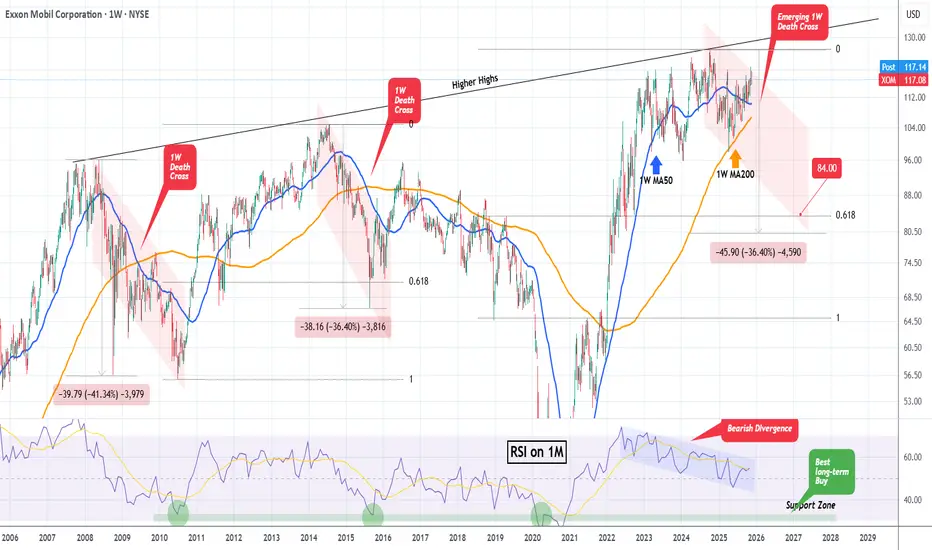
EXXON MOBIL on its 1st 1W Death Cross in 10 years!Exxon Mobil (XOM) is around a month before the formation of a 1W Death Cross for the first time in 10 years (last one in July 2015). This is a major technical development as the last two 1W Death Crosses resulted in massive sell-offs.
As you can see, both were formed long after a market rejection o
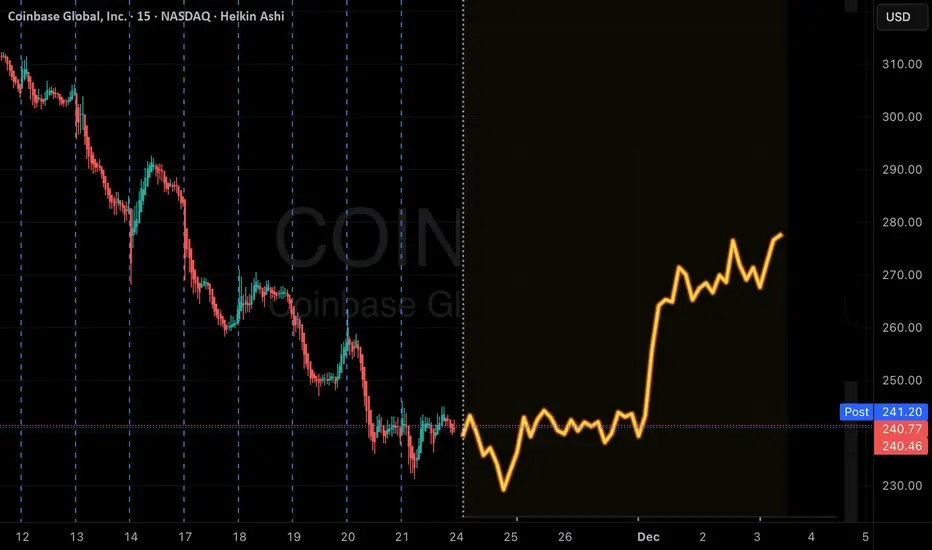
COIN Swing Alert! QuantSignals V3 Predicts Strong Put MoveCOIN | QuantSignals V3 Swing Trade Alert (2025-11-20)
Signal Overview
Direction: BUY PUTS (Short)
Confidence: 72% (Medium Conviction)
Horizon: 15 days → Expiry 2025-12-05
Strike: $240.00
Entry Price: $17.83
Target 1: $25.50 (+43%)
Target 2: $32.00 (+79%)
Stop Loss: $12.50 (-30%)
Position S
IREN 1D - Bullish Continuation PatternSaw a double-top formation on the IREN 1D, zoomed out, saw something similar back in Q2 2024.
Drew a Bar Pattern Continuation for fun to post to twitter about "Chart Squigglers".
Bullish IREN, in all seriousness.

NVDA Head and Shoulders- Dec Rate Cuts has changed setupNvidia’s setup has shifted. With the Fed signaling a likely rate cut on December 10th, the market will start baking that optimism into asset prices ahead of time. When monetary conditions ease, high-valuation tech often gets an extra tailwind, which means the expected head-and-shoulders pattern on N

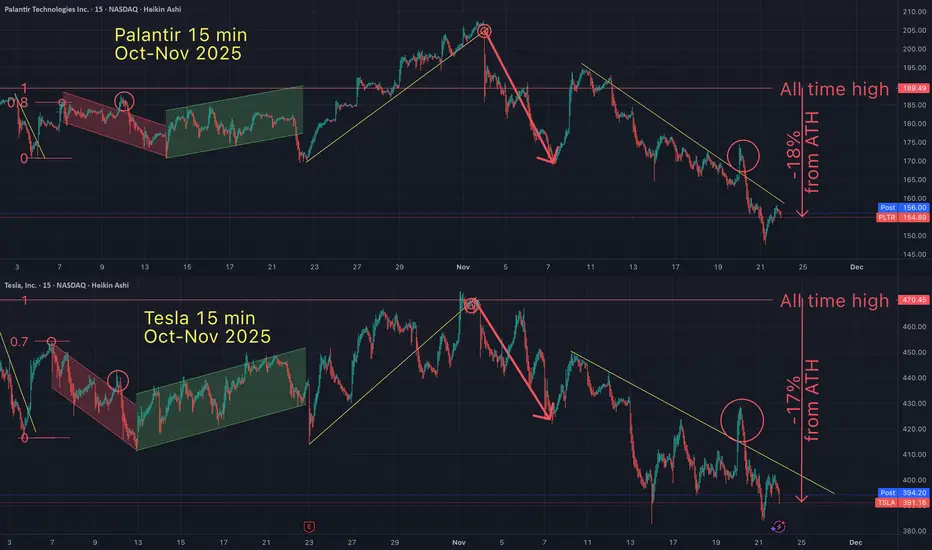
Tesla / Palantir Fractal - 50 Days of identical price action?On oct 7th I suggested that Tesla and Palantir had been in a 'fractal" pattern. Since identifying this pattern, it's been 50 days of identical price action (on the 15 minute timeframe). But this fractal goes back much further in time.
Fractals are a mathmatical anomaly, if you understand linear e
SMCITake a close look at this long-term chart on a logarithmic scale. There are two distinct long-term bullish channels, as demonstrated by the different highlighted points. We are currently resting on the lower part of the steeper channel; we could even test the 27-28 levels, but I believe there will b

See all stocks ideas
Tomorrow
PLCEChildren's Place, Inc. (The)
Actual
—
Estimate
0.70
USD
Tomorrow
RILYB. Riley Financial, Inc.
Actual
—
Estimate
—
Tomorrow
GDEVGDEV Inc.
Actual
—
Estimate
0.42
USD
Tomorrow
IMPPImperial Petroleum Inc.
Actual
—
Estimate
0.10
USD
Tomorrow
GAUZGauzy Ltd.
Actual
—
Estimate
−0.29
USD
Tomorrow
REEREE Automotive Ltd.
Actual
—
Estimate
−0.54
USD
Tomorrow
CMBMCambium Networks Corporation
Actual
—
Estimate
0.06
USD
Tomorrow
MAXNMaxeon Solar Technologies, Ltd.
Actual
—
Estimate
−1.00
USD
See more events
Community trends
Bitcoin - Approaching the Make or Break ZoneBitcoin continues to bleed lower after multiple liquidity sweeps, and the decline is beginning to compress into a more controlled down move. The chart shows a clear shift in sentiment after the all time high sweep, then another daily sweep that helped close both the daily and 4H imbalance. Since los

Saylor’s Master Plan at Risk? MSCI Drops the HammerMSCI May Exclude Crypto-Heavy Companies: What It Means for MicroStrategy and the Market
MSCI recently published a proposal that could dramatically reshape how global indices treat companies with large crypto exposure.
According to the framework, companies holding more than 50% of their market capit

AIA 0.07 i think it will do something SEXYa measured move to reset
yet when it recovers
it shall be so fast that it will leave everyone behind
NFA
just guessing

STRK USDT SHORT SIGNAL---
📢 Official Trade Signal – STRK/USDT
📉 Position Type: SHORT
💰 Entry Price: 0.1766
---
🎯 Take-Profit Targets (Partial Exits)
TP1 = 0.1591
TP2 = 0.1470
TP3 = 0.1363
TP4 = 0.1259
TP5 = 0.1135
TP6 = —
---
🛑 Stop-Loss: 0.1895
📊 Timeframe: —
⚖️ Risk/Reward Ratio: 7.87
💥 Suggested Leverage: 5×

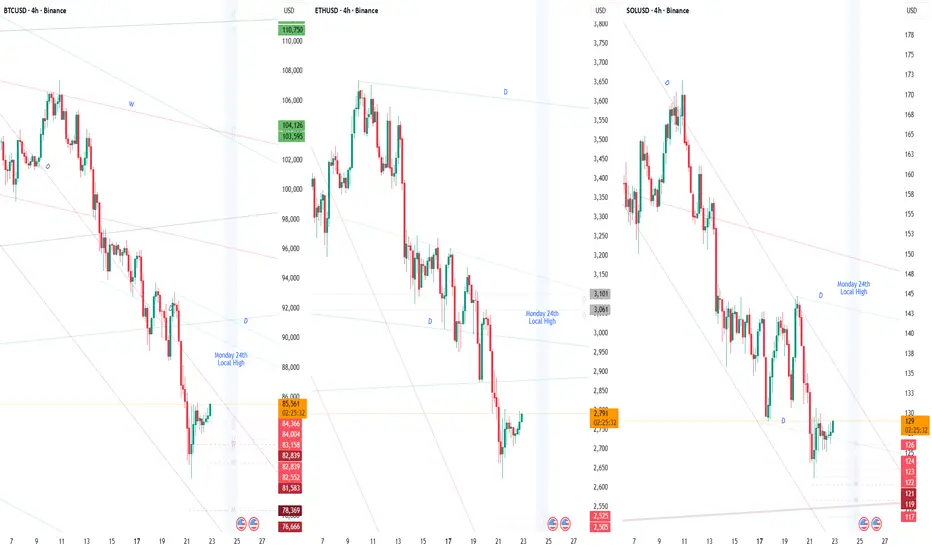
BTC ETH SOL Collapse Is Only Getting StartedI genuinely feel the pain of every crypto long term holder. I've been in crypto since 2014 and already suffered my losses back then. I no longer hold anything long term, when the trend changes, I go SHORT.
This is NOT FINANCIAL advise. You can quickly open an account on any brokerage that offers S
SOLUSDT: Liquidity Tightens – Every Pullback Drops Even Deeper!When talking about Solana right now, the clearest feeling is that the market is losing strength day by day . Recent news shows that SOL has dropped sharply in November, and large capital keeps exiting the market — turning every bounce into an excuse for holders to sell rather than a sign of rever

BTCUSD Next Buying Move AnalysisPrice is sitting inside a strong demand zone.
If BTC breaks below this support, more downside can open.
But if it holds, expect a pullback toward the mid-resistance zone, and only a break above that can target the upper resistance.
Focus Levels
Support: Current lower pink zone
Resistance: Mid-zon

Bearish Case To $375This 4H Chart shows a potential downward move to $375. Price has just broken the neckline of the second consecutive M pattern (Mtop), thus making this next downward move more extreme than the first. Please see the first M pattern in orange with a clear white neckline that was broken with a measured

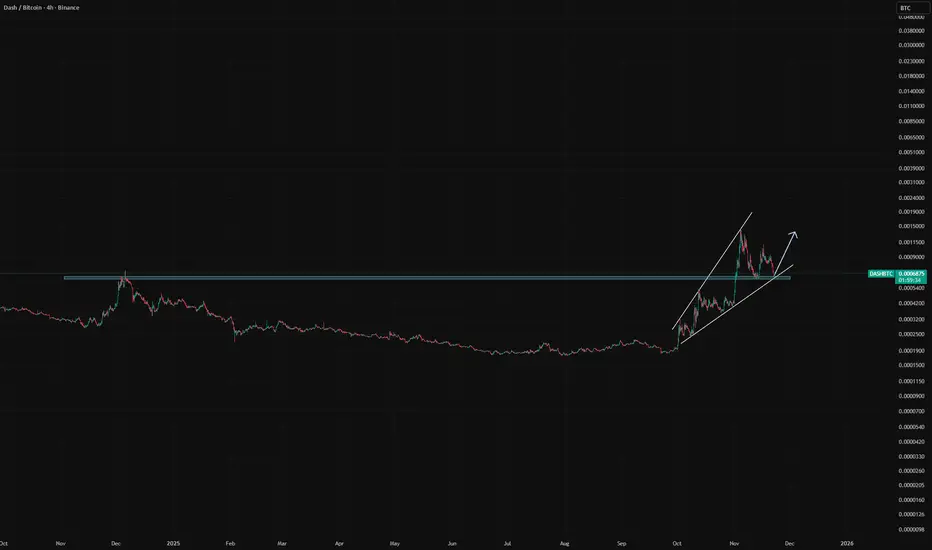
$DASHBTC and $DASHUSD to move higherWhile dash's price has moved swiftly down its btc pair found a bounce off the trendline and its turning 0.0006400 level as support if we hold here a stronger bounce for dashusd is likely to be seen in the coming days, overall crypto fear and greed index is at a 10 insanely low levels I believe this
Support and Resistance breakdownsThis is just a simple breakdown of my guess of resistance on the way up and support on the way down for profit taking or buying opportunities respectively.
This is not financial advice, just a guess based on candle wicks and a way for me to keep track of my thoughts on the market trends at various

See all crypto ideas
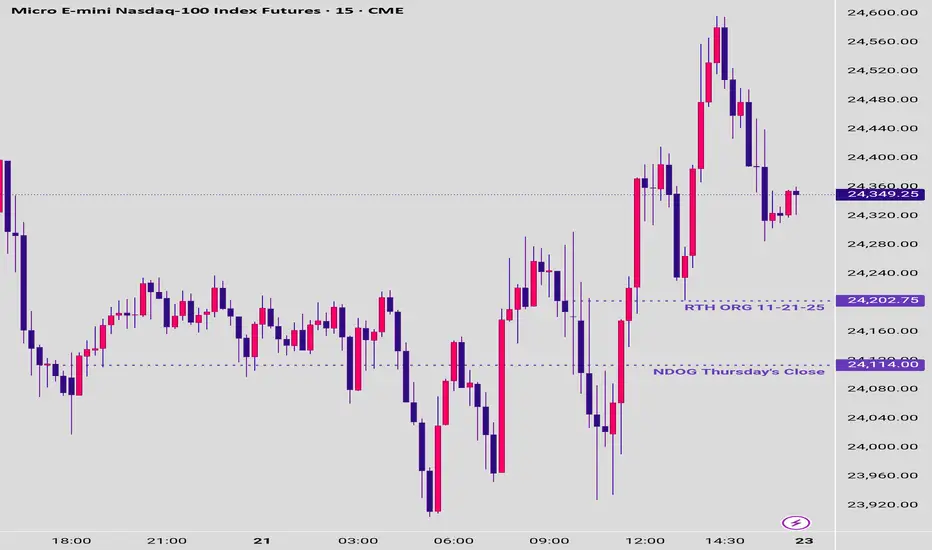
NQ Targets (11-24-25)The downtrend is on and will play inside the Diablo's (red diagonal lines) until breakout. 24,600 to 24,056 is Churn Zone and 24,708 and 24,226 are KL's to watch for opposite direction trades 1st and follow through 2nd. NAZ did come close to -10% level in the overnight, popped back up on a Friday (t

Gold possible move Gold is currently bouncing from a rising trendline support around 4022–4040, indicating buyers are still active in this zone. If price holds above this support, we may see a bullish move toward the first resistance at 4089, followed by 4133. A breakout above these levels can push price toward the up

Gold Weakens as Sellers Regain ControlHello everyone, gold is starting to lose its upward momentum when looking at the 4H chart: the price is hovering around 4,065 USD, right after a firm rejection from the 4,090–4,100 USD region. A series of small-bodied candles with long upper wicks suggests that buyers are slowing down, while seller

GOLD → Mixed data forms a symmetrical triangle FX:XAUUSD is bouncing off support at 4030, with bulls trying to maintain the current trend. The fundamental backdrop is currently weak for gold, which is why there are bears in the market. The PMI report is coming up...
Mixed US employment data (NFP growth to 119K, but unemployment rose to 4.4
Gold is consoladating in narrow zoneGold is consoladating in narrow zone. US dollar after NFP data appears strong, so sooner or later XAUUSD will breakdown this triangle range.

GOLD: Improved Volume Signals Potential Upside for GoldGOLD: Improved Volume Signals Potential Upside for Gold
Yesterday the volume was very low and failed to start the uptrend. Perhaps it was also in this situation because of the NFP data that came out better than expected and the US dollar showed strength again.
Gold found strong support in our ol
XAGUSD : Harmonic structureIn terms of harmonic structure, I can see that XAG shares EXACTLY the same structure as XAU. Yes, exactly the same when the price goes up to the ATH.
In the coming days or weeks, the price will come crashing down, as it has on previous occasions, just that XAG will go down more compared to XAU.
I

S&P 500 E-mini Futures: Short Target Achieved, Long Setup 21.Nov
S&P 500 E-mini Futures: Short Target Achieved, Long Setup in Play
Today’s session on the S&P 500 E-mini Futures (ES) presented a textbook example of how patience and planning pay off in intraday trading. Let’s break down the trade idea, execution, and the next steps.
Market Context
Instrument: S&P

Emini Nasdaq 100. Important Areas to look for and Weekly outlookCME_MINI:NQ1!
Highlighted the important levels. what to look for how we can approach the next week in terms of higher timeframe reference points

See all futures ideas
CAD/JPY – Wedge Breakout Pattern (21.11.2025)📝 Setup Overview OANDA:CADJPY
CAD/JPY has broken below a rising wedge structure, signaling weakening bullish momentum. After multiple rejections at the resistance zone, price is now losing steam below the Ichimoku cloud, showing early bearish pressure.A clean breakout + retest scenario opens the

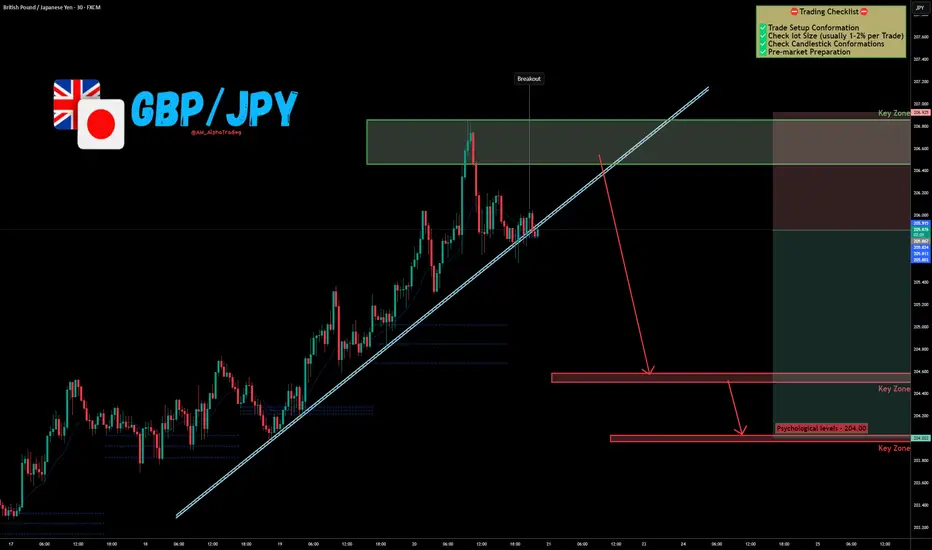
GBP/JPY Rejection at Supply → Next Stop: 204.00 !The GBP/JPY Pair, Price has been trading within a Trendline Breakout on the M30 chart, forming consistent lower highs and lower lows. Price action is now testing the lower boundary of the pattern, signalling a possible breakdown.
✅Market Context:
1️⃣Downward structure building inside the pattern
GBPJPY: Bearish Drop to 202?As the previous analysis worked exactly as predicted, FX:GBPJPY is eyeing a bearish reversal on the 4-hour chart , with price approaching a key resistance zone near recent highs, converging with cumulative buy liquidation and a potential entry area that could trigger downside momentum if sell

GBPUSD: Double Top Breakdown Setting UpHi!
Pattern Structure
A clear Double Top formed between June–Oct 2025 around 1.3750–1.3850, showing strong rejection.
The neckline at 1.3050–1.3070 has been tested several times, confirming it as a key support. 🔎
Trend & Momentum
Price is sliding inside a descending channel since October ➡️ lo

EURUSD: Targets focus on declines to 1.1480 support levelHello everyone, here is my breakdown of the current Euro setup.
Market Analysis
EURUSD continues to trade within a clear Downward Channel, maintaining a strong bearish structure characterized by consistent lower highs and lower lows. Early in the chart, the pair formed a prolonged Range Phase, si

GBPAUD FREE SIGNAL|SHORT|
✅GBPAUD ran buy-side into 4H supply and delivered a sharp rejection, confirming bearish displacement. With order flow shifting lower, price is expected to seek sell-side liquidity at the marked target.
—————————
Entry: 2.0307
Stop Loss: 2.0351
Take Profit: 2.0240
Time Frame: 4H
—————————
SHORT🔥


EURUSD Poised for Further Downside as Bearish Structure HoldsEURUSD Poised for Further Downside as Bearish Structure Holds
From our previous analysis, EURUSD reached our first target and found a strong support near 1.5300
EUR/USD continues to trade within a clear bearish structure after breaking down from the large symmetrical triangle formation earlier th

USDJPY 30-Min — Volume Buy Reversal Triggered⚡Base : Hanzo Trading Alpha Algorithm
The algorithm calculates volatility displacement vs liquidity recovery, identifying where probability meets imbalance.
It trades only where precision, volume, and manipulation intersect —only logic.
✈️ Technical Reasons
/ Direction — LONG / Reversal 156.800 : 1

GBPUSD Bearish Outlook Analysis GBPUSD Bearish Outlook
Price is respecting the descending channel, reacting from the FVG and Order Block zone. A corrective pullback is expected before continuation down toward the target level below. Momentum still favors sellers

See all forex ideas
| - | - | - | - | - | - | - | ||
| - | - | - | - | - | - | - | ||
| - | - | - | - | - | - | - | ||
| - | - | - | - | - | - | - | ||
| - | - | - | - | - | - | - | ||
| - | - | - | - | - | - | - | ||
| - | - | - | - | - | - | - | ||
| - | - | - | - | - | - | - |
Trade directly on the supercharts through our supported, fully-verified and user-reviewed brokers.


