EURUSD Buyers in Control After Corrective Move, Eyes on 1.1930Hello traders! Here’s my technical outlook on EURUSD (1H) based on the current chart structure. EURUSD previously traded within a strong bullish environment, supported by a well-defined rising trend line. During this phase, price consistently formed higher highs and higher lows, confirming sustained

The best trades require research, then commitment.
Get started for free$0 forever, no credit card needed

Scott "Kidd" PoteetPolaris Dawn astronaut

Where the world does markets
Join 100 million traders and investors taking the future into their own hands.

Paypal Bottom is in ?! Long from herePayPal Holdings (PYPL) is currently trading at approximately $40.42 (as of the latest close, +1.30% on the session), marking a continuation of the multi-year downtrend from its 2021 peak of ~$310–$340.
The chart applies a Fibonacci retracement drawn from the 2021 high (~$310.16) to the post-peak lo

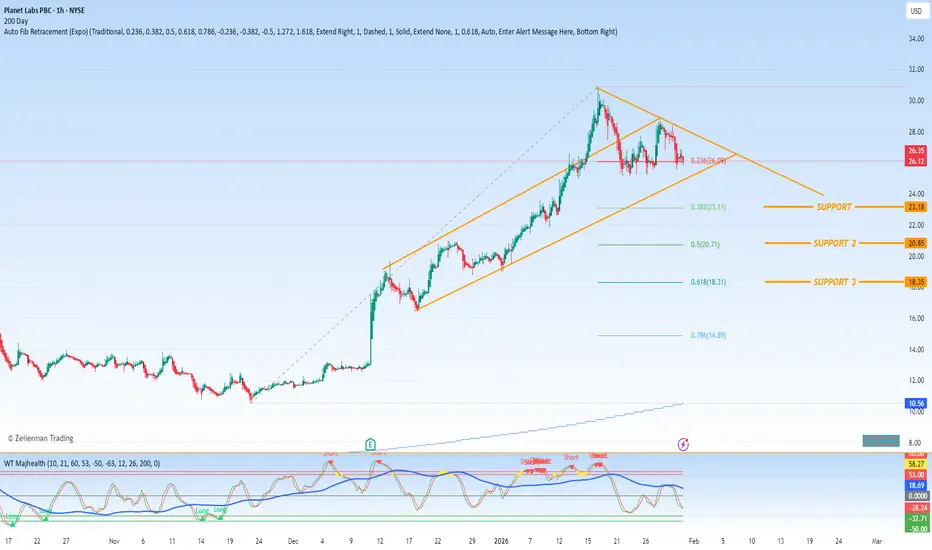
$PL - RACE TO SPACE!This reported merger proposal between SpaceX and xAI, along with the broader industry moves toward orbital AI data centers, represents a bold and high-stakes strategic gambit in the escalating global AI infrastructure race. Here’s a structured analysis of the implications, motivations, and challenge
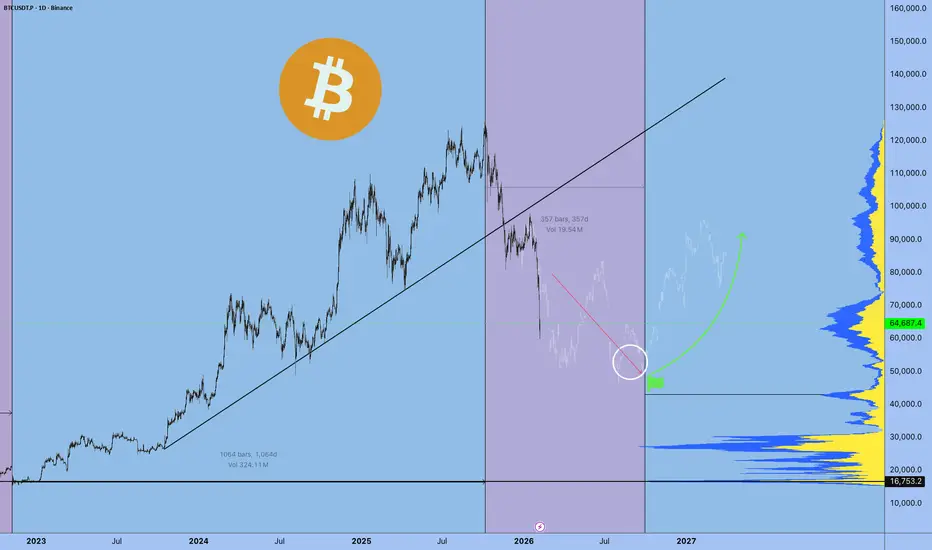
Bitcoin Back Above $70,000. Here Are Key Levels to Watch NowA trip to $60,000 and back before coffee.
Bitcoin BITSTAMP:BTCUSD spent the end of last week doing what it does best: reminding traders that fire-breathing dragons aren’t in fairytales only.
After a sharp drop to $60,033 on Thursday torched thousands of long positions, the world’s largest crypt

An At Market & Future Trading Opportunity on GOLDWhat’s Really Going On With Gold?
Gold took a sharp hit to close out last week—but let’s keep things in perspective. This market has been on a massive bullish run, and after a move like that, consolidation isn’t a surprise… it’s normal.
Barring any unexpected geopolitical headlines, the most logic

RIOT: Looking for bottoming formationThe overall equity and crypto market crash didn't do any favor to RIOT stock. Despite a lot of good things happening for the company, the short-term headwinds are propelling much of the selling. The rapid selling across the markets has a strong signature of capitulation. Which means, I am now lookin

This Isn’t a Reversal — It’s Only Phase Two. $BTC>65k Thank you for your attention! This is exactly what you've been hearing since September 2025. Next, we'll form the bottom, and reaccumulate until October.
A smart person told me to stop posting publicly. Make everything private, but I continue to publish my thoughts for you.
There are no entry point
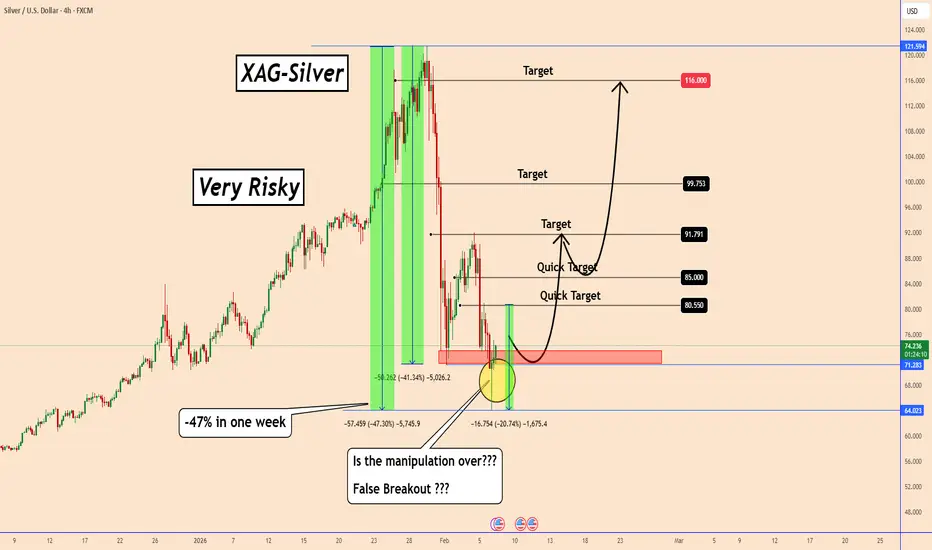
Silver: From -47% to Bullish Momentum: Silver’s Chaotic WeekSilver: From -47% to Bullish Momentum: Silver’s Chaotic Week
In the first sell-off that silver experienced, the price fell by almost -40%.
After a correction these days, we saw silver move lower overnight creating another structural low.
Just yesterday, silver fell by almost -21%, adding to the
Oracle - The worst drawdown ever!💣Oracle ( NYSE:ORCL ) will ends its bearmarket soon:
🔎Analysis summary:
Over the past five months, Oracle has been correcting more than -60%. And while we can clearly witness a major selloff, Oracle is also approaching a major support area. And if we see bullish confirmation in the near futur

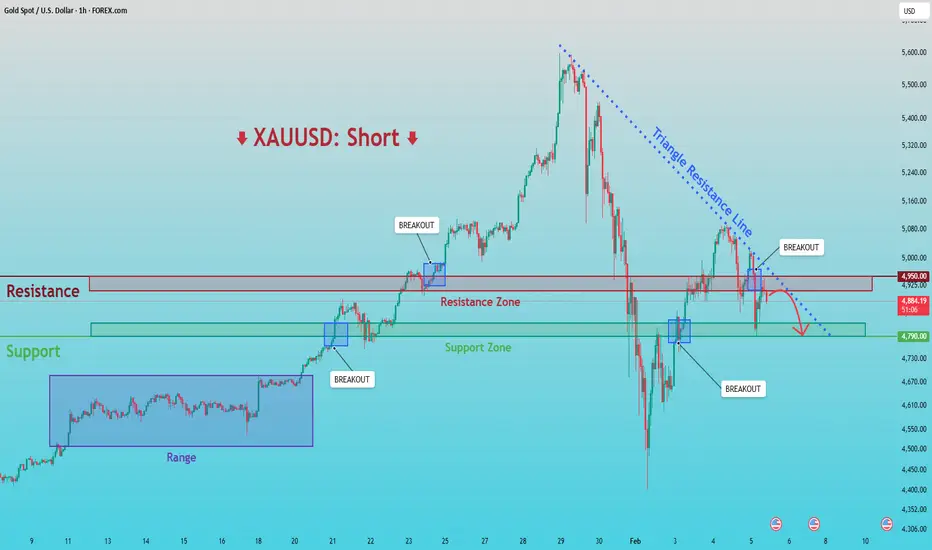
XAUUSD: Breakdown & Retest Signals Bearish ContinuationHello everyone, here is my breakdown of the current XAUUSD setup.
Market Analysis
XAUUSD previously traded within a well-defined consolidation range, where price moved sideways for an extended period, indicating balance between buyers and sellers and gradual liquidity accumulation. This range eve
See all editors' picks ideas
Peak Trading Activity Graphs [LuxAlgo]The Peak Trading Activity Graphs displays four graphs that allow traders to see at a glance the times of the highest and lowest volume and volatility for any month, day of the month, day of the week, or hour of the day. By default, it plots the median values of the selected data for each period. T
Pine Script® indicator

Smart Trader, Episode 03, by Ata Sabanci, Candles and TradelinesA volume-based multi-block analysis system designed for educational purposes. This indicator helps traders understand their current market situation through aggregated block analysis, volumetric calculations, trend detection, and an AI-style narrative engine.
━━━━━━━━━━━━━━━━━━━━━━━━━━━━━━━━━━━━━━━
Pine Script® indicator

Asset Drift ModelThis Asset Drift Model is a statistical tool designed to detect whether an asset exhibits a systematic directional tendency in its historical returns. Unlike traditional momentum indicators that react to price movements, this indicator performs a formal hypothesis test to determine if the observed d
Pine Script® indicator

Hyperfork Matrix🔱 Hyperfork Matrix 🔱 A manual Andrews Pitchfork tool with action/reaction propagation lines and lattice matrix functionality. This indicator extends Dr. Alan Andrews' and Patrick Mikula's median line methodology by automating the projection of reaction and action lines at equidistant intervals, cr
Pine Script® indicator

Arbitrage Matrix [LuxAlgo]The Arbitrage Matrix is a follow-up to our Arbitrage Detector that compares the spreads in price and volume between all the major crypto exchanges and forex brokers for any given asset.
It provides traders with a comprehensive view of the entire marketplace, revealing hidden relationships among d
Pine Script® indicator

Wyckoff Schematic by Kingshuk GhoshThe "Wyckoff Schematic" is a Pine Script indicator that automatically detects and visualizes Wyckoff Method accumulation and distribution patterns in real-time. This professional tool helps traders identify smart money movements, phase transitions, and critical market structure points.
Key Features
Pine Script® indicator

Volume Cluster Profile [VCP] (Zeiierman)█ Overview
Volume Cluster Profile (Zeiierman) is a volume profile tool that builds cluster-enhanced volume-by-price maps for both the current market window and prior swing segments.
Instead of treating the profile as a raw histogram only, VCP detects the dominant volume peaks (clusters) insid
Pine Script® indicator

DeeptestDeeptest: Quantitative Backtesting Library for Pine Script
━━━━━━━━━━━━━━━━━━━━━━━━━━━━━━━━━━
█ OVERVIEW
Deeptest is a Pine Script library that provides quantitative analysis tools for strategy backtesting. It calculates over 100 statistical metrics including risk-adjusted return ratios (Sharpe
Pine Script® library

Arbitrage Detector [LuxAlgo]The Arbitrage Detector unveils hidden spreads in the crypto and forex markets. It compares the same asset on the main crypto exchanges and forex brokers and displays both prices and volumes on a dashboard, as well as the maximum spread detected on a histogram divided by four user-selected percenti
Pine Script® indicator

Multi-Distribution Volume Profile (Zeiierman)█ Overview
Multi-Distribution Volume Profile (Zeiierman) is a flexible, structure-first volume profile tool that lets you reshape how volume is distributed across price, from classic uniform profiles to advanced statistical curves like Gaussian, Lognormal, Student-t, and more.
Instead of forcin
Pine Script® indicator

See all indicators and strategies
Community trends
Micron Technology - This was the last all time high!🍾Micron Technology ( NASDAQ:MU ) creates a textbook reversal:
🔎Analysis summary:
Micron Technology rallied an expected +500% over the past couple of months. But now, Micron Technology is totally overextended and ready for a correction. And with the current retest of the final resistance trend

Quick $TSLA Short Idea Day TradeQuick Trade Idea -
Short Entry - 435.50
Target - 432.00
Stop Loss - 436.50

It's a time for MSFT - 15 % potential profit - 480 USDMicrosoft shares are currently in a clear phase of strong sell-off following the peak in October/November 2025 (~$540–550+), where a classic breakout occurred followed by a breakdown of the uptrend. The decline from the high has already reached ~24–25%, and in 2026 alone the stock has lost more than

HOOD. Set For Another Bounce?Eyes on HOOD ladies and gentlemen, is setting up to continue its journey to
the $90 area after this premarket drop. Nothing has changed on chart just TIME.
Play it right......Play it safe.....Play it The NumberFive Way and Know the riles of the game.

Tesla to potentially retest $500, needs Nasdaq strengthDaily chart showing NASDAQ:TSLA sitting at support inside a downtrend channel, sort of resembling a flag pattern. There is potential that Tesla may bounce off the support, and find its way to breakout of the downtrend channel in a bullish move towards $500.
This is of course is completely depende

Netflix - preparing for successful ATH Revenue projection & Subscribers continue to grow
Netflix continues to demonstrate robust revenue growth:
Q4 2025 revenue of ~$12.05 B, up roughly 17–18% YoY, beating expectations slightly. Global paid subscribers topped ~325 M, a record.
Advertising revenue is gaining traction, growing more tha

Netflix ($NFLX) — odds are becoming favorable for a reversal.Netflix ( NASDAQ:NFLX ) — odds are becoming favorable for a reversal.
Why:👇
A small base is forming near the 2025 lows.
The extended downtrend is becoming increasingly unsustainable.
The $100 big round number often acts as a long-term magnet.
The entry was shared earlier today with members. I’l

MSFT 424 Is the Real Test for BuyersJust like I mentioned earlier, 424 is the real test for buyers, and today’s action confirms it. Buyers were much more aggressive yesterday, but once sellers showed up again at 424, the bid clearly softened. That tells me this level is being actively defended and remains the most important area for s

DHI: From Bearish to BullishMA providing a strong floor.
1. Clean breakout of the descending trendline.
2. Shift in momentum is clear.
Risk Management: 🚩 Stop: Just below 150-MA ($155). 🎯 Targets: $170 | $184.
High RR setup. NYSE:DHI #FinTwit

2.10.2026 ToastDid I follow the rules/ plan
Entry
Exit
What mistakes did I make?
What rules will help me not make those mistakes?
What could I have done better?

See all stocks ideas
Feb 11
FLNGFLEX LNG Ltd.
Actual
0.43
USD
Estimate
0.43
USD
Feb 11
LADLithia Motors, Inc.
Actual
6.74
USD
Estimate
8.11
USD
Feb 11
VRTVertiv Holdings, LLC
Actual
1.36
USD
Estimate
1.29
USD
Feb 11
HUMHumana Inc.
Actual
−3.96
USD
Estimate
−4.00
USD
Feb 11
SITESiteOne Landscape Supply, Inc.
Actual
−0.02
USD
Estimate
−0.21
USD
Feb 11
RDWRRadware Ltd.
Actual
0.32
USD
Estimate
0.30
USD
Feb 11
GNRCGenerac Holdings Inc.
Actual
1.61
USD
Estimate
1.77
USD
Feb 11
HLTHilton Worldwide Holdings Inc.
Actual
2.08
USD
Estimate
2.02
USD
See more events
Community trends
Bitcoin - More blood coming! Buy 57k (extremely strong support)Bitcoin is currently in a very sharp decline, because the price dropped in the past 4 months by 53%. A lot of people didn't expect such high volatility because they are even new to the market, or they thought that ETF would reduce the overall volatility of this market. The truth is that the market i

BTCUSDT Compression Below Resistance Signals Expansion To 71,800Hello traders! Here’s my technical outlook on BTCUSDT (4H) based on the current chart structure. Bitcoin previously traded within a well-defined range, where price respected both the upper and lower boundaries for an extended period. This consolidation phase reflected balance between buyers and sell

BITCOIN POSSIBLE MOVEMENT ( MUST READ IT )Hello Traders hope everyone is good 👍🏻
Here's my first idea on BITCOIN and what do you think about my BTC analysis? Please share in comment section and follow me for more updates on BITCOIN
Price is moving with clear market structure, confirming a valid BOS (Break of Structure) and strong instit

Bitcoin Bored Range… Big Bounce Loading? (66K Zone)Over the past four or five days, Bitcoin ( BINANCE:BTCUSDT ) has been moving within a range, which might have made some traders a bit bored.
Right now, BTC is moving inside a heavy support zone($78,260-$64,850) and, in the past couple of days, seems to be inside a small descending channel.
From

Bitcoin Price Update – Clean & Clear ExplanationBitcoin remains under strong bearish pressure on the 2-hour timeframe. After forming a lower high near the 72,000 / 73,000 supply zone, price failed to sustain upside momentum and continues to trade below the key resistance structure.
The market is currently moving inside a rising corrective channe

2500% possible with BERA token? - February 2026As market participants continue to capitulate hand over fist without understanding why a return to the 9 to 5 is inevitable (Read 7am to 10pm if you’re in Mur’ca), they’re unwittingly showering smart traders with opportunity.
On the above er 3 day chart price action has corrected 95% in the last 12

BITCOIN Is $50000 inevitable??Bitcoin (BTCUSD) is again on the downturn after almost reaching its 1W MA200 (orange trend-line) just last week. One would thought that long-term buyers would make their presence clear on this historically supportive level but so far their absence is more than emphatic. If this continues, the market

BTCUSDT: Bullish Scenario While Above 66.3K SupportHello everyone, here is my breakdown of the current BTCUSDT setup.
Market Analysis
BTCUSDT was previously trading inside a well-defined descending channel, where price consistently respected the falling resistance and support boundaries. This structure was characterized by a sequence of lower hig

Selena | BTCUSD · 30M – Ascending Channel | Range Expansion BITSTAMP:BTCUSD BINANCE:BTCUSD
After a strong impulsive move from the sell-side liquidity sweep near the lows, BTC formed a controlled range between demand and supply. Current price action shows compression inside the range, suggesting an upcoming expansion either through a bullish continuation

BTC: The "Invisible Wall" at $70k (Why We Flush to $59.8k)The retail narrative is that Bitcoin is "consolidating" at $70k. The On-Chain data says Bitcoin is DISTRIBUTING . We just hit an "Invisible Sell Wall" driven by three massive structural failures. This is not a dip to buy; it is a Rational Deleveraging triggered by a $6.3B supply shock that the ma

See all crypto ideas
Elise | XAUUSD · 30M – Demand Hold → Bullish ContinuationOANDA:XAUUSD
Gold swept sell-side liquidity earlier, reacted strongly from the lower demand zone, and transitioned into a controlled bullish structure. Price is now consolidating above a well-defined support base, suggesting absorption rather than distribution. As long as price holds above the dem

XAUUSDHello Traders! 👋
What are your thoughts on GOLD?
After a strong bearish rejection from the previous high, Gold entered a deep corrective phase and declined into the highlighted demand zone, where strong bullish reaction and buyer participation were observed.
Subsequently, price formed a higher low,

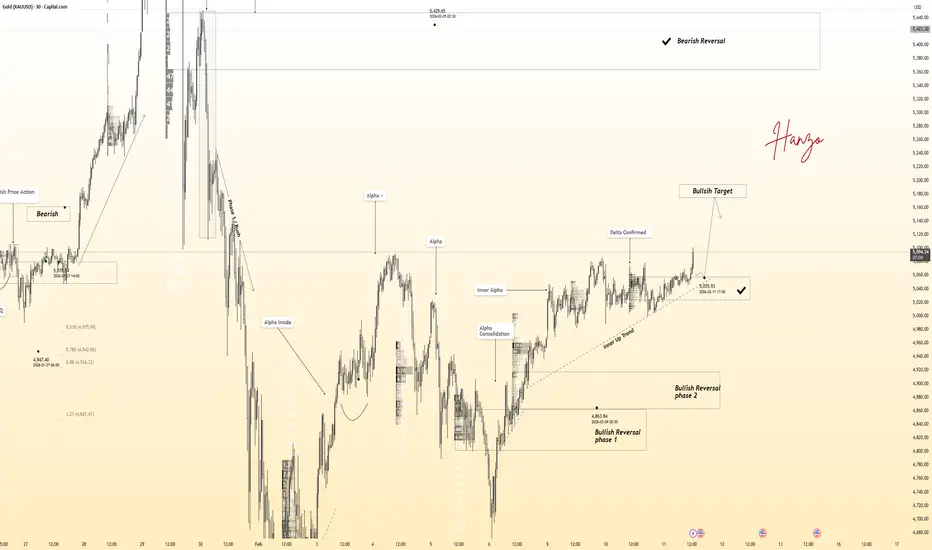
Gold 30-Min Engaged ( Bullish Reversal Entry Detected )⚡Base : Hanzo Trading Alpha Algorithm
The algorithm calculates volatility displacement vs liquidity recovery, identifying where probability meets imbalance.
It trades only where precision, volume, and manipulation intersect —only logic.
Technical Reasons
/ Direction — LONG / Reversal 5057 Area
☄️B
GOLD - Consolidation before the rally. Focus on 5090FX:XAUUSD is storming 5089 as part of a bullish trend. There is a high probability of a breakthrough, but before that, the market may form a correction. Tomorrow is NFP...
The dollar is falling, and against this backdrop, gold looks like a strong asset in terms of buyer interest.
The projecte

SILVER XAGUSD ANALYSIS ( MUST READ IT )Hello traders
Here's my first idea about SILVER XAGUSD and what do think about it ? Kindly share your idea about SILVER XAGUSD with me in comment section
Key Points 😊
Support zone : 66.700 / 64.500
First Target 92.000
Second Target 106.000
Don't forget to share this with your friends and famil

XAUUSD Long: Holds Demand - Upside Toward $5,180 in PlayHello traders! Here’s a clear technical breakdown of XAUUSD (1H) based on the current market structure shown on the chart. Gold previously experienced a strong impulsive bullish move, which ultimately topped at a clear pivot high, where buying pressure began to fade and sellers stepped in aggressive

XAUUSD Builds Strength Above Demand - Next Target $5,190Hello traders! Here’s my technical outlook on XAUUSD (3H) based on the current chart structure. Gold is trading within a broader bullish market structure, supported by a well-defined rising trend line that has guided price higher over time. Earlier in the move, price entered a consolidation phase, f

XAUUSD 1H – Symmetrical Triangle BreakoutContext
Price is compressing inside a symmetrical triangle near the apex. A decisive breakout is expected; execution is confirmation-based.
1) Bullish scenario – Breakout to the upside
Trigger: 1H close above the upper triangle trendline, ideally with a strong impulse candle (displacement).

XAU/USD | Gold Breaks $5086, Now Testing Key Zones Again!By analyzing the #Gold chart on the 1-hour timeframe, we can see that after a small pullback yesterday, price made a strong move toward the $5086 resistance. Gold successfully broke this level and rallied up to $5121.
After reaching this important zone, price faced selling pressure and is now tradi
Silver Holding Demand — Reversal or Trap?📝 Description🔍 Setup OANDA:XAGUSD
Silver has been in a clear downtrend, respecting a descending trendline with multiple rejections. Recently, price showed a breakout attempt and is now consolidating above a key demand zone.
We also see:
Fibonacci retracement reaction from deep levels
Pric

See all futures ideas
USDCHF - Daily CLS - Model 1 - KL - OBHi friends, new range created. As always we are looking for the manipulation in to the key level around the range. Don't forget confirmation switch from manipulation phase to the distribution phase to make the setup valid. Stay patient and enter only after change in order flow. If price reaches 50%

EURUSD: Market Structure Flip Signals Upside Potential To 1.1970Hello everyone, here is my breakdown of the current EURUSD setup.
Market Analysis
EURUSD was previously trading within a clearly defined downward channel, marked by consistent lower highs and lower lows. This structure reflected controlled bearish pressure, where sellers maintained dominance but

USDJPY Under Pressure as BOJ Resumes Forex InterventionUSDJPY Under Pressure as BOJ Resumes Forex Intervention
In our previous analysis posted on January 16th, USDJPY fell rapidly by almost -700 pips in just 3 days. This move was only related to the aggressive Forex intervention that the BOJ made in the market, as USDJPY depreciated a lot.
This week,

GBP/USD - Rising Channel Pattern (11.02.2026)📝 Description 🔍 Setup OANDA:GBPUSD
GBP/USD is respecting a rising channel structure, with price recently bouncing from the cloud support + channel base confluence (Point D).
Key observations:
✅Clean reaction from Fibonacci zone
✅Higher low formation inside the channel
✅Price reclaiming short-

USDJPY 30Min Engaged ( Bearish & Bullish Entry Detected )⚡Base : Hanzo Trading Alpha Algorithm
The algorithm calculates volatility displacement vs liquidity recovery, identifying where probability meets imbalance.
It trades only where precision, volume, and manipulation intersect —only logic.
✈️ Technical Reasons
/ Direction — LONG / Reversal 153.110 Ar

EURUSD Price Update – Clean & Clear ExplanationEUR/USD is trading within a short-term bullish structure on the 30-minute timeframe, supported by a well-respected ascending trendline that has guided price higher over the past sessions. After a strong impulsive rally, the pair entered a consolidation phase, forming higher lows while gradually push

EUR/AUD: Bearish Trend ContinuesThe 📉EURAUD pair is currently experiencing a prolonged bearish trend.
A significant daily support cluster was violated yesterday, and the formation of a new lower low and lower close indicates considerable selling pressure.
The price is showing a steady recovery today, retesting the previously br

GBP/USD | what's ahead? (READ THE CAPTION)Good morning folks, Amirali here.
As you can see, after yesterday's fall, GBPUSD went well below the Jan 26th NWOG and Feb 5th NDOG. However, it made an upwards move after the initial drop and is now being traded at 1.3670, just above the Jan 26th NWOG High.
Now, if the price holds above 1.3670 in

CADJPY - Range High Pressure!CADJPY is currently hovering right at the upper bound of its range, a level that has repeatedly acted as a ceiling for price.
Each time price reached this area in the past, upside momentum faded and sellers stepped in.
As long as this resistance zone holds, the focus stays on short setups, looking

EURUSD - Consolidation ahead of NFP. Bullish trendAfter rallying and reaching a new high of 1.19266, FX:EURUSD entered a consolidation phase amid a weak dollar, which is generally a positive sign for continued growth.
Against the backdrop of a weak dollar, the euro is forming a bullish trend, the likelihood of which continuing is also high,

See all forex ideas
Trade directly on Supercharts through our supported, fully-verified, and user-reviewed brokers.


