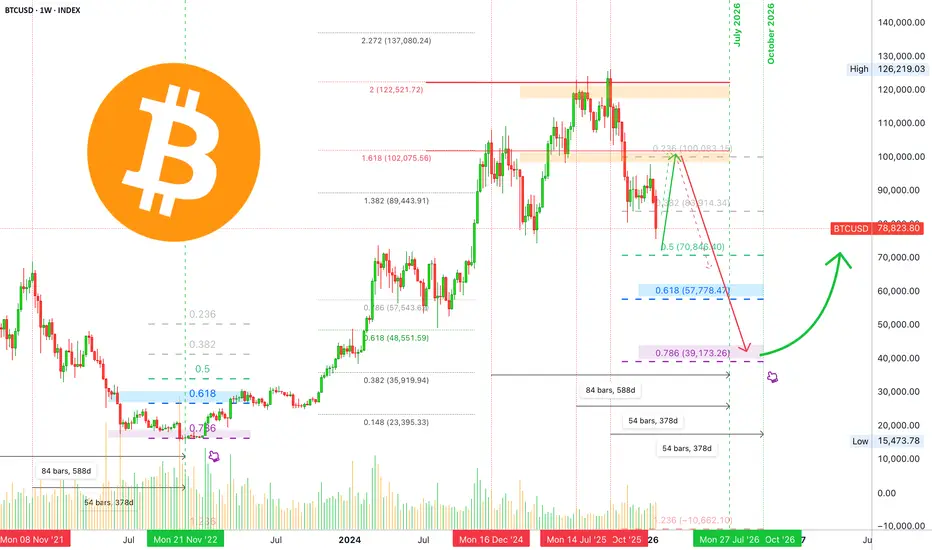
BITCOIN and the powerful Stoch RSI Cycle SignalThe Stoch RSI is a very rarely used indicator, in fact the last time we made use of it on Bitcoin (BTCUSD) was around the bottom of the 2022 Bear Cycle. We bring it forward to you once more as December closed with the 1M Stoch RSI below the 20.00 level. Historically, every time the market did that,

The best trades require research, then commitment.
Get started for free$0 forever, no credit card needed

Scott "Kidd" PoteetPolaris Dawn astronaut

Where the world does markets
Join 100 million traders and investors taking the future into their own hands.

GBPNZD - Two Magnets, Two Clear JobsGBPNZD is trading between two zones that keep acting like magnets:
On the upside, the red structure has been attracting price again and again. Every time price reaches that area, sellers show up. As long as that structure holds, that’s where I’ll be looking for shorts.📉
On the downside , the bl

Intuit and Netflix. The Danger of Broken TrendsIntuit and Netflix. The Danger of Broken Trends
Momentum is the most powerful force in physics and finance but when an object in motion suddenly stops the impact is catastrophic. We often assume trends last forever yet the moment a multi year structure fractures it triggers a violent repricing e

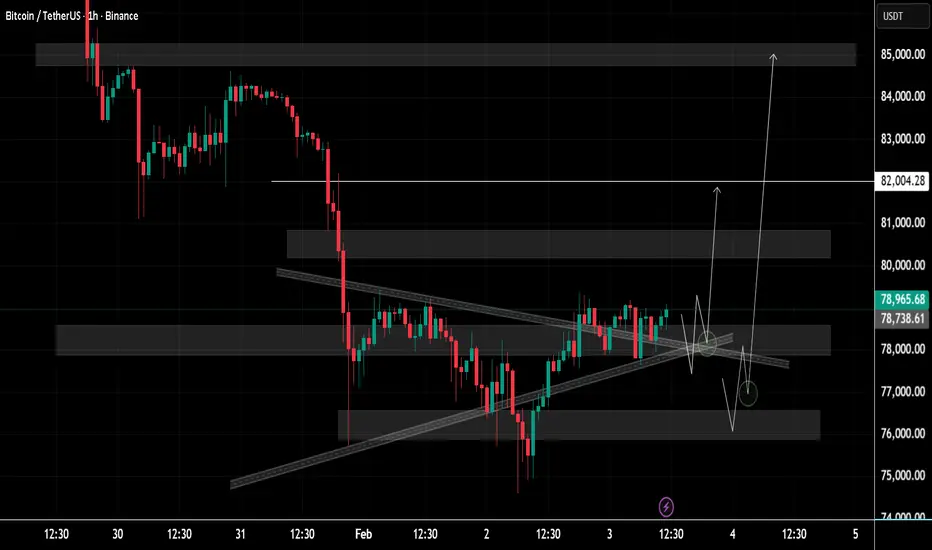
Bitcoin - Last drop, then a huge pump! (watch this wedge)Bitcoin is currently trading at around 78,000 at the time of writing this article, and I expect the price to go down to 71k - 72k in the short term. Why? As we can see on the chart, there are many reasons why Bitcoin should go down. The first reason is that whales (banks, institutions) still didn't

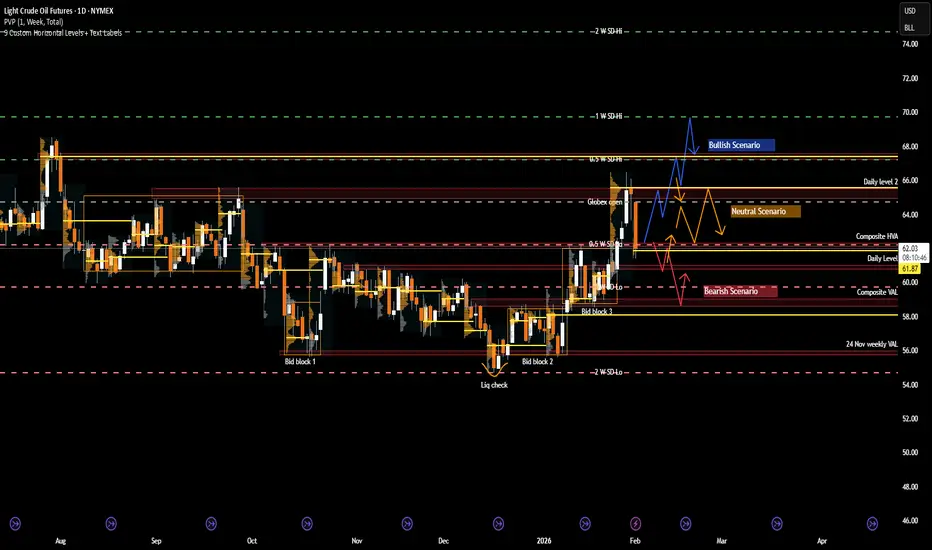
CL: Crude Oil at a Crossroads as Geopolitics Meet Key LevelsRecent Sentiment and Key Headlines Driving Crude
Crude oil sentiment over recent weeks has been shaped by a renewed mix of geopolitical risk and shifting expectations around global supply discipline. Headlines tied to Venezuela and Iran have been particularly influential, adding a layer of risk pr
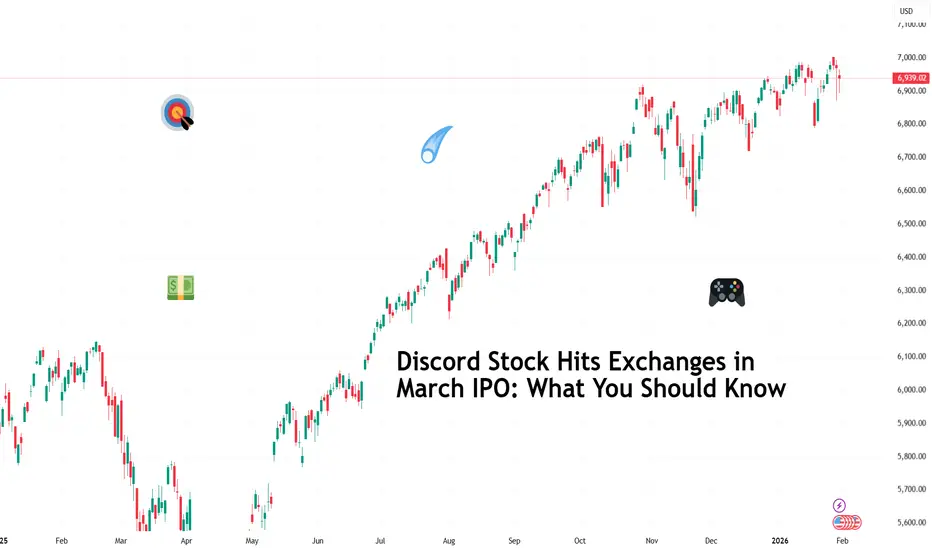
Discord Stock Hits Exchanges in March IPO: What You Should KnowDiscord NASDAQ:DISCORD has filed confidential IPO paperwork with the SEC and is aiming for a March debut (ref: the IPO calendar ), reigniting speculation around one of Silicon Valley’s most closely watched private companies.
The late-stage startup has lined up heavyweight underwriters Goldman Sa
AUD/USD – H1 - Head & Shoulders BreakdownAUD/USD has printed a clean Head & Shoulders pattern on the H1 timeframe , signaling a potential trend reversal after a strong bullish run. Price has now broken below the neckline, confirming bearish momentum and opening the door for a deeper correction. OANDA:AUDUSD
🔍 Technical Analysis
🧠 Cla

Bitcoin long-term: Full analysis year 2026 including 2027 & 2029My dear reader... It is my pleasure to write again for you today. I would like to show you the chart for Bitcoin long-term; what it looks like, what to expect.
Recently, we had a nice surprise with a bearish move that lasted just a few days longer than expected. A supposed retrace that went from $9
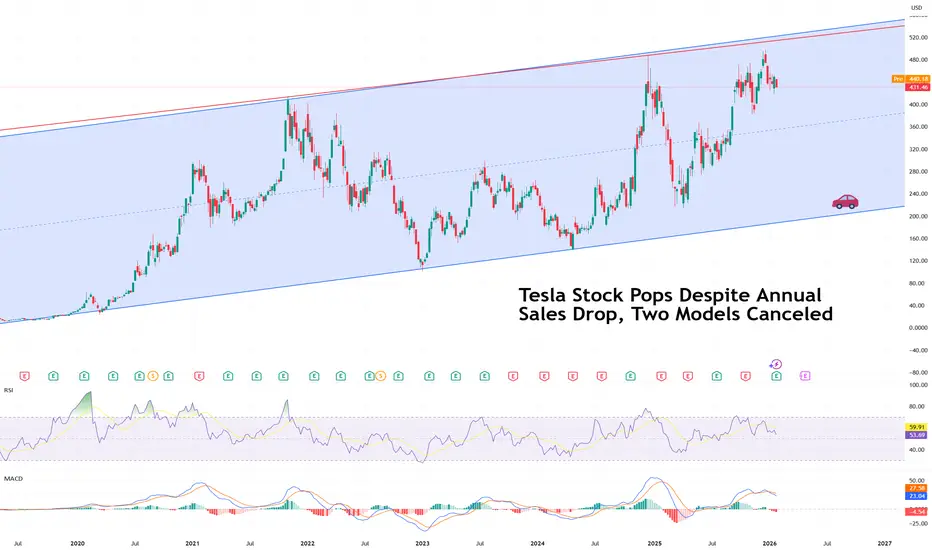
Tesla Stock Pops Despite Annual Sales Drop, Two Models CanceledTesla stock NASDAQ:TSLA managed a modest pop pre-market Thursday, rising about 3%, even as the company delivered a quarter that, on the surface, looked anything but celebratory.
Profits slid. Revenue dipped. Vehicle sales declined. Two iconic models were sent quietly into retirement. And yet, the
EURUSDHello Traders! 👋
What are your thoughts on EURUSD?
EUR/USD has successfully broken above the descending trendline as well as a key resistance zone, confirming a bullish breakout on the daily timeframe.
At current levels, price is approaching a resistance area. Therefore, a short-term correction

See all editors' picks ideas
Smart Trader, Episode 03, by Ata Sabanci, Candles and TradelinesA volume-based multi-block analysis system designed for educational purposes. This indicator helps traders understand their current market situation through aggregated block analysis, volumetric calculations, trend detection, and an AI-style narrative engine.
━━━━━━━━━━━━━━━━━━━━━━━━━━━━━━━━━━━━━━━

Asset Drift ModelThis Asset Drift Model is a statistical tool designed to detect whether an asset exhibits a systematic directional tendency in its historical returns. Unlike traditional momentum indicators that react to price movements, this indicator performs a formal hypothesis test to determine if the observed d

Hyperfork Matrix🔱 Hyperfork Matrix 🔱 A manual Andrews Pitchfork tool with action/reaction propagation lines and lattice matrix functionality. This indicator extends Dr. Alan Andrews' and Patrick Mikula's median line methodology by automating the projection of reaction and action lines at equidistant intervals, cr

Arbitrage Matrix [LuxAlgo]The Arbitrage Matrix is a follow-up to our Arbitrage Detector that compares the spreads in price and volume between all the major crypto exchanges and forex brokers for any given asset.
It provides traders with a comprehensive view of the entire marketplace, revealing hidden relationships among d

Wyckoff Schematic by Kingshuk GhoshThe "Wyckoff Schematic" is a Pine Script indicator that automatically detects and visualizes Wyckoff Method accumulation and distribution patterns in real-time. This professional tool helps traders identify smart money movements, phase transitions, and critical market structure points.
Key Features

Volume Cluster Profile [VCP] (Zeiierman)█ Overview
Volume Cluster Profile (Zeiierman) is a volume profile tool that builds cluster-enhanced volume-by-price maps for both the current market window and prior swing segments.
Instead of treating the profile as a raw histogram only, VCP detects the dominant volume peaks (clusters) insid

DeeptestDeeptest: Quantitative Backtesting Library for Pine Script
━━━━━━━━━━━━━━━━━━━━━━━━━━━━━━━━━━
█ OVERVIEW
Deeptest is a Pine Script library that provides quantitative analysis tools for strategy backtesting. It calculates over 100 statistical metrics including risk-adjusted return ratios (Sharpe

Arbitrage Detector [LuxAlgo]The Arbitrage Detector unveils hidden spreads in the crypto and forex markets. It compares the same asset on the main crypto exchanges and forex brokers and displays both prices and volumes on a dashboard, as well as the maximum spread detected on a histogram divided by four user-selected percenti

Multi-Distribution Volume Profile (Zeiierman)█ Overview
Multi-Distribution Volume Profile (Zeiierman) is a flexible, structure-first volume profile tool that lets you reshape how volume is distributed across price, from classic uniform profiles to advanced statistical curves like Gaussian, Lognormal, Student-t, and more.
Instead of forcin

Multi-Ticker Anchored CandlesMulti-Ticker Anchored Candles (MTAC) is a simple tool for overlaying up to 3 tickers onto the same chart. This is achieved by interpreting each symbol's OHLC data as percentages, then plotting their candle points relative to the main chart's open. This allows for a simple comparison of tickers to tr

See all indicators and strategies
Community trends
Netflix - Finally approaching support!🎥Netlix ( NASDAQ:NFLX ) will soon reverse higher:
🔎Analysis summary:
The recent -40% correction on Netflix was totally expected. But slowly, Netflix is approaching a major confluence of support at the previous all time high. If we see a final -15% drop, Netflix can then reverse towards the up

Entry on Lithium America Corp (LAC)There is e clear signal of weekly trend reversal. Lithium market will recover in 2026 with all electric vehicle, robotica and AI.
Expect a 200% run minmimun to 10-15usd.
Let me know what you think
🎉

Riot Platforms at $15.47: Oversold Setup Points to a Bounce ThiCurrent Price: 15.47 (Analysis was generated on Monday Morning)
Direction: LONG
Confidence level: 56%(Price is sitting near a widely watched support zone with oversold momentum signals, while trader commentary suggests dip-buying interest despite mixed broader sentiment.)
Targets
Target 1: 16.30

ADBE - Good Buy Opportunity?ADBE chart has been struggling recently but there is a chance we see some relief.
This current price zone has a nice probability of giving a bounce. Morningstar has ADBE fair value to be estimated at around $560 (90% upside from current price). Looks like a great opportunity!
Valuation:
P/E ->

Reddit (RDDT): Technically Aligned, Risk Now DefinedReddit is one of the most recognizable platforms on the internet.
A place where retail investors, niche communities, and real-time sentiment collide.
From WallStreetBets to hyper-specific hobby forums, Reddit is not just social media - it’s a behavioral data engine powered by highly engaged users.

$MSFT I expect further downsideI see a lot of investors buying NASDAQ:MSFT , but in my view it’s far too early. The technical structure is still bearish, and I expect further downside.
On the fundamental side, Microsoft Office will become far less essential as AI increasingly automates these tasks. Despite the Copilot narrative

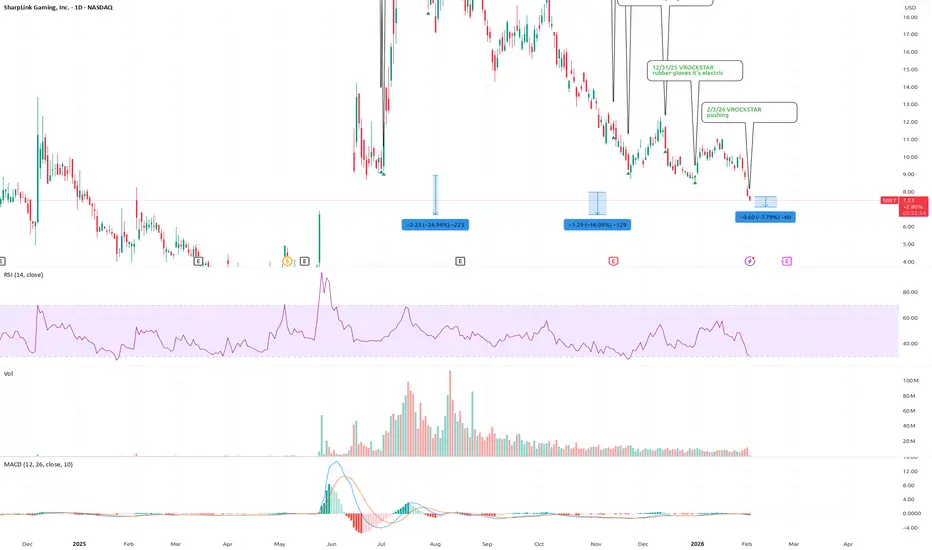
2/3/26 - $sbet - pushing2/3/26 :: VROCKSTAR :: NASDAQ:SBET
pushing
- $1.8k implied eth
- no liquidation risk
- can still go lower
- but i'm starting to size this up
- 40% of book
V
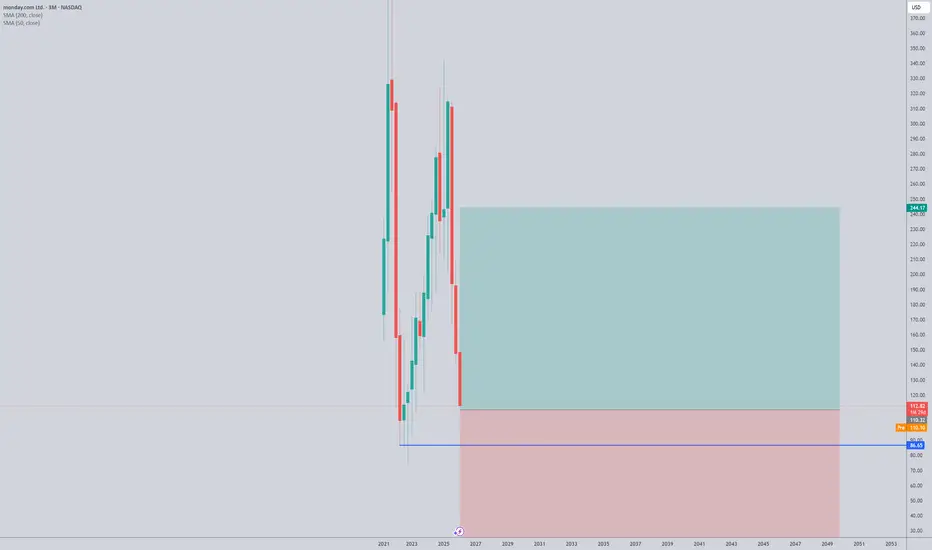
Monday.com MNDY Monday.com is a "Predator" in sheep's clothing. It has a Gross Margin of 89% and 0 debt, making it a financial fortress. The collapse to $114 was due to panic before the report. If the report on February 9 shows that AI is actually helping sales, the stock could be back to $150 in days.
MSTR Quick Update: For What It's Worth...Follow me here on TW for my regular critical updates on crypto (BTC, ETH, SOL, MSTR) and metals (GLD, SL, PL) based on Martin Armstrong's Socrates.
Look in my TW Ideas for posts of each market individually.
I always say that bouncing strongly from the reversals is very bullish but I've been sayin

See all stocks ideas
Today
UBCPUnited Bancorp, Inc.
Actual
0.35
USD
Estimate
—
Today
YUMCYum China Holdings, Inc.
Actual
0.36
USD
Estimate
0.30
USD
Today
SLGNSilgan Holdings Inc.
Actual
0.67
USD
Estimate
0.64
USD
Today
OCSLOaktree Specialty Lending Corporation
Actual
0.42
USD
Estimate
0.38
USD
Today
BGBunge Limited
Actual
1.99
USD
Estimate
1.81
USD
Today
SWKStanley Black & Decker, Inc.
Actual
1.41
USD
Estimate
1.28
USD
Today
GEHCGE HealthCare Technologies Inc.
Actual
1.44
USD
Estimate
1.40
USD
Today
CTSHCognizant Technology Solutions Corporation
Actual
1.35
USD
Estimate
1.32
USD
See more events
Community trends
Bitcoin - Last drop, then a huge pump! (watch this wedge)Bitcoin is currently trading at around 78,000 at the time of writing this article, and I expect the price to go down to 71k - 72k in the short term. Why? As we can see on the chart, there are many reasons why Bitcoin should go down. The first reason is that whales (banks, institutions) still didn't
BTCUSDT Bearish Structure Holds - Short From ResistanceHello traders! Here’s my technical outlook on BTCUSDT (2H) based on the current chart structure. Bitcoin initially traded within a clearly defined range, where price moved sideways for an extended period, indicating market equilibrium and accumulation before the next directional move. This ranging p
Bitcoin Holds Heavy Support — Bullish Flag Signals Next ImpulseAs I expected in my previous idea , Bitcoin( BINANCE:BTCUSDT ) reached its targets and rose as anticipated.
Currently, Bitcoin is moving within the heavy support zone($78,260-$70,080).
From a classical technical analysis standpoint, on the 15-minute timeframe, Bitcoin seems to be forming a bullis

BITCOIN and the powerful Stoch RSI Cycle SignalThe Stoch RSI is a very rarely used indicator, in fact the last time we made use of it on Bitcoin (BTCUSD) was around the bottom of the 2022 Bear Cycle. We bring it forward to you once more as December closed with the 1M Stoch RSI below the 20.00 level. Historically, every time the market did that,
The "US Bitcoin Reserve" is a Lie. (A Macro Deep Dive)While Retail is chasing headlines about a "Strategic Bitcoin Reserve," Smart Money is aggressively de-risking. Why? Because the "News" is a linguistic misunderstanding, and the "Macro" just turned violently bearish.
If you are buying this dip because you think the US Government is about to print t

Bitcoin - Sweep, Reclaim, Then Continuation Lower?Higher Timeframe Context
Price continues to respect a broader bearish structure, with lower highs forming after the previous distribution phase. The recent downside expansion did not occur randomly, it aligned with higher timeframe weakness and persistent sell-side pressure. Even though support has

Elise | BTCUSD – 30M – Range Recovery StructureBITSTAMP:BTCUSD
After a sharp bearish impulse, BTC formed a base and transitioned into a range-bound corrective phase. Buyers defended demand effectively, but upside continuation remains conditional on holding range support. Current price action suggests accumulation before the next directional mo

Bitcoin Price Update – Clean & Clear ExplanationBitcoin is currently consolidating after a sharp sell-off, trading around 78,900. Price action is forming a symmetrical triangle, showing indecision as buyers and sellers compress price toward a breakout point.
Key Technical Structure
If Price is squeezed between a descending resistance trendline
SHIBA INU: Don't Miss This Trade - LONG TERM TRADESHIBA INU: Don't Miss This Trade - LONG TERM TRADE
Currently, SHIBA INU is in a Long-Term Accumulation Before Next Move
SHIBA INU is approaching a major historical support zone around 0.0000067, a level that has triggered strong bullish reactions in the past.
Price has been consolidating for mont

ETHUSDT Trendline Rejection Confirms Bearish Continuation PhaseETHUSDT (1D) remains firmly bearish following the confirmed loss of the $2,770–$2,640 supply zone, which has now flipped into strong resistance. The macro structure continues to print lower highs, with major rejections recorded at $4,946, $4,768, and most recently $3,385, all aligning with the desce

See all crypto ideas
GOLD Price Update – Clean & Clear ExplanationGold is showing early signs of recovery after a strong bearish move, but the price is still trading below a major descending trendline, which remains a key resistance.
The broader structure is still bearish, as price continues to respect the downward sloping trendline from previous highs. However,

XAUUSDHello Traders! 👋
What are your thoughts on GOLD?
Gold printed a new all-time high before facing a sharp bearish rejection from the highlighted resistance zone. Following this strong sell-off, price dropped aggressively toward the 4400 support area, where buyers stepped in and prevented further dow

Gold 30-Min — Volume Buy & Sell Reversal Triggered⚡Base : Hanzo Trading Alpha Algorithm
The algorithm calculates volatility displacement vs liquidity recovery, identifying where probability meets imbalance.
It trades only where precision, volume, and manipulation intersect —only logic.
✈️ Technical Reasons
/ Direction — LONG / Reversal 4355 Area

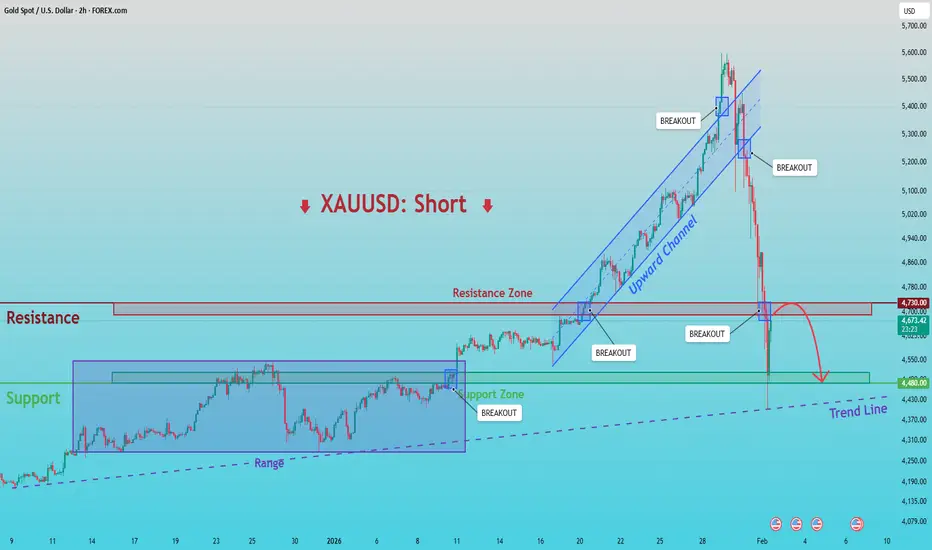
XAUUSD: Below 4,730 Resistance - Targeting 4,480 SupportHello everyone, here is my breakdown of the current XAUUSD setup.
Market Analysis
XAUUSD was previously trading within a clearly defined upward channel, where price respected both the rising support and resistance boundaries, forming a sequence of higher highs and higher lows. This structure conf
Lingrid | GOLD Correction Ends - Bullish Move Ahead ?OANDA:XAUUSD reacted aggressively from the resistance zone near the recent peak, but the sell-off appears corrective rather than trend-breaking. Price swept liquidity below the rising structure, tagged the higher-timeframe support zone, and quickly rebounded — a sequence that often signals exhausti

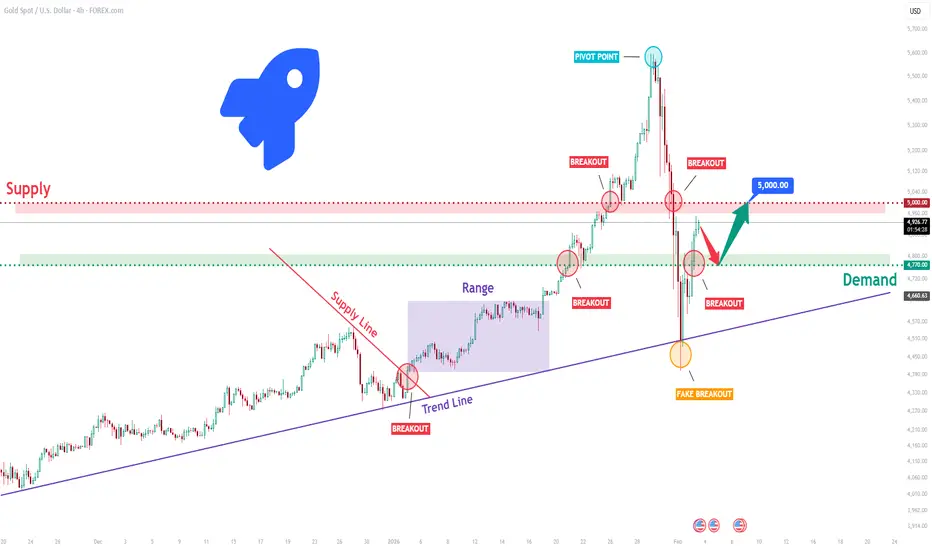
XAUUSD Long: After Fake Breakdown - $5,000 Back in SightHello traders! Here’s a clear technical breakdown of XAUUSD (4H) based on the current chart structure. Gold has been trading within a well-defined bullish environment for an extended period, supported by a rising trend line that guided price action higher. During this phase, price consistently print
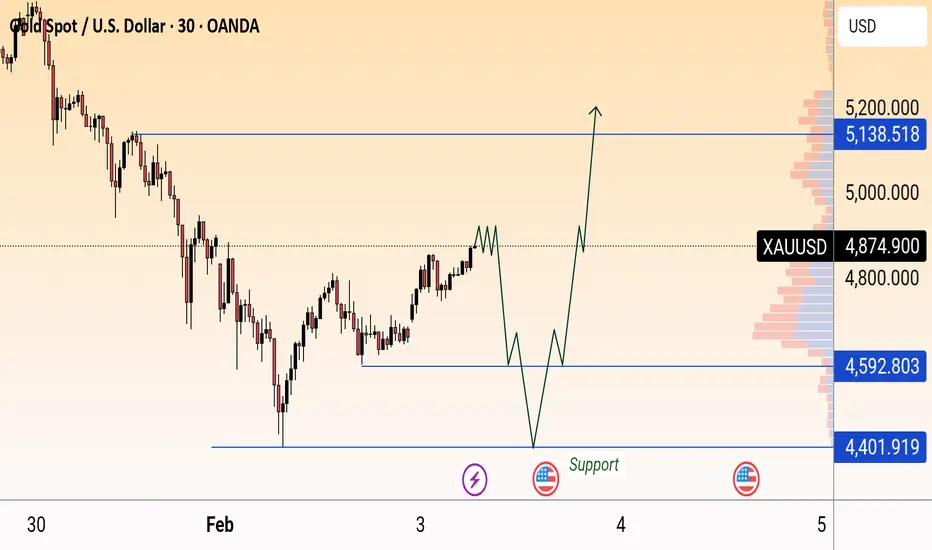
Gold Tests 4400 as Bullish Scenario EmergesGold Tests 4400 as Bullish Scenario Emerges
After taking into account all the confusion created by GOLD on our previous analysis, the chances are that gold may rise from the current zone.
Gold has already tested a very strong support zone dating back to mid-October 2025. It looks like the price h

GoldGold is currently consolidating after a strong bullish move. Price is holding above the key support zone around 4,590–4,600, indicating buyers are still active. The structure suggests a possible pullback into support, followed by a bullish continuation.
If price respects the support area, we may see
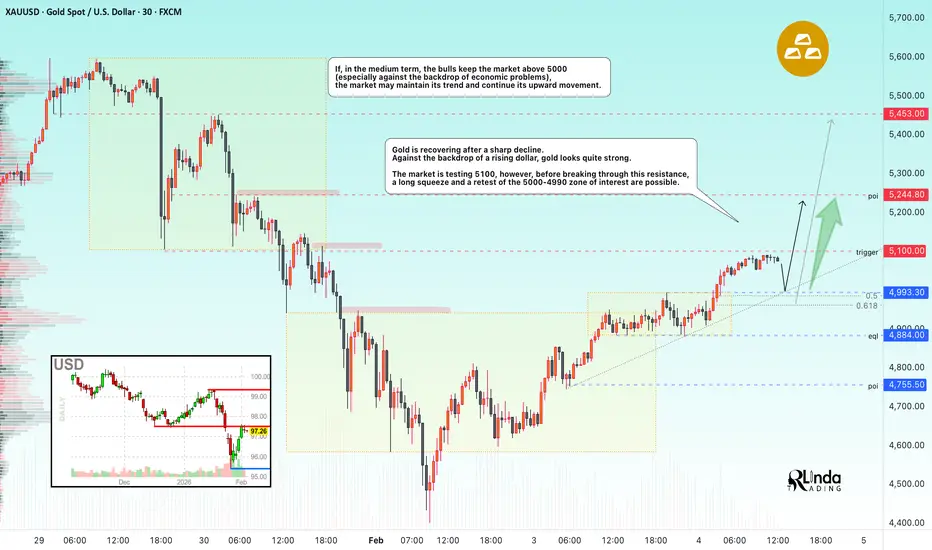
GOLD - Recovery. Pullback before growth to 5250...FX:XAUUSD continues its steady recovery. Against the backdrop of a rising dollar, the price of the metal looks quite strong... The rebound is due to the return of demand for safe-haven assets.
Geopolitics: US-Iran and new stages of escalation in the Russia-Ukraine conflict after a brief respit
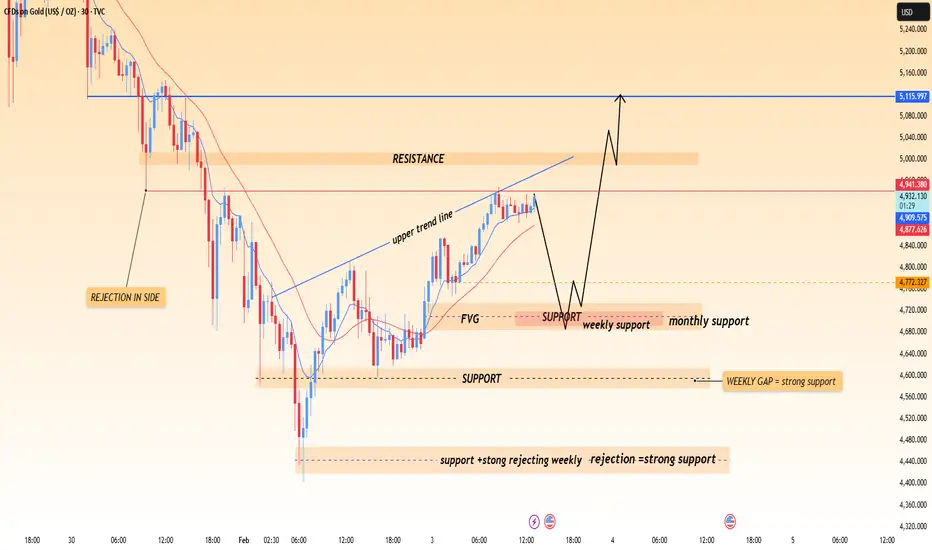
XAUUSD – Support Hold & Trendline Breakout SetupGold is forming a bullish corrective structure after a strong rejection from weekly & monthly support, with price holding above the FVG and demand zone. As long as support remains intact, a break above the upper trendline and resistance can open the path toward the next upside target, while failure
See all futures ideas
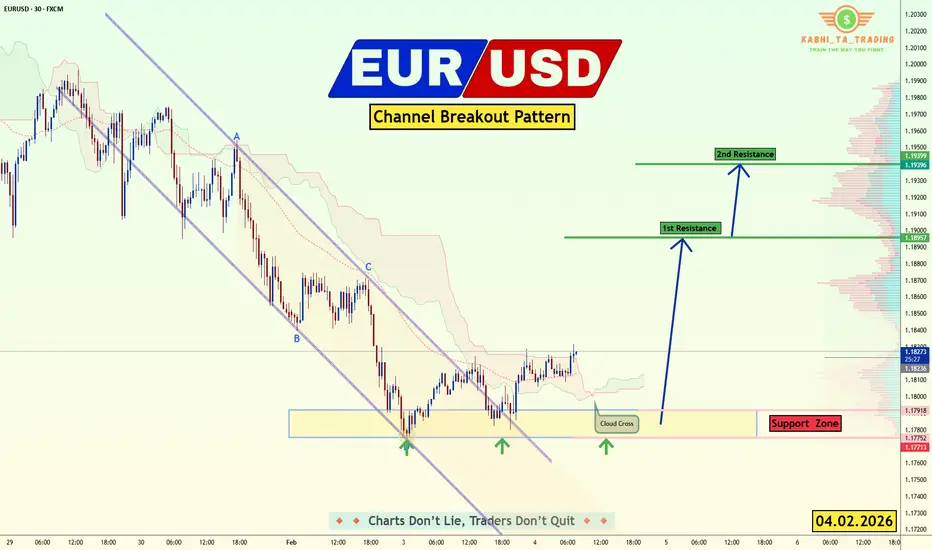
EUR/USD - Upside Expansion Next? (04.02.2026)📝 Description🔍 Setup FX:EURUSD
EUR/USD has been trading inside a descending channel and recently showed signs of structure shift after breaking and retesting the channel boundary.
Price reacted multiple times from the demand/support zone, forming higher lows.
Ichimoku shows a cloud cross and imp
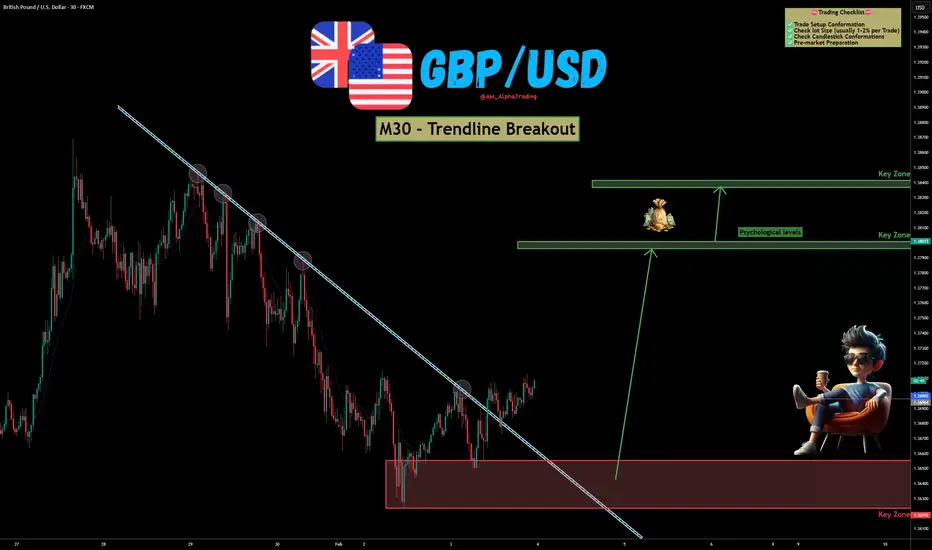
GBP/USD – Trendline Breakout | Bullish Reversal SetupGBP/USD has shown a clear breakout above a well-respected descending trendline on the M30 timeframe, hinting at a potential shift from bearish to bullish momentum. Price action is reacting strongly from a key demand zone, increasing the probability of continuation to the upside. OANDA:GBPUSD
📊
USDJPY: 1500+ Pips Selling Opportunity, Comment Your Views?Dear Traders,
We hope you’re doing well. We’ve identified a fantastic selling opportunity in the USDJPY pair. We anticipate a drop in the DXY and increased influence for the JPY in the market. We need confirmation within a shorter timeframe. The intraday timeframe is ideal for entering or executi

GBPNZD - Two Magnets, Two Clear JobsGBPNZD is trading between two zones that keep acting like magnets:
On the upside, the red structure has been attracting price again and again. Every time price reaches that area, sellers show up. As long as that structure holds, that’s where I’ll be looking for shorts.📉
On the downside , the bl
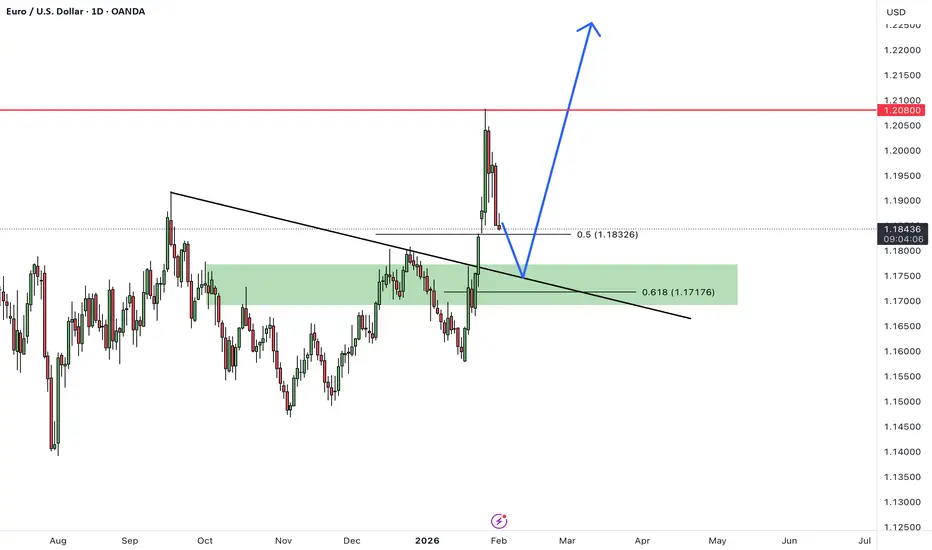
EURUSDHello Traders! 👋
What are your thoughts on EURUSD?
EUR/USD successfully broke above the key resistance zone and the descending trendline, extending its bullish move toward the 1.1200 area. From this level, the pair entered a corrective phase.
This pullback is considered a healthy correction and a
EURUSD Bulls Take Control - 1.1940 as Next TestHello traders! Here’s my technical outlook on EURUSD (3H) based on the current chart structure. EURUSD previously traded within a well-defined ascending channel, where price consistently respected both the rising support line and the channel resistance, confirming steady bullish control and healthy

EURUSD: Buyers Defend 1.1780 - Upside in Focus 1.1870Hello everyone, here is my breakdown of the current EURUSD setup.
Market Analysis
EURUSD was previously trading within a well-defined downward channel, where price consistently respected the descending resistance and support boundaries, forming a series of lower highs and lower lows. This structu

04.02.26 Daily ForecastPairs on Watch -
FX:EURUSD
FX:GBPUSD
FX:USDCAD
A short overview of the instruments I am looking at for today, multi-timeframe analysis down to what I will be looking at for an entry. Enjoy!

CADJPY: JPY Weakness Supported by Election UncertaintyCADJPY: JPY Weakness Supported by Election Uncertainty
Fundamental Analysis:
JPY weakness is supported by the following news:
Prime Minister Sanae Takaichi, who is running in a snap election that she is widely expected to win this Sunday, sparked a sell-off in the yen earlier this week after a c
#CHFJPY: Important BreakoutThe CHFJPY pair has successfully violated a resistance level within an ascending triangle pattern on the 4-hour timeframe.
This previously broken structure is now anticipated to act as a robust support level.
It is possible that the pair will continue its upward trend following a brief retraceme

See all forex ideas
| - | - | - | - | - | - | - | ||
| - | - | - | - | - | - | - | ||
| - | - | - | - | - | - | - | ||
| - | - | - | - | - | - | - | ||
| - | - | - | - | - | - | - | ||
| - | - | - | - | - | - | - | ||
| - | - | - | - | - | - | - | ||
| - | - | - | - | - | - | - |
Trade directly on Supercharts through our supported, fully-verified, and user-reviewed brokers.


