Oracle - The worst drawdown ever!💣Oracle ( NYSE:ORCL ) will ends its bearmarket soon:
🔎Analysis summary:
Over the past five months, Oracle has been correcting more than -60%. And while we can clearly witness a major selloff, Oracle is also approaching a major support area. And if we see bullish confirmation in the near futur

The best trades require research, then commitment.
Get started for free$0 forever, no credit card needed

Scott "Kidd" PoteetPolaris Dawn astronaut

Where the world does markets
Join 100 million traders and investors taking the future into their own hands.

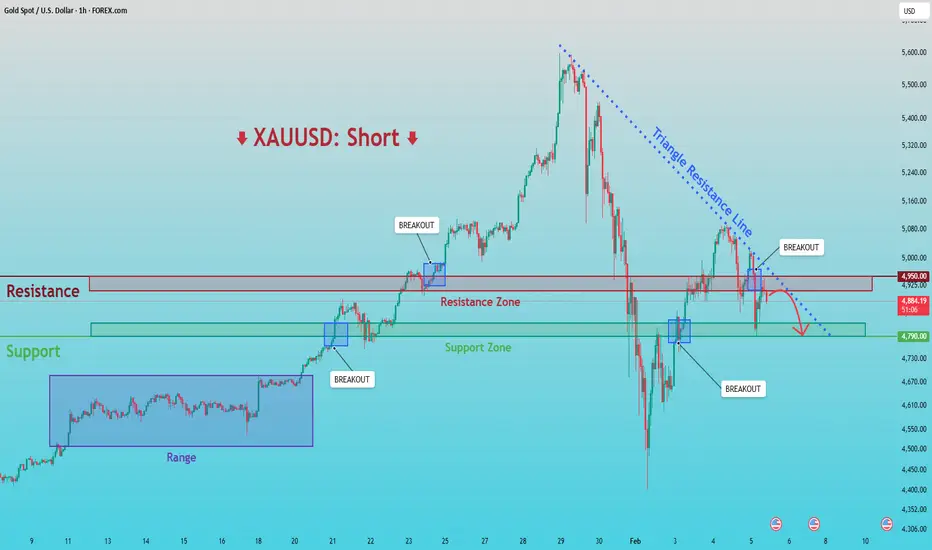
XAUUSD: Breakdown & Retest Signals Bearish ContinuationHello everyone, here is my breakdown of the current XAUUSD setup.
Market Analysis
XAUUSD previously traded within a well-defined consolidation range, where price moved sideways for an extended period, indicating balance between buyers and sellers and gradual liquidity accumulation. This range eve
FTSE100 Breakout supported at previous consolidation zoneThe FTSE remains in a bullish trend, with recent price action showing signs of a breakout within the broader uptrend.
Support Zone: 10340 – a key level from previous consolidation. Price is currently testing or approaching this level.
A bullish rebound from 9490 would confirm ongoing upside moment

MNQ Daily Analysis - Tuesday February 3 2026 part 1As a learning, beginner day trader I go through the market replay predefining what I am looking for to enter a trade and walk through my thoughts as I experience the market action bar by bar throughout the entire day to see how I handle various events and assess my execution.
This is for me and oth

BITCOIN and the powerful Stoch RSI Cycle SignalThe Stoch RSI is a very rarely used indicator, in fact the last time we made use of it on Bitcoin (BTCUSD) was around the bottom of the 2022 Bear Cycle. We bring it forward to you once more as December closed with the 1M Stoch RSI below the 20.00 level. Historically, every time the market did that,

GBPNZD - Two Magnets, Two Clear JobsGBPNZD is trading between two zones that keep acting like magnets:
On the upside, the red structure has been attracting price again and again. Every time price reaches that area, sellers show up. As long as that structure holds, that’s where I’ll be looking for shorts.📉
On the downside , the bl

Intuit and Netflix. The Danger of Broken TrendsIntuit and Netflix. The Danger of Broken Trends
Momentum is the most powerful force in physics and finance but when an object in motion suddenly stops the impact is catastrophic. We often assume trends last forever yet the moment a multi year structure fractures it triggers a violent repricing e

Bitcoin - Last drop, then a huge pump! (watch this wedge)Bitcoin is currently trading at around 78,000 at the time of writing this article, and I expect the price to go down to 71k - 72k in the short term. Why? As we can see on the chart, there are many reasons why Bitcoin should go down. The first reason is that whales (banks, institutions) still didn't

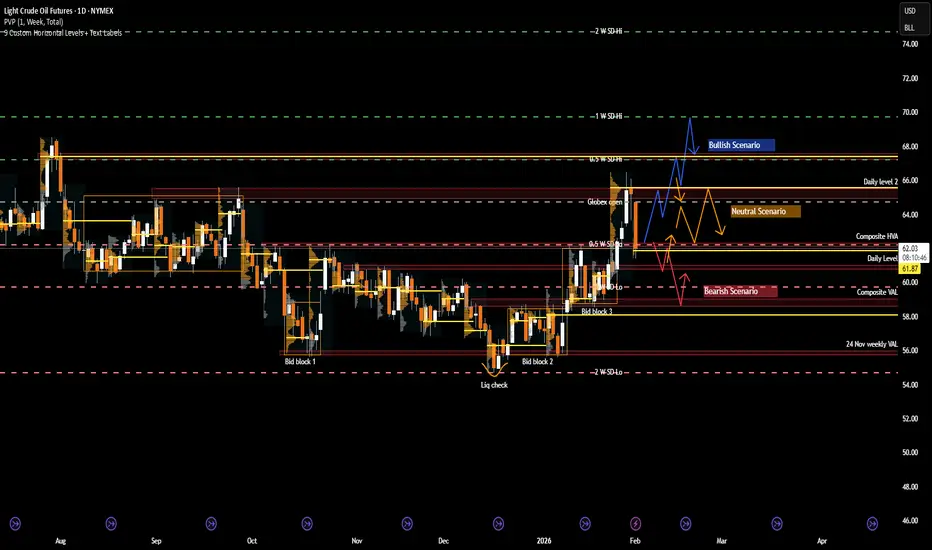
CL: Crude Oil at a Crossroads as Geopolitics Meet Key LevelsRecent Sentiment and Key Headlines Driving Crude
Crude oil sentiment over recent weeks has been shaped by a renewed mix of geopolitical risk and shifting expectations around global supply discipline. Headlines tied to Venezuela and Iran have been particularly influential, adding a layer of risk pr
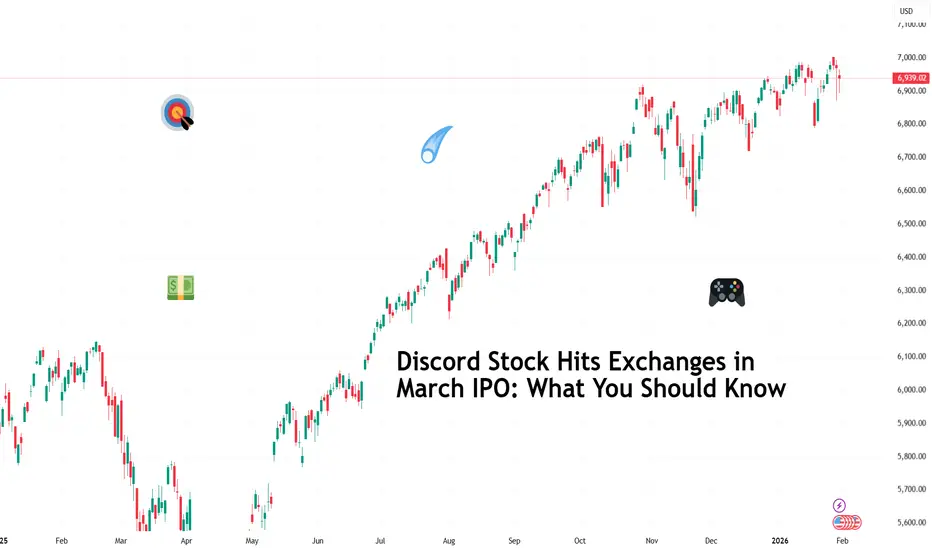
Discord Stock Hits Exchanges in March IPO: What You Should KnowDiscord NASDAQ:DISCORD has filed confidential IPO paperwork with the SEC and is aiming for a March debut (ref: the IPO calendar ), reigniting speculation around one of Silicon Valley’s most closely watched private companies.
The late-stage startup has lined up heavyweight underwriters Goldman Sa
See all editors' picks ideas
Smart Trader, Episode 03, by Ata Sabanci, Candles and TradelinesA volume-based multi-block analysis system designed for educational purposes. This indicator helps traders understand their current market situation through aggregated block analysis, volumetric calculations, trend detection, and an AI-style narrative engine.
━━━━━━━━━━━━━━━━━━━━━━━━━━━━━━━━━━━━━━━

Asset Drift ModelThis Asset Drift Model is a statistical tool designed to detect whether an asset exhibits a systematic directional tendency in its historical returns. Unlike traditional momentum indicators that react to price movements, this indicator performs a formal hypothesis test to determine if the observed d

Hyperfork Matrix🔱 Hyperfork Matrix 🔱 A manual Andrews Pitchfork tool with action/reaction propagation lines and lattice matrix functionality. This indicator extends Dr. Alan Andrews' and Patrick Mikula's median line methodology by automating the projection of reaction and action lines at equidistant intervals, cr

Arbitrage Matrix [LuxAlgo]The Arbitrage Matrix is a follow-up to our Arbitrage Detector that compares the spreads in price and volume between all the major crypto exchanges and forex brokers for any given asset.
It provides traders with a comprehensive view of the entire marketplace, revealing hidden relationships among d

Wyckoff Schematic by Kingshuk GhoshThe "Wyckoff Schematic" is a Pine Script indicator that automatically detects and visualizes Wyckoff Method accumulation and distribution patterns in real-time. This professional tool helps traders identify smart money movements, phase transitions, and critical market structure points.
Key Features

Volume Cluster Profile [VCP] (Zeiierman)█ Overview
Volume Cluster Profile (Zeiierman) is a volume profile tool that builds cluster-enhanced volume-by-price maps for both the current market window and prior swing segments.
Instead of treating the profile as a raw histogram only, VCP detects the dominant volume peaks (clusters) insid

DeeptestDeeptest: Quantitative Backtesting Library for Pine Script
━━━━━━━━━━━━━━━━━━━━━━━━━━━━━━━━━━
█ OVERVIEW
Deeptest is a Pine Script library that provides quantitative analysis tools for strategy backtesting. It calculates over 100 statistical metrics including risk-adjusted return ratios (Sharpe

Arbitrage Detector [LuxAlgo]The Arbitrage Detector unveils hidden spreads in the crypto and forex markets. It compares the same asset on the main crypto exchanges and forex brokers and displays both prices and volumes on a dashboard, as well as the maximum spread detected on a histogram divided by four user-selected percenti

Multi-Distribution Volume Profile (Zeiierman)█ Overview
Multi-Distribution Volume Profile (Zeiierman) is a flexible, structure-first volume profile tool that lets you reshape how volume is distributed across price, from classic uniform profiles to advanced statistical curves like Gaussian, Lognormal, Student-t, and more.
Instead of forcin

Multi-Ticker Anchored CandlesMulti-Ticker Anchored Candles (MTAC) is a simple tool for overlaying up to 3 tickers onto the same chart. This is achieved by interpreting each symbol's OHLC data as percentages, then plotting their candle points relative to the main chart's open. This allows for a simple comparison of tickers to tr

See all indicators and strategies
Community trends
Alphabet - The only surviving stock!🏅Alphabet ( NASDAQ:GOOG ) is clearly not bearish yet:
🔎Analysis summary:
The entire tech sector is currently collapsing. But Alphabet remains totally strong and is sitting close to new all time highs. But considering that current retest of the major resistance trendline, a short term pullback

RIOT: Looking for bottoming formationThe overall equity and crypto market crash didn't do any favor to RIOT stock. Despite a lot of good things happening for the company, the short-term headwinds are propelling much of the selling. The rapid selling across the markets has a strong signature of capitulation. Which means, I am now lookin

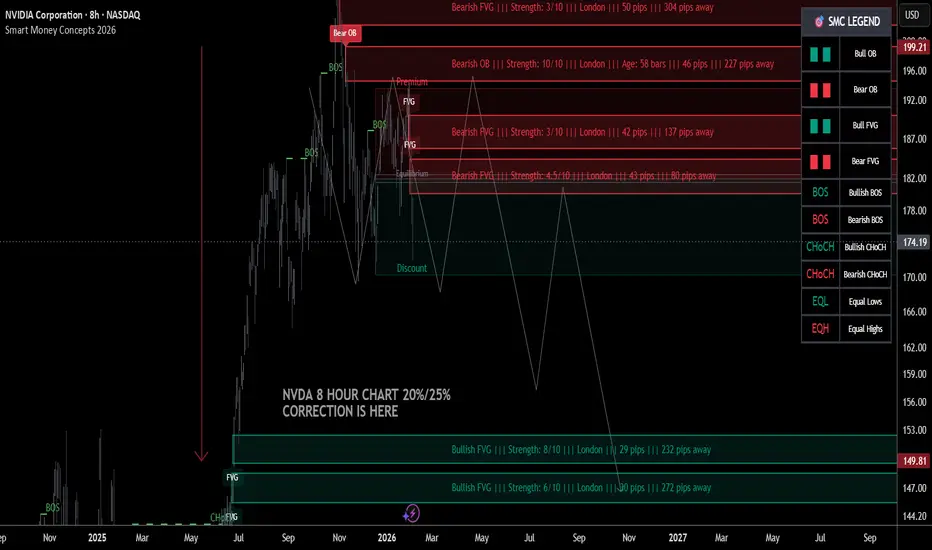
NVDA 25% correction is finally here🔱 NVDA WEEKLY SNAPSHOT — EXECUTIVE SUMMARY
🧨 Bears remain in control as price action continues to respect overhead supply, with rallies viewed as distribution opportunities
🔻 Key sell zones: 196 bearish Order Block + 186 / 182 bearish FVGs — rips into these areas are for selling
🎯 Primary downside
AMZN Wait For The Crack!This is a complete structure with 4 points, 3 waves, and a hook revealing a rising wedge.
The first mini-crack has already taken place.
The structure is all set up, valid, and ready to crack! All you have to do is wait.
🚨CAUTION! To all the bulls!
If you enjoy the work:
👉 Boost
👉 Follow
👉 Drop a

ReversalThe price closes the session at the lower boundary of the parallel channel highlighted in yellow, within which it has been moving for the past 4 years.
It is possible (and also likely) that a reversal may occur at this support level, offering an entry or accumulation opportunity.
In the event of a

RKT road to 22$After a downtrend price is trying to stay above Fib 0.5 level. A close above $20 will push thé Price to 21-22$ in aprox 3 weeks.
NFA

Zeta Global: structure reset on the weeklyZeta Global Holdings Corp. operates in marketing technology, providing data-driven customer intelligence and automation solutions for enterprises.
On the weekly chart, ZETA has completed a breakout above the long-term descending trendline and is currently holding a clean retest zone. The key suppo

$IREN: Seems to be in Wave CNASDAQ:IREN : It has finished 5 waves at the recent high. Finished Wave A down and the recent rally has turned out to be a B wave.
Now unfortunately, it's in a Wave C. The question is how long will it go. If it is a flat, extending slightly beyond the end of A will satisfy the pattern. After than

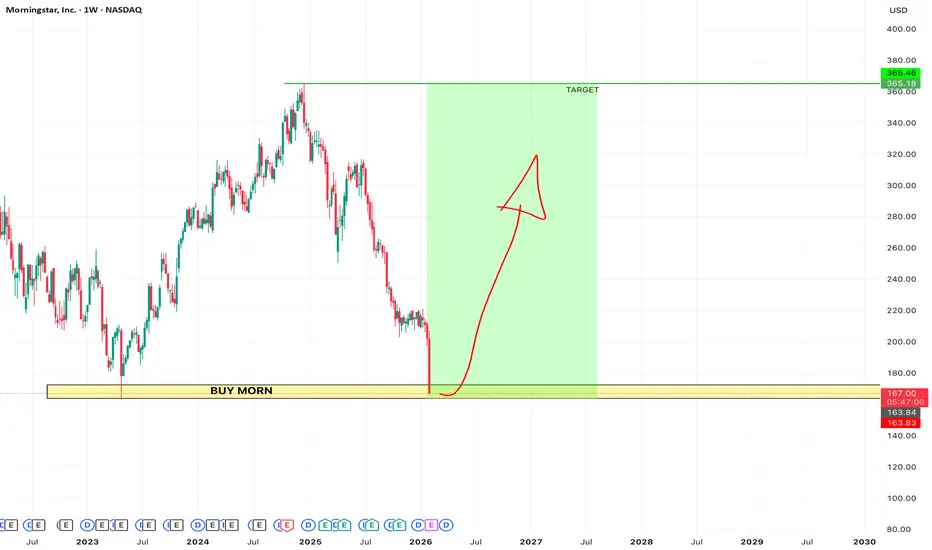
BUY MORNINGSTARAnother opportunity presenting itself in this mad week. Time to stay strong and resilient during these times.
HPQ could make a big move from here! OptionsMastery:
🔉Sound on!🔉
📣Make sure to watch fullscreen!📣
Thank you as always for watching my videos. I hope that you learned something very educational! Please feel free to like, share, and comment on this post. Remember only risk what you are willing to lose. Trading is very risky but it can c

See all stocks ideas
Feb 6
PRLBProto Labs, Inc.
Actual
0.44
USD
Estimate
0.35
USD
Feb 6
CNCCentene Corporation
Actual
−1.19
USD
Estimate
−1.22
USD
Feb 6
NWLNewell Brands Inc.
Actual
0.18
USD
Estimate
0.18
USD
Feb 6
JOUTJohnson Outdoors Inc.
Actual
−0.33
USD
Estimate
−0.45
USD
Feb 6
BIIBBiogen Inc.
Actual
1.99
USD
Estimate
1.63
USD
Feb 6
GRCGorman-Rupp Company (The)
Actual
0.55
USD
Estimate
0.48
USD
Feb 6
GHMGraham Corporation
Actual
0.25
USD
Estimate
0.21
USD
Feb 6
RXORXO, Inc.
Actual
−0.07
USD
Estimate
−0.04
USD
See more events
Community trends
BTCUSD Daily CLS Model 1 - Short term BuyHi friends, new range created. As always we are looking for the manipulation in to the key level around the range. Don't forget confirmation switch from manipulation phase to the distribution phase to make the setup valid. Stay patient and enter only after change in order flow. If price reaches 50%

This Isn’t a Reversal — It’s Only Phase Two. $BTC>65k Thank you for your attention! This is exactly what you've been hearing since September 2025. Next, we'll form the bottom, and reaccumulate until October.
A smart person told me to stop posting publicly. Make everything private, but I continue to publish my thoughts for you.
There are no entry point
BTCUSDT Lower Highs, Lower Lows - Bears in Full ControlHello traders! Here’s my technical outlook on BTCUSDT (3H) based on the current chart structure.BTCUSDT previously traded within a well-defined ascending channel, where price consistently respected both the rising support and resistance lines. This structure reflected a controlled bullish trend with

BTCUSD Heavy Dump → Buyers Step In at SupportBitcoin (BTCUSD) has experienced a strong bearish impulse, breaking multiple intraday supports and printing lower lows. After this aggressive sell-off, price is now showing signs of short-term stabilization near a key demand zone, where buyers are attempting to step in.
The current structure sugges

BTC May Be in Free Fall With Low MomentumBTC May Be in Free Fall With Low Momentum
From our previous analysis, BTC transformed with clear bullish and bearish patterns, but only respected the daily pattern
The price started a downtrend from the moment the bearish flag appeared, as I showed in the video.
BTC has already broken out of two

APEX - Time to buy this coin for a 10x profit. You know the phrase — "not your keys, not your money." Trading on a centralized exchange during a huge bear market can be risky. APEX is a great altcoin because it's associated with a decentralized exchange where you can also trade futures, stocks, and commodities without KYC. Can 2026, 2027, and 20

Bitcoin to $90k - February 2026Remember those dizzy heights seven days ago?
** The weeks ahead, void after May 2026 **
You read correctly, Without-worries has a bullish idea. For most of quarter 4, 2025 it has been a stream of bearish ideas, mostly all falling on deaf ears. Today is a bullish idea. A bullish idea with a time l

Bitcoin - When History RhymesMarket Context and Historical Symmetry
Bitcoin has a tendency to move in recognizable cycles, and what stands out right now is the near-perfect similarity between the previous bull market correction and the current one. During the 2021 cycle, price retraced approximately 52% from the all-time high
Why I Am NOT Buying $62kThe market just flushed 14% in a single day. The Retail crowd is looking at RSI and hitting "Buy." The Smart Money is waiting.
We are currently sitting at $62,900 after a brutal liquidation cascade.
The technicals are screaming "Oversold" (RSI is 9.5, Stochastic is 4.5).
In a normal market, this

BTC is really bearish (3D)We are working extremely hard to provide timely updates and accurate market analysis. You might be wondering why the price ranges keep changing frequently. The reason is simple: our primary goal is to protect our users from potential losses and liquidation risks. In a volatile market like this, it’s

See all crypto ideas
XAUUSD: Breakdown & Retest Signals Bearish ContinuationHello everyone, here is my breakdown of the current XAUUSD setup.
Market Analysis
XAUUSD previously traded within a well-defined consolidation range, where price moved sideways for an extended period, indicating balance between buyers and sellers and gradual liquidity accumulation. This range eve
GOLD - Consolidation in a symmetrical triangle. Up or down? FX:XAUUSD showed signs of recovery on Friday, but the price is stuck within the boundaries of a symmetrical triangle, which generally indicates market uncertainty.
Key fundamental factors
The ADP, JOLTS, and unemployment claims reports pointed to weakness in the labor market, supporting exp

Gold 30-Min — Volume Buy & Sell Reversal Triggered⚡Base : Hanzo Trading Alpha Algorithm
The algorithm calculates volatility displacement vs liquidity recovery, identifying where probability meets imbalance.
It trades only where precision, volume, and manipulation intersect —only logic.
✈️ Technical Reasons
/ Direction — LONG / Reversal 4760 Area

XAUUSD – Uptrend stalls, deeper correction riskAfter a strong and sustained rally, gold prices have encountered significant resistance around the 4,980–5,000 USD zone. The current upside momentum is showing clear signs of fading, as subsequent rebounds have failed to print new highs. Instead, a sequence of lower highs has emerged — a classic sig

Gold Price Analysis – Key Resistance and Support LevelsThis chart outlines critical resistance and support levels for gold prices. The Key Resistance Level at 5,565.814 is a potential area for price rejection or breakout. If price approaches this level, watch for either a continuation of bullish momentum or a pause in upward movement. The Support Zone a

Gold Rejected at Resistance: A Signal for Further Decline?XAUUSD is currently trading in a clearly defined bearish trend , as each recovery attempt has been repeatedly rejected at the descending trendline and overhead resistance zone. The current price structure suggests the market is not ready for a true reversal , but is instead forming technical pull

THE KOG REPORT - UpdateEnd of day update from us here at KOG:
Yesterday we plotted the potential range we expected price to play with the higher and low hot spots on the chart. We wanted both to complete one way or another, which as you can see from the chart, they have. Price managed to stay within the range so far gi

XAUUSD Short: Supply Holding, $4,750 Demand as TargetHello traders! Here’s a clear technical breakdown of XAUUSD (4H) based on the current chart structure. Gold previously traded within a well-defined ascending channel, where price respected both the rising support and resistance lines, forming a series of higher highs and higher lows. This structure

GOLD(XAUUSD): New Potential Zone For Swing And Intraday Buyers! Gold fell below our previous analysis’s expectations rendering it invalid. Consequently, we’ve identified two potential zones for buyers. One is safer while the other is riskier. You can choose either or both depending on your trading strategy.
Like and comment for more! We appreciate your suppo

Silver — Bearish Market Structure BreakdownCAPITALCOM:SILVER
Hello everyone here is the breakdown of the current XAGUSD SILVER setup
Silver is currently displaying a broader bearish market structure following a series of strong rejections and confirmed breakdowns at key levels. The 119 region acted as a major structural ceiling, where

See all futures ideas
EURUSD Bullish Recovery After Healthy Correction, Target 1.1870Hello traders! Here’s my technical outlook on EURUSD (4H) based on the current chart structure. EURUSD previously traded within a mixed structure that transitioned from a broader corrective phase into a clear bullish recovery. After forming a base near the rising higher-timeframe trend line, price b

06.02.26 Daily ForecastPairs on Watch -
FX:NZDUSD
FX:AUDUSD
FX:USDCAD
A short overview of the instruments I am looking at for today, multi-timeframe analysis down to what I will be looking at for an entry. Enjoy!

GBPUSD Pullback into Resistance After Channel Breakdown...GBPUSD (1H), price has reacted from the demand zone and is now pulling back inside a broader bearish structure (below the descending channel + under the Ichimoku cloud). So the clean play here is a bullish pullback target into resistance:
🎯 Upside Targets (for the current bounce)
1st Target (TP1):

AUDUSD Rally Into Sell Zone | Strong Dollar Theme Returns!Hey Traders,
In today’s trading session we are monitoring AUDUSD for a potential selling opportunity around the 0.70200 zone.
AUDUSD remains in a clear downtrend and is currently in a corrective pullback, approaching a confluence resistance area near 0.70200, where the descending trendline aligns

Don’t Rush to Buy EURUSD – The Bearish Trend Is Speaking UpEURUSD is currently leaning toward a short-term BEARISH trend, as recent news continues to favor the U.S. dollar over the euro . The ECB has kept interest rates unchanged with a rather cautious tone , while Eurozone data and momentum remain too weak to support a sustainable EUR recovery. In contra
EURUSD: Triangle Resistance Holds - Bearish Bias Toward 1.1730Hello everyone, here is my breakdown of the current EURUSD setup.
Market Analysis
EURUSD previously traded within a well-defined consolidation range, where price moved sideways for an extended period, reflecting temporary balance between buyers and sellers and gradual liquidity accumulation. This

TheGrove | EURUSD buy | Idea Trading AnalysisEURUSD broke through multiple Support level and is now holding above the trendline and key level zone. The current pullback toward the marked support cluster suggests a potential continuation of the bullish move, provided price holds this structure.
EUR/USD is trading within a rising channel, with

EUR/USD | Going to the bearish breaker (READ THE CAPTION)Good afternoon folks, Amirali here.
As you can see in the hourly chart of EURUSD, in the early hours of today, it reached the Bullish OB zone, then Swept the liquidity pool and then went up, hitting the IFVG and then gone above it, now being traded at 1.1796.
I'm eying the Bearish Breaker for a po

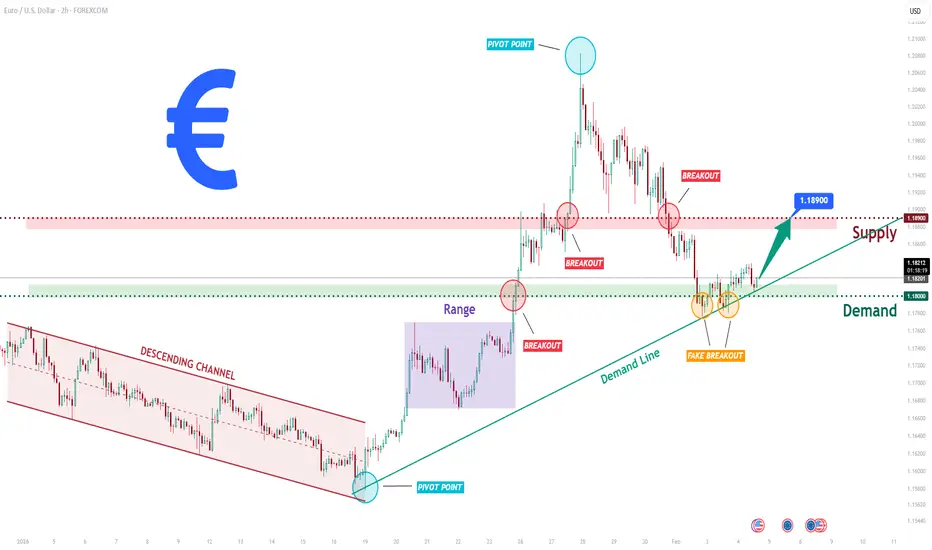
EURUSD Long: Demand Zone Holds - Bulls Preparing Next LegHello traders! Here’s a clear technical breakdown of EURUSD (2H) based on the current chart structure. EURUSD previously traded within a well-defined descending channel, where price consistently respected the descending resistance and support lines, forming a series of lower highs and lower lows. Th
GBPUSD Double Bottom Signals Bullish MomentumGBPUSD Double Bottom Signals Bullish Momentum
GBPUSD has formed a small double bottom around the 1.3500 support, hinting at a possible bullish reversal.
The price is currently at 1.3585 and the GBPUSD has been rising since morning on low volume, but is only increasing.
I see short-term upside t

See all forex ideas
Trade directly on Supercharts through our supported, fully-verified, and user-reviewed brokers.


