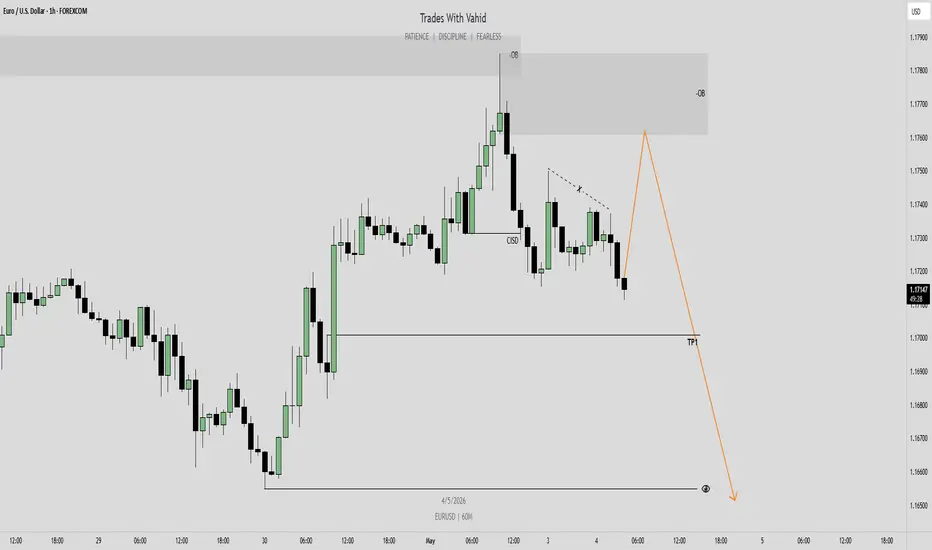
EURUSD 1H — The Story Behind the Bearish ContinuationEURUSD 1H — The Story Behind the Move
The higher timeframe is already leaning bearish, and the story continues the same way here.
Price pushed into a bearish order block and faced a clean rejection.
That reaction wasn’t random — it came with displacement, followed by a clear CISD, showing that s

The best trades require research, then commitment.
Get started for free$0 forever, no credit card needed

Scott "Kidd" PoteetPolaris Dawn astronaut

Where the world does markets
Join 100 million traders and investors taking the future into their own hands.
Nvidia: Triple Confluence?Nvidia rallied to new highs early last week, and now it’s pulled back.
The first pattern on today’s chart is the advance between April 8 (ceasefire with Iran) and April 27. The semiconductor giant held a 50 percent retracement of that move and stabilized, which may confirm its upward direction.
Se

GameStop Targets eBay in $56 Billion Bid. What's That About?Guess who’s looking to rodeo into the e-commerce arena ? In a move that feels like a side quest turning into the main storyline, ya boi, GameStop NYSE:GME , the beloved retail play, has set its sights on eBay NASDAQ:EBAY with a takeover bid worth about $56 billion.
We’re talking the same compa

Walmart reinvents its logistics to compete with AmazonBy Ion Jauregui – Analyst at ActivTrades
Walmart Inc. is intensifying its strategy to compete directly with Amazon.com Inc. in the fast-delivery segment, betting on the conversion of logistics space within its own physical stores. The company has begun trials in Dallas to transform storage areas in

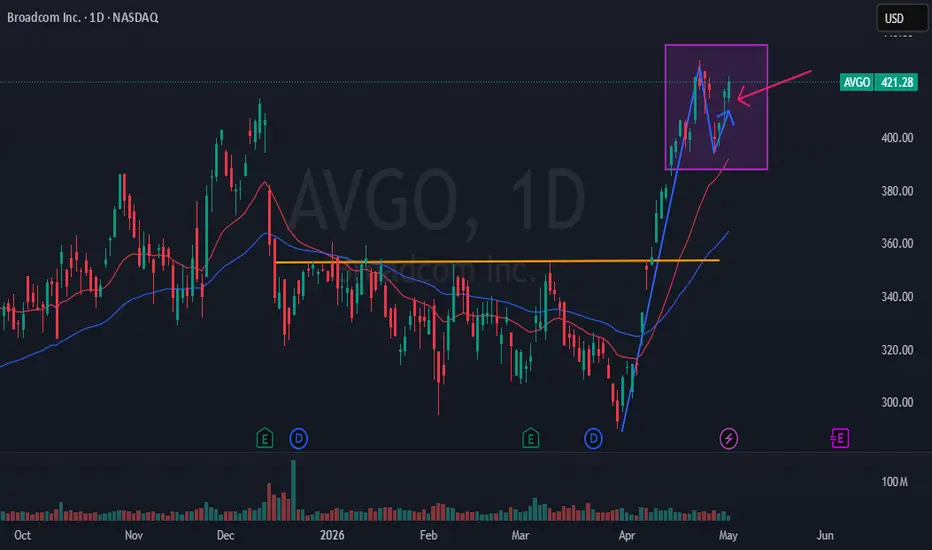
Broadcom (AVGO) Resumes Uptrend After PullbackAVGO is attracting renewed buying interest following a healthy retracement from its recent impulse move. The stock has re-established an uptrend, with price holding firmly above the 20 and 50 moving averages, which remain positively aligned, an indication of sustained bullish momentum. This structur
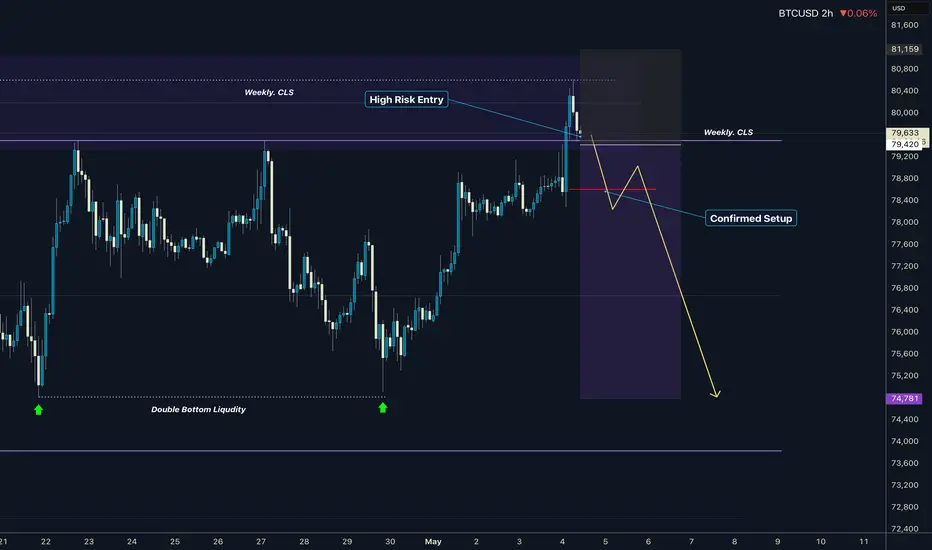
Bitcoin Monthly Structure: Retest in Progress — Is This the LastBitcoin has always been a market that rewards those who zoom out. On the monthly timeframe, the bigger picture becomes crystal clear, and right now it is telling a very important story that every serious trader needs to pay attention to.
The Long Term Structure
Since 2019, Bitcoin has respected

NVIDIA (NVDA) Weekly TF Update: Bear Market or New Uptrend?This week NVDA challenged its all-time high as resistance. It moved above it on a wick followed by a rejection.
The October 2025 ATH sits at 213 on a wick. That same week the close happened at 202.
Last week produced the highest close but not the highest price, 208. That's the 20-April 2026 week.

Alphabet Posts Blowout Earnings as Stock Hits Record. Now What?It’s peak Big Tech earnings season and Alphabet NASDAQ:GOOGL just walked out on stage like it owned the venue. And to be fair, it kind of does.
The tech giant delivered a set of numbers that not only beat expectations but sent the stock rocketing.
Shares jumped about 7% after hours, poised

Oil is set up to go lower but you need to wait for the signalWednesday 29 oil is an expanded market . This is the kind of market that you want to trade because it gives you tremendous reward with relatively small risk if you know how to handle the trade. I explain what you should look for. The beauty of expanding markets is that they are profitable to both

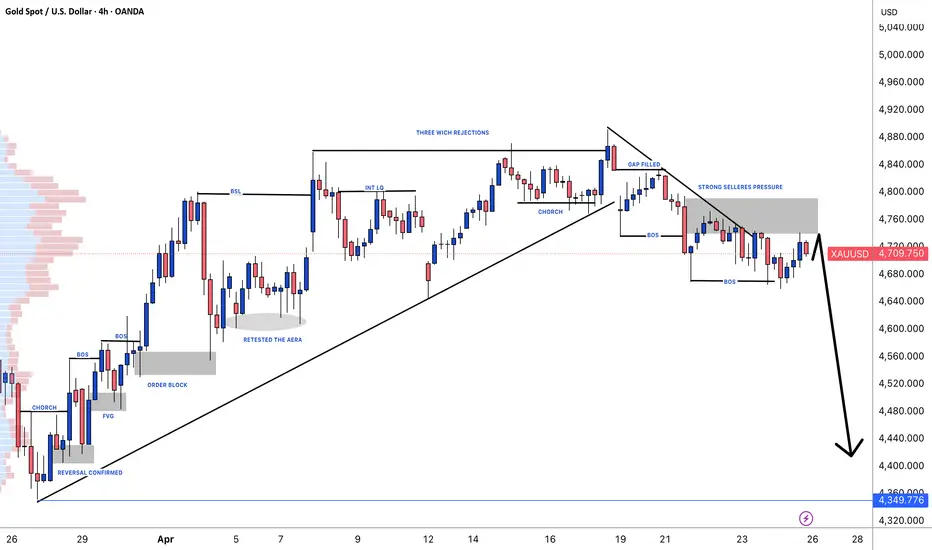
XAUUSD(GOLD): Get Ready For Swing Sell! Trade Is Going To Be BigDear Traders,
As we mentioned in our previous analysis, gold is likely to continue falling. It did just that, but it then bounced back to the entry level. This is due to low market volume on Friday evening. As the week opens, we could see the price start dropping again as the week progresses. Fur
See all editors' picks ideas
NeuraLib: A Native AI and Deep Learning RuntimeNeuraLib is a tensor-based, auto-differentiating Machine Learning runtime built natively for Pine Script™.
It brings real Deep Learning mechanisms that power modern Artificial Intelligence systems into TradingView. Instead of relying on fixed formulas, static regressions, or rigid structures, Neur
Pine Script® library

Pine3D: A Native 3D Graphical Rendering EnginePine3D is a full 3D rendering engine for TradingView, powered by Pine Script™ v6.
Pine3D pushes forward the frontier of TradingView 3D rendering capabilities, providing a fully fledged graphical engine under an intuitive, chainable, object oriented API. Build meshes, transform them in world space,
Pine Script® library

TASC 2026.05 The AutoTune Filter█ OVERVIEW
This script implements the AutoTune Filter described by John F. Ehlers in the article "A Rolling Autocorrelation Function" from the May 2026 edition of the TASC Traders' Tips . The script analyzes rolling autocorrelation in filtered price data to calculate a band-pass filter that dyn
Pine Script® indicator

Smart Trader, Episode 06, Isotropic Trend Lines🔷 WHAT IS ST-EP06 — ISOTROPIC TREND LINES?
ST-EP06 is a multi-scale structural trend channel indicator built on a σ-normalized coordinate system. It is designed to solve one of the oldest unaddressed problems in technical analysis:
trend angles that cannot be compared across instruments, timef
Pine Script® indicator

AI Predictive Flow (Zeiierman)█ Overview
AI Predictive Flow (Zeiierman) is a pattern-based oscillator that estimates future price direction by comparing the current market state to similar historical conditions.
Instead of relying on traditional indicators like momentum or moving averages alone, the script builds a multi-fe
Pine Script® indicator

Focus Bars [Kioseff Trading]Hello Traders!
🔹 Focus Bars
Focus Bars is a lower-timeframe reconstruction tool designed to break each candle into a price-based internal structure .
Instead of viewing a bar as a single OHLC print, this tool redistributes intrabar participation across price levels, showing where activity, del
Pine Script® indicator

Carrier Volatility [Pumori]Carrier Volatility
This is the foundational Pulse component of the ET Massif Framework research suite.
Description
Pumori is a high-resolution volatility and impulse response tool built around an ultra-short fractional length (0.1 EMA). It is a high-frequency carrier framework that exposes the
Pine Script® indicator

Multi Timeframe Volume Profiles [TradingIQ]Hello Traders!
🔹 Multi-Timeframe Volume Profiles
Multi-Timeframe Volume Profiles is a visualization tool designed to show how volume and participation develop across multiple timeframes - all in one view.
Instead of switching between charts and trying to mentally piece together context, this to
Pine Script® indicator

CVD Profiles [TradingIQ]Hello Traders!
🔹 CVD Profiles
CVD Profiles is a profile-based order flow visualization tool designed to show how participation distributes across price levels - not just over time, but through price itself .
Think volume profile data + TPO time segmenting!
Instead of looking at cumulative delt
Pine Script® indicator

Volume Bubbles [QuantAlgo]🟢 Overview
The Volume Bubbles indicator is a multi-layered volume cluster detection system that identifies statistically significant volume events directly on your price chart, classifying them by magnitude (Small, Medium, Big) and direction (Buy, Sell, Mixed). By combining adaptive percentile t
Pine Script® indicator

See all indicators and strategies
Community trends
GameStop Targets eBay in $56 Billion Bid. What's That About?Guess who’s looking to rodeo into the e-commerce arena ? In a move that feels like a side quest turning into the main storyline, ya boi, GameStop NYSE:GME , the beloved retail play, has set its sights on eBay NASDAQ:EBAY with a takeover bid worth about $56 billion.
We’re talking the same compa
Nvidia: Triple Confluence?Nvidia rallied to new highs early last week, and now it’s pulled back.
The first pattern on today’s chart is the advance between April 8 (ceasefire with Iran) and April 27. The semiconductor giant held a 50 percent retracement of that move and stabilized, which may confirm its upward direction.
Se
AMD Hit an All-Time High Ahead of Earnings. What Its Chart SaysAdvanced Micro Devices NASDAQ:AMD is set to release earnings this week at a time when the chip giant recently hit an all-time high -- up more than 60% year to date and better than 260% over 12 months. Let's see what its fundamental and technical analysis say.
AMD's Fundamental Analysis
The chi

Amd - This stock still remains bullish!🔥Amd ( NASDAQ:AMD ) is still just heading higher:
🔎Analysis summary:
The underlying trend of Amd is still clearly towards the upside. And looking at the higher timeframe, Amd could just create another all time high break and retest very soon. But after this strong rally, it is not a bad idea

Amazon I Moderate Buy with Upside Around +10%Welcome back! Let me know your thoughts in the comments!
** Amazon Analysis - Listen to video!
We recommend that you keep this on your watch list and enter when the entry criteria of your strategy is met.
Please support this idea with a LIKE and COMMENT if you find it useful and Click "Follow" on

Datavault AI Inc. (DVLT)Stock on Buying signal triggering Up any moment 💥
A formation of Wolfe wave pattern formed.
1st Target price initially between 1.51$ - 1.65$
2nd Target price = 3.00$
3rd Target price = 4.00$ with Good News.

ARM: Massive Bull-Flag-Formation Setup, Targets Active!Hello There,
welcome to my new analysis about ARM (Arm Holdings plc) on the weekly timeframe perspective. In the past, I have spotted interesting stocks in the market that are likely to lead to strong trading opportunities. As I am following a total return trading approach, with both long and shor

SNDK Post-Earnings Breakout LevelsSandisk came out of earnings strong beat, raised guidance, and pushed into new all-time highs.
Daily closed with a 2-2-3u bullish engulfing, so momentum is clearly there. Now it’s about whether continuation shows up or we get a pullback into inefficiency.
Above $1,190 opens continuation toward $1,

GOOGLE massive rally approaching 12-year Top. Will it reverse?Google (GOOG) has been trading within a 12-year Channel Up since its IPO and April's massive rally has brought it the closest it's been to this pattern's Top (Higher Highs trend-line) since November 2021.
That was the Top that kick-started the 2022 Bear Cycle, which declined by almost -45%, bottomi

$NVO Despite expectations, Wegovy may retain its lead longerNYSE:NVO , "Early data indicates the opposite,” says SB1 Markets analyst Johan Unnerus, as Novo Nordisk’s oral Wegovy gains traction while Eli Lilly’s Foundayo NYSE:LLY sees slower uptake.
Despite expectations, oral Wegovy may retain its lead longer than expected, reinforcing Novo’s strong posit

See all stocks ideas
Today
GRABGrab Holdings Limited
Actual
−0.01
USD
Estimate
0.02
USD
Today
OCSLOaktree Specialty Lending Corporation
Actual
—
Estimate
0.37
USD
Today
ECVTEcovyst Inc.
Actual
—
Estimate
0.05
USD
Today
BALLBall Corporation
Actual
—
Estimate
0.85
USD
Today
HSICHenry Schein, Inc.
Actual
—
Estimate
1.22
USD
Today
ADMArcher-Daniels-Midland Company
Actual
—
Estimate
0.64
USD
Today
IARTIntegra LifeSciences Holdings Corporation
Actual
—
Estimate
0.40
USD
Today
ITGartner, Inc.
Actual
—
Estimate
2.92
USD
See more events
Community trends
Bitcoin Monthly / Weekly CLS - Key Levels from PremiumHi Friends, New CLS Range has been created and Im looking for Short Model 1 trade setup. As always after the manipulation in to the Key Level, above the CLS range and reaction, we need to see a confirmation switch from the manipulation phase - CIOD (change in order flow) in the the expansion.
⏳
BTC at 80K… This Move Will Decide EverythingBTC is right at a crucial area, and this is something you really want to keep an eye on. Price is testing a key resistance zone around the 80K region, which has already acted as a strong level in the past.
Now here’s the important part, a clean daily close above this area would weaken the bearish m

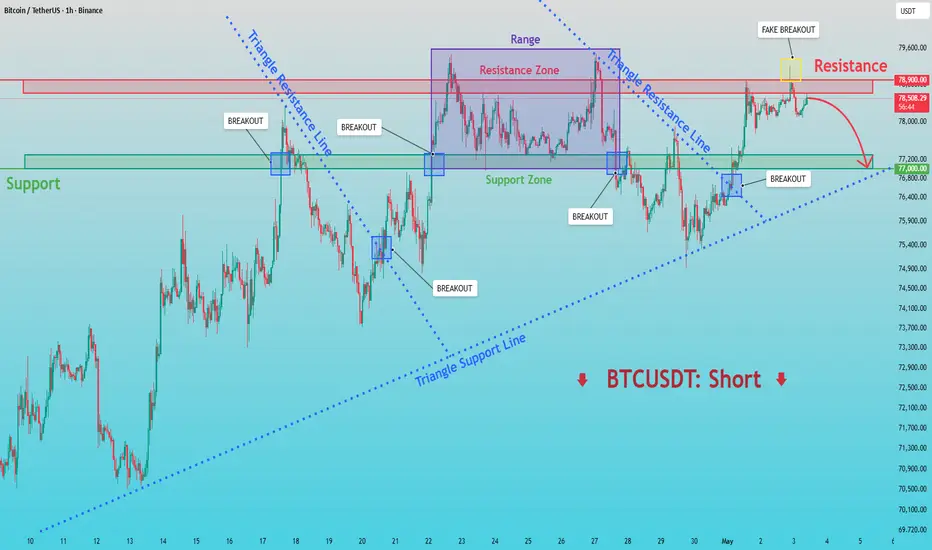
BTCUSDT: Rejection at 78,9K Signals Possible Pullback Toward 77KHello everyone, here is my breakdown of the current BTCUSDT setup.
Market Analysis
BTCUSDT previously traded within a range. After a brief upside move, price faced strong rejection near the 78,900 resistance zone, forming a fake breakout and signaling selling pressure.
Currently, BTCUSDT is trad
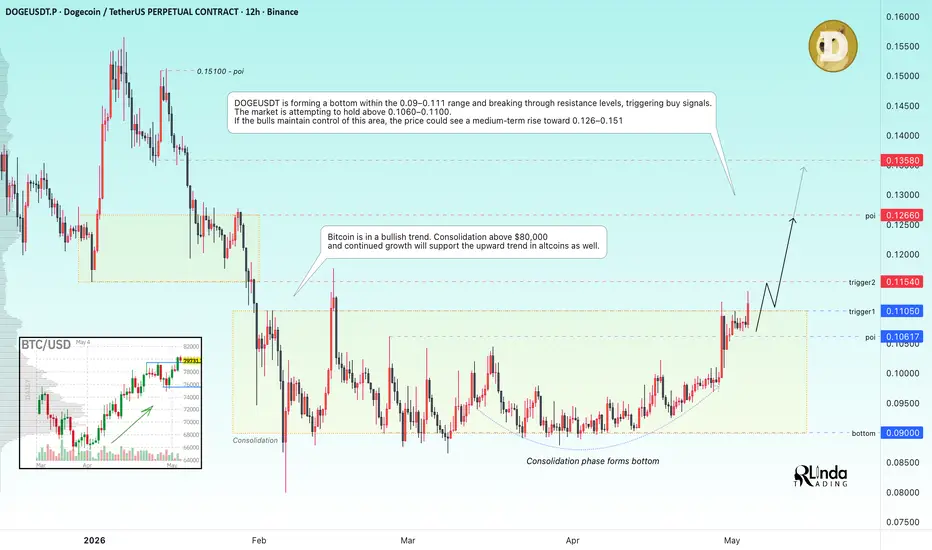
DOGEUSDT - The consolidation is forming a global bottom BINANCE:DOGEUSDT is forming a bottom at 0.09–0.10. The market is entering an intermediate rally phase and preparing for further growth...
Bitcoin is in a bullish trend. Consolidation above 80K and continued growth will support the growth phase in altcoins as well.
DOGEUSDT is forming a bottom
BTCUSDTHello Traders! 👋
What are your thoughts on Bitcoin ?
Bitcoin, after its recent sharp decline, has entered a corrective ascending channel and is now testing a major supply zone—an area where multiple key technical factors are converging.
This resistance zone marks a level where price has previously

BTC/USDT: Inverse Head & Shoulders Confirms the BreakoutHi!
The Structural Shift
The most important development here is that "the strongest resistance line is broken." This level has suppressed price action for weeks, but the bulls have finally cleared it with conviction.
Inverse Head & Shoulders: The formation of this reversal pattern (Left Should

BTCUSD: Triangle and Bull-Flag Completed, Targets Activated!Hello There,
welcome to my new and updated analysis about BTCUSD on the 4-hour timeframe perspective. The recently developed strong bullish momentum shows a major shift in this whole trading range. As I mentioned in previous ideas, BTCUSD developed the setup for a substantial range breakout, which

Bitcoin Monthly Structure: Retest in Progress — Is This the LastBitcoin has always been a market that rewards those who zoom out. On the monthly timeframe, the bigger picture becomes crystal clear, and right now it is telling a very important story that every serious trader needs to pay attention to.
The Long Term Structure
Since 2019, Bitcoin has respected
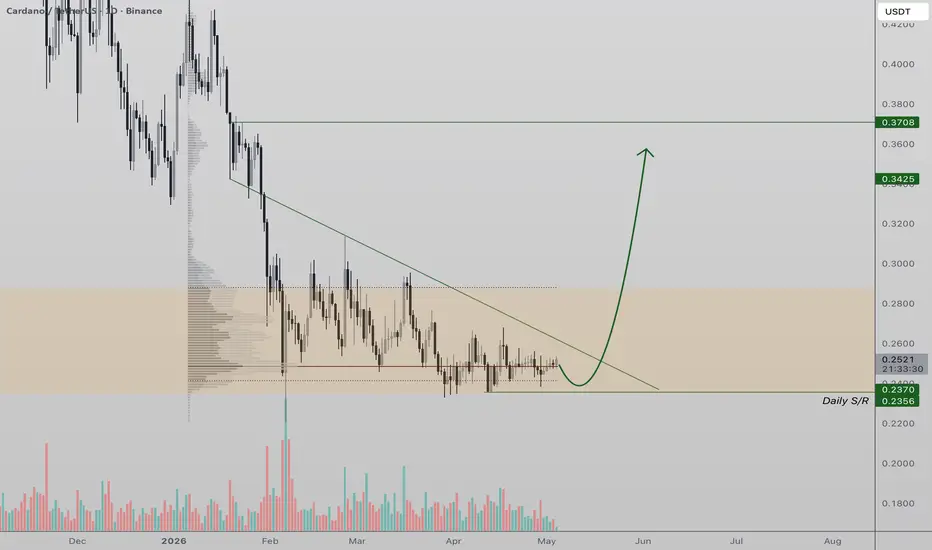
Cardano (ADA) Compression at Apex — Breakout ImminentCardano price action is currently trading within a clear apex structure, where tightening price movement signals that a breakout is approaching. This compression zone is formed by a descending dynamic resistance and a well-defined horizontal support, creating a key area of inflection.
- Apex Format
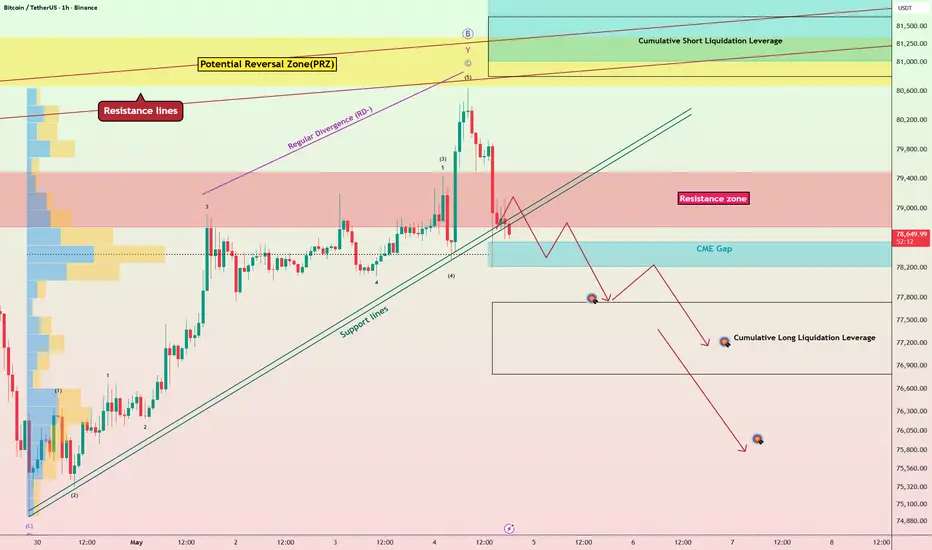
Bitcoin Lost Momentum Near PRZ — Is a Deeper Drop Coming?Over the weekend, Bitcoin ( BINANCE:BTCUSDT ) extended its bullish run from last week, gaining over +3% and climbing close to the resistance lines and the Potential Reversal Zone(PRZ) . However, with the start of the new week—especially as tensions escalated in the Middle East—Bitcoin, like the S&
See all crypto ideas
XAUUSD – Bearish Rejection Setup📊 XAUUSD – Bearish Rejection Setup
🔍 Market Overview
Gold is currently facing strong selling pressure after failing to sustain above a key resistance zone aligned with a descending trendline. The repeated rejection from this area highlights the presence of sellers and confirms a continuation of th

GOLD(XAUUSD): Bearish Dominance Has Not Yet FinishedDear traders,
Gold has reversed from the $4510 zone and moved upwards of the $4663 zone. This area experienced strong selling pressure and needed to be filled. Given the recent strong rejection, we can now look for a sell in the week starting tomorrow. First, observe how the price moves in the A

XAUUSDHello Traders! 👋
What are your thoughts on Gold?
Gold has entered a key decision zone where multiple technical factors are aligning, suggesting a potential shift in momentum.
Bearish Structure Still Dominant
Price continues to trade below a well-defined descending trendline, keeping the broader

Gold Rebound Setup: Long Scenario from Key Support To 4,700 TP1Hello traders! Here is my technical outlook based on the current XAUUSD (2H) chart structure. Gold previously moved within an ascending structure, forming higher lows before facing strong resistance and reversing direction. After the rejection, price broke below the trend support and shifted into a

Gold Rebounds from 4500: Bullish Structure EmergingGold Rebounds from 4500: Bullish Structure Emerging
After gold fell near 4500, it seems that the bottom has been reached at this point.
The price started to react and rose to 4660. It seems that gold has started an upward price development again.
We may be in an expanding bullish pattern at this

Trendline Support Holding – Bullish Continuation SetupPrice is forming a short-term bullish structure with higher lows supported by an ascending trendline. After a strong impulsive move, price tapped into a key resistance zone (~4,640 – 4,650) and faced rejection.
Current pullback is expected to retest the trendline support (~4,580 – 4,600), where buy

XAU/USD | Depends on the Strait reopening!As you can see in the 4H chart of Gold, after the news came out that IRGC has launched missiles towards us Frigates, Gold suddenly dropped massively from 4600 all the way to 4526 level! But then in bounced back up from the Demand Zone, currently being traded at 4566.
I'd like to see Gold go for the

XAUUSD: Triangle Compression Points to Possible BreakdownHello everyone, here is my breakdown of the current XAUUSD setup.
Market Analysis
Gold previously traded within a range, showing consolidation before breaking down and confirming bearish momentum. After the breakdown, price attempted to recover but faced strong rejection near the 4,650 resistance

Gold’s Path to $4,400🏦 THE STRATEGY VAULT
Technical Checkpoint ✅
The Macro Structure: Gold is currently trapped in a large descending broadening formation. While the early 2026 parabolic run to $5,600 is a distant memory, the current price action confirms we are in a deep "Value Reset" phase.
The Triangle Break: Price

XAU/USD Eyes Fresh Highs on Bullish Continuation🚀 XAU/USD is showing strong bullish recovery after breaking out from the descending channel pattern on the 45-minute timeframe. 📈 Strong buying momentum returned after price reacted perfectly from the lower support zone, while the breakout above the trendline confirms bullish continuation toward hig

See all futures ideas
SELL GBP/USD - Wedge Breakout (04.05.2026)GBP/USD is showing a potential wedge breakout pattern after price failed to hold inside the rising wedge structure. The pair rejected from the upper resistance zone and is now showing weakness near the broken trendline area. FX:GBPUSD
Support & Resistance
Resistance Zone:
The key resistance

EUR/USD: Move Down After Liquidity Grab?!The 📉EURUSD price tested a significant daily/intraday resistance last week.
After a liquidity sweep above this level, the market formed a bearish imbalance candle, followed by an intraday CHoCH.
It is anticipated that the pair may experience further decline, potentially reaching the 1.1685 level.

EURUSD Approaches 1.1680 Support as Bearish Momentum GrowsHello traders! Here is my technical outlook based on the current EURUSD (1H) chart structure. EURUSD previously traded within a range, consolidating before breaking out to the upside and establishing a short-term bullish phase. After the breakout, price moved into a broader structure and started int

EURUSD: Descending Triangle Formed, Bullish Breakout Incoming!Hello There,
welcome to my new analysis about EURUSD from a 30-minute timeframe perspective. In recent times, I have detected a highly interesting setup with EURUSD, which has a high potential to transform into a determined breakout pattern. The established bullishness should not be underestimated

NZDUSD Range Top Holds Strong, Sellers Step InNZDUSD Range Top Holds Strong, Sellers Step In
NZDUSD is showing repeated rejection from a strong resistance zone around 0.5920, confirming this area as a key supply level.
Price has tested this zone multiple times and failed to break higher, suggesting weakening bullish momentum.
Following the

“GBPUSD Ready to Drop – Bearish Setup in Play GBPUSD is showing a clear bearish setup after rejecting from a key resistance zone and breaking out of consolidation. Price has entered a downward structure with lower highs forming, supported by Ichimoku resistance overhead.
The marked range zone previously acted as accumulation, and now we’re seei

USDJPY Price Update – Clean & Clear ExplanationUSD/JPY on the 4H timeframe was previously moving in a range, respecting resistance around 159.50–160.00 and support near 157.80. Price was also following an ascending trendline, showing short-term bullish strength. However, the market failed to sustain above the resistance zone and formed a strong

EURUSD 1H — The Story Behind the Bearish ContinuationEURUSD 1H — The Story Behind the Move
The higher timeframe is already leaning bearish, and the story continues the same way here.
Price pushed into a bearish order block and faced a clean rejection.
That reaction wasn’t random — it came with displacement, followed by a clear CISD, showing that s
EURUSD Short: Descending Channel Holds Strong, Eyes On 1.1680Hello traders! Here’s my technical outlook based on the current EURUSD (3H) chart structure. EURUSD previously traded below a descending supply line. After a breakout above this structure, price entered a short consolidation phase (range), but the upside momentum was limited.
Currently, EURUSD is t

GBP/USD Bearish Targets Now in Focus📉 GBP/USD is showing strong bearish rejection after failing multiple times at the major resistance zone near 1.3570. ⚠️ Sellers stepped in aggressively from the upper supply area, confirming weakening bullish momentum on the 2-hour timeframe. 🔥 Price has also broken below the rising trendline suppor

See all forex ideas
Trade directly on Supercharts through our supported, fully-verified, and user-reviewed brokers.


