Market Panic: Gold or Crypto?When the market enters a state of panic, the question is no longer “How much profit can I make?” but rather “Which asset helps me survive and protect my capital?”
In moments like these, gold and crypto are often placed side by side. Both are seen as safe havens—but in very different ways, and that difference is the key to making the right decision.
1) Gold – Where Capital Flows When Confidence Breaks
Gold has existed for thousands of years with one core purpose: preserving value.
When inflation rises, geopolitical tensions escalate, or the financial system shows signs of stress, large capital tends to move into gold first.
Why gold performs well during crises:
High global liquidity, accepted across all markets
Relatively “orderly” volatility, suitable for defensive positioning
Often benefits when real interest rates fall and the USD weakens
In other words, gold won’t make you rich overnight, but it helps you avoid being washed away when the storm hits.
2) Crypto – An Asset Driven by Expectations and Emotion
Crypto represents a new generation of assets, where value is heavily influenced by future expectations, technology narratives, and speculative capital.
In normal or euphoric market conditions, crypto can rise very quickly.
But when panic sets in, the story changes.
Here’s the reality we need to face:
Crypto reacts extremely sensitively to “risk-off” sentiment
High leverage + thin liquidity during stress periods can trigger chain liquidations
In major shocks, crypto is often sold alongside growth stocks, rather than acting as a true safe haven
Therefore, crypto is not a defensive asset in the traditional sense—it is an asset of belief and market cycles.
3) When Should You Choose Gold? When Should You Hold Crypto?
The answer is not “which is better,” but what the market context is.
True panic (systemic risk, war, financial crisis):
➡ Gold is usually the preferred choice.
Capital seeks certainty, not stories.
Short-term crisis followed by monetary easing:
➡ Gold often leads the first wave,
➡ Crypto tends to recover more aggressively after a psychological bottom forms.
Stable markets with abundant liquidity:
➡ Crypto performs at its best.
4) My Perspective: Don’t Choose with Emotion
From my experience, the biggest mistake traders make during panic is choosing assets based on personal belief instead of capital flow and market behavior.
A professional trader asks:
Where is large capital taking refuge?
Is current volatility suitable for my trading style?
Is my goal capital preservation or outsized returns?
If your priority is safety and stability, gold is usually the more reasonable choice.
If you accept high risk in pursuit of high reward, crypto should only be approached after clear confirmation, not during extreme panic.
Harmonic Patterns

Key Levels – Where Gold Reacts, Not Indicators?Many traders start trading gold using indicators, and that’s something almost everyone goes through. However, the longer you stay in the market, the more clearly you realize one important truth: gold does not react to indicators; it reacts at key levels . Indicators only describe what price has already done, while key levels are where real money actually makes decisions.
Price does not move randomly. It reacts at important price zones.
Key levels are areas where the market has shown clear reactions in the past — strong reversals, repeated rejections, or consolidation before a breakout. In gold trading, these zones often align with major highs and lows, round numbers, or areas of concentrated liquidity.
This is where both retail traders and large capital are paying attention.
One major reason many traders consistently enter too late is over-reliance on indicators. Indicators are always based on past price data, so when a signal appears, the key reaction has often already happened. At that point, entries are less attractive, risk-to-reward deteriorates, and the probability of false breaks or stop hunts increases.
Indicators are not wrong, but they always lag behind price.
Professional traders don’t try to predict whether price will go up or down. They wait for price to reach a key level and then observe how the market reacts. Is price strongly rejected, or does it break through easily? Is real buying or selling pressure actually showing up?
Key levels are not places to predict — they are places to observe and react.
This doesn’t mean indicators are useless. Indicators still have value for momentum confirmation or for understanding market context. But they should not be the primary factor for making entry decisions.
Key levels tell you where to trade.
Indicators only help you understand how price is behaving.
Conclusion
If you are trading gold and still searching for the “best indicator for XAUUSD,” you may be asking the wrong question.
The better question is:
Which key level is the market respecting right now?
Because in the end, price reacts at levels — not at indicators.
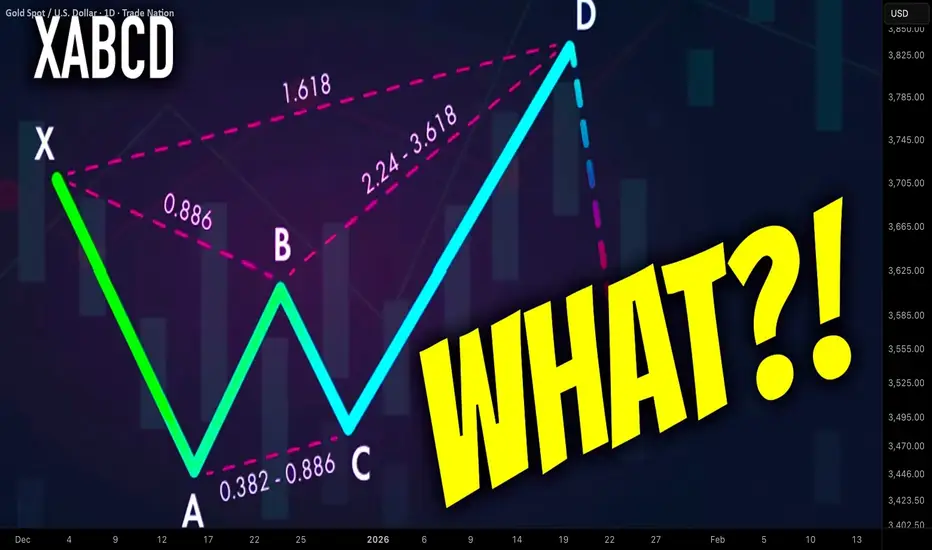
What is Harmonic XABCD Pattern and How to Identify It Easily
In the today's article, we will discuss the absolute basics of harmonic trading: I will explain to you what is harmonic ABCD pattern and how to recognize it, using fibonacci ratios.
The foundation of harmonic trading is impulse leg.
Impulse leg is a strong, directional bullish or bearish movement.
Harmonic traders perceive a price chart like a combination of impulse legs.
Here are the impulse legs on AUDUSD on a daily time frame. All these impulses are significant bullish or bearish movements.
In harmonic pattern trading, the impulse leg will also be called the XA leg.
XABCD pattern is based on 4 consequent price movements.
XA leg will be a fundamental component of each harmonic XABCD pattern and the first price movement within the pattern.
The direction of the XA leg will determine the bias of the pattern:
Bullish XA will be a foundation of a bullish harmonic pattern,
while, a bearish XA leg will be a foundation for a bearish harmonic pattern.
Above, the examples of a bullish and bearish impulse legs.
After identification of XA leg, a harmonic trader should analyse a consequent price action.
AB leg will be the next movement after a completion of XA leg.
BC leg will be the movement after a completion of AB leg.
CD leg will be the movement after a completion of BC leg.
CD leg will be a completion point of a harmonic pattern.
In a bullish harmonic pattern, a bullish movement will be anticipated from D point.
Above is a structure of a bearish harmonic XABCD pattern.
There are a lot of different types of harmonic XABCD patterns: bullish/bearish Gartley, Bat, Cypher, etc...
The type of the pattern will depend on the fibonacci ratios of B, C, D points of the pattern.
B, C, D points should have very specific ratios to make a pattern harmonic.
First, a harmonic trader should measure the fibonacci retracement level of B point in XA leg.
In the example below, B point is lying between 618 and 786 retracements of XA leg.
Then, if a C point is lying beyond the range of the XA impulse, one should measure its fibonacci extension level.
If a C is lying within XA, its retracement level should be measured.
Below, we can see that C point of the pattern is lying between 618 and 786 retracements of AB.
Depending on the type of the pattern, a D point will either be based on a certain fibonacci retracement of XA leg or extension of AB leg.
In our example, the criteria for a bullish harmonic Gartley pattern are met.
The completion point of the pattern - D point will be based on 786 retracement of XA leg.
From that retracement level, a bullish movement will be anticipated.
Your task as a harmonic trader is to learn the specific rations of each harmonic pattern. With experience, you will learn to identify impulse legs and trade them profitable.
❤️Please, support my work with like, thank you!❤️
I am part of Trade Nation's Influencer program and receive a monthly fee for using their TradingView charts in my analysis.
Quantitative Algorithmic Trading in the Global MarketData-Driven Strategies for Modern Finance
Quantitative algorithmic trading, often called quant trading, represents the convergence of finance, mathematics, statistics, and computer science. In the global market—spanning equities, commodities, forex, fixed income, and derivatives—quantitative trading has transformed how capital is deployed, risks are managed, and opportunities are identified. Instead of relying on intuition or discretionary decision-making, quant trading uses data-driven models and automated algorithms to execute trades with speed, precision, and discipline across international markets.
Understanding Quantitative Algorithmic Trading
At its core, quantitative algorithmic trading involves creating mathematical models that identify trading opportunities based on historical and real-time data. These models are translated into algorithms that automatically place buy or sell orders when predefined conditions are met. The trader’s role shifts from manual execution to designing, testing, and refining strategies.
In global markets, quant trading operates across multiple exchanges, time zones, and asset classes. This global reach allows algorithms to exploit inefficiencies arising from market fragmentation, differing regulations, currency fluctuations, and regional economic cycles.
Evolution of Quant Trading in Global Markets
Quantitative trading began with simple statistical arbitrage strategies in developed markets such as the United States and Europe. Over time, advances in computing power, access to large datasets, and the growth of electronic exchanges expanded its scope. Today, quant trading dominates volumes in major global markets, particularly in equities and foreign exchange.
Emerging markets have also seen rapid adoption as infrastructure improves and liquidity deepens. Global hedge funds, proprietary trading firms, and institutional investors deploy algorithms that operate 24 hours a day, adapting to market conditions in Asia, Europe, and the Americas.
Key Components of a Quant Trading System
A successful quantitative trading system typically consists of several interconnected components. First is data acquisition, which includes price data, volume, order book information, macroeconomic indicators, corporate fundamentals, and alternative data such as news sentiment or satellite data. In global markets, handling data from multiple sources and ensuring consistency across regions is a major challenge.
Second is model development, where statistical techniques, machine learning, or econometric models are used to identify patterns and predict price movements. These models are backtested using historical data to evaluate performance under different market conditions.
Third is execution logic, which determines how trades are placed to minimize costs such as slippage and market impact. In global markets, execution algorithms must account for varying liquidity, trading hours, and regulatory constraints.
Finally, risk management is embedded into the system to control exposure, limit drawdowns, and ensure capital preservation across volatile global environments.
Types of Quantitative Trading Strategies
Quantitative strategies in global markets can be broadly classified into several categories. Statistical arbitrage strategies exploit pricing inefficiencies between related instruments, such as pairs trading across international exchanges or ADRs versus local shares.
Trend-following strategies identify and ride sustained price movements across global asset classes. These strategies are popular in futures and forex markets, where macroeconomic trends often play out over long periods.
Mean-reversion strategies assume that prices revert to historical averages. These are commonly used in equity markets and volatility trading.
High-frequency trading (HFT) focuses on extremely short time frames, using speed and micro-price movements to generate profits. While controversial, HFT plays a significant role in global market liquidity.
Machine learning-based strategies use advanced algorithms to detect complex, nonlinear relationships in data. These approaches are increasingly popular as data availability and computing power expand.
Advantages of Quant Trading in Global Markets
One of the biggest advantages of quantitative algorithmic trading is objectivity. Decisions are based on data and rules, reducing emotional bias. This is particularly important in global markets, where geopolitical events, policy decisions, and sudden shocks can trigger extreme volatility.
Another key benefit is scalability. Algorithms can simultaneously monitor and trade hundreds of instruments across multiple countries, something impossible for manual traders. This allows firms to diversify strategies and reduce dependence on a single market.
Speed and efficiency are also critical advantages. Automated systems can react to market changes in milliseconds, capturing opportunities before they disappear. In global markets with overlapping trading sessions, this speed is a competitive edge.
Challenges and Risks
Despite its advantages, quantitative trading faces significant challenges. Model risk is a major concern—strategies that perform well in historical tests may fail in live markets due to changing conditions. Global markets add complexity due to differing regulations, political risks, and currency exposure.
Data quality and availability can also be problematic, especially in emerging markets where historical data may be limited or unreliable. Poor data can lead to flawed models and unexpected losses.
Technology and infrastructure risk is another factor. System failures, latency issues, or cyber threats can disrupt trading operations, potentially leading to large losses.
Regulation and Ethical Considerations
Global regulators closely monitor algorithmic trading due to its impact on market stability. Different countries impose varying rules on order types, position limits, and reporting requirements. Quant traders operating globally must ensure compliance with multiple regulatory frameworks.
Ethical considerations also arise, particularly around market fairness and transparency. Responsible quant trading emphasizes liquidity provision and risk control rather than exploitative practices.
The Future of Quantitative Algorithmic Trading
The future of quant trading in global markets is closely tied to technological innovation. Artificial intelligence, alternative data, and cloud computing are reshaping how strategies are developed and deployed. As markets become more interconnected, cross-asset and cross-border strategies will gain importance.
At the same time, competition is intensifying. Alpha is becoming harder to find, pushing quants to focus on better risk management, execution efficiency, and innovation rather than pure prediction.
Conclusion
Quantitative algorithmic trading has become a cornerstone of modern global financial markets. By leveraging data, technology, and systematic processes, it enables traders and institutions to operate efficiently across borders and asset classes. While challenges such as model risk, regulation, and market complexity remain, the disciplined and scalable nature of quant trading ensures its continued dominance in the global market landscape.
Cybersecurity Risks in the Global Trading SystemThreats, Vulnerabilities, and Strategic Defenses
In today’s highly interconnected world, the global trading system relies heavily on digital infrastructure. From stock exchanges and commodity markets to forex platforms and cross-border payment systems, technology is the backbone of modern trade. While digitization has improved speed, efficiency, and accessibility, it has also exposed global markets to significant cybersecurity risks. Cyber threats now pose one of the most critical non-financial risks to the stability, trust, and integrity of global trading systems.
Understanding the Global Trading System’s Digital Dependency
The global trading system includes stock exchanges, clearing corporations, depositories, brokerage firms, banks, commodity exchanges, logistics networks, and regulatory systems. These entities are interconnected through real-time data feeds, cloud services, APIs, and payment networks such as SWIFT. Even a minor cyber incident in one node can trigger a cascading effect across global markets.
High-frequency trading (HFT), algorithmic trading, and automated settlement systems depend on uninterrupted data flow and low latency. This dependency makes the system extremely sensitive to cyber disruptions, where milliseconds of delay or data manipulation can result in massive financial losses.
Major Cybersecurity Risks in Global Trading Systems
1. Data Breaches and Information Theft
One of the most common cybersecurity risks is data breaches. Trading platforms store sensitive information such as client identities, bank details, trade positions, proprietary algorithms, and market strategies. A successful breach can lead to insider trading, front-running, identity theft, and financial fraud.
State-sponsored hackers and cybercriminal groups often target financial institutions to steal market-sensitive data, which can be exploited for unfair trading advantages or sold on the dark web.
2. Market Manipulation Through Cyber Attacks
Cyber attackers can manipulate markets by altering data feeds, hacking trading algorithms, or spreading false information. For example, compromising a price feed can trigger automated buy or sell orders, leading to artificial volatility or flash crashes.
In algorithm-driven markets, even small distortions in data can cause massive ripple effects. Attackers may exploit vulnerabilities to manipulate liquidity, inflate volumes, or disrupt price discovery mechanisms.
3. Distributed Denial of Service (DDoS) Attacks
DDoS attacks flood trading platforms or exchanges with traffic, making systems unavailable to legitimate users. During critical market hours, such attacks can halt trading, delay order execution, or prevent access to risk management systems.
DDoS attacks are often used strategically during geopolitical tensions, economic announcements, or high-volatility events to destabilize markets or undermine confidence in financial institutions.
4. Ransomware Attacks on Financial Infrastructure
Ransomware attacks have become increasingly sophisticated. Hackers encrypt critical trading and settlement systems and demand ransom payments to restore access. If clearing and settlement systems are compromised, it can delay trade confirmations, margin calculations, and fund transfers.
Such attacks not only cause financial losses but also damage reputations and erode investor trust in the reliability of global trading systems.
Systemic Risk and Cascading Failures
Cybersecurity risks in global trading systems are not isolated threats—they represent systemic risk. A successful cyberattack on a major exchange, clearing house, or payment network can disrupt multiple markets simultaneously.
For example:
A compromised clearing corporation can delay settlements across thousands of trades.
A hacked forex trading platform can affect currency stability.
A cyberattack on a major bank can freeze liquidity across regions.
These cascading failures can amplify market panic, trigger margin calls, and even lead to broader financial instability.
Geopolitical and State-Sponsored Cyber Threats
Cybersecurity has become a tool of geopolitical conflict. Nation-states increasingly use cyber warfare to target financial infrastructure of rival economies. Global trading systems are prime targets because disrupting financial markets can weaken economic stability without direct military confrontation.
State-sponsored cyberattacks may aim to:
Undermine confidence in a country’s financial markets
Steal economic intelligence
Disrupt trade during sanctions or conflicts
Manipulate commodity or currency markets
This elevates cybersecurity from an IT issue to a matter of national and global economic security.
Third-Party and Supply Chain Vulnerabilities
Global trading systems rely on third-party vendors for cloud services, data analytics, trading software, and connectivity. A vulnerability in any third-party provider can expose multiple institutions simultaneously.
Supply chain attacks—where hackers infiltrate a trusted vendor to access clients—are particularly dangerous. Since vendors often have privileged system access, attackers can bypass traditional security controls and remain undetected for long periods.
Human Error and Insider Threats
Despite advanced security technologies, human error remains a major risk factor. Weak passwords, phishing emails, poor access controls, and lack of cybersecurity awareness can open doors to attackers.
Insider threats—whether malicious or accidental—are equally dangerous. Disgruntled employees or compromised insiders can leak sensitive data, sabotage systems, or provide access credentials to attackers.
Regulatory and Compliance Challenges
Global trading systems operate across multiple jurisdictions, each with different cybersecurity regulations and standards. Inconsistent regulatory frameworks create gaps that attackers can exploit.
Additionally, rapid technological innovation often outpaces regulation. New trading technologies such as decentralized finance (DeFi), blockchain-based trading, and AI-driven systems introduce fresh cybersecurity risks that regulators may not fully address yet.
Impact on Market Confidence and Trust
Trust is the foundation of global trading. Cyber incidents erode investor confidence, reduce participation, and increase risk premiums. Repeated cybersecurity failures can push investors away from affected markets and lead to long-term reputational damage for exchanges and financial institutions.
In extreme cases, loss of trust can cause liquidity shortages, capital flight, and prolonged market instability.
Strengthening Cybersecurity in Global Trading Systems
To mitigate cybersecurity risks, a multi-layered and proactive approach is essential:
Advanced Threat Detection: Use AI and machine learning to identify abnormal trading behavior and cyber intrusions in real time.
Zero-Trust Architecture: Assume no system or user is automatically trusted; verify every access request.
Regular Stress Testing: Conduct cyber stress tests and simulations to assess resilience against large-scale attacks.
Encryption and Data Protection: Secure data at rest and in transit using strong cryptographic standards.
Employee Training: Build cybersecurity awareness to reduce phishing and social engineering risks.
Global Coordination: Regulators, exchanges, and financial institutions must share threat intelligence and coordinate responses to cyber incidents.
Conclusion
Cybersecurity risks in the global trading system represent one of the most significant challenges to modern financial markets. As trading becomes faster, more automated, and more interconnected, the potential impact of cyber threats grows exponentially. These risks go beyond financial losses, threatening market integrity, systemic stability, and global economic trust.
Addressing cybersecurity is no longer optional—it is a strategic imperative. Only through continuous investment in technology, strong governance, international cooperation, and a culture of cyber resilience can the global trading system remain secure, stable, and trustworthy in an increasingly digital world.

Understanding Currency ConvertibilityWhat is Currency Convertibility?
Currency convertibility refers to the ease with which a country’s currency can be converted into foreign currencies without restrictions imposed by the government or central bank. When a currency is fully convertible, individuals, businesses, and investors can freely exchange it for another currency for any purpose—trade, travel, investment, or capital transfers.
For example, if an Indian exporter earns US dollars, currency convertibility determines whether and how easily those dollars can be converted into Indian rupees or reinvested abroad. Similarly, foreign investors assess convertibility before investing, as it affects their ability to repatriate profits and capital.
Why Currency Convertibility Matters
Currency convertibility is not just a technical financial concept; it has broad economic implications:
Facilitates International Trade
Convertibility allows exporters and importers to settle cross-border transactions smoothly, reducing friction in global trade.
Encourages Foreign Investment
Investors prefer countries where profits and capital can be freely repatriated, making convertible currencies more attractive.
Integrates Economies Globally
Convertibility helps integrate domestic financial markets with global markets, improving efficiency and competitiveness.
Signals Economic Confidence
A convertible currency often reflects confidence in a country’s economic fundamentals and monetary stability.
Types of Currency Convertibility
Currency convertibility is broadly classified into three main types:
1. Current Account Convertibility
This allows free exchange of currency for transactions related to trade in goods and services, remittances, interest payments, and tourism. Most countries, including India, have current account convertibility.
Example:
An Indian student paying tuition fees abroad or an exporter receiving payment in foreign currency falls under current account transactions.
2. Capital Account Convertibility
Capital account convertibility permits free movement of capital across borders for investments such as foreign direct investment (FDI), portfolio investment, real estate purchases, and loans.
This form is more sensitive because unrestricted capital flows can expose economies to volatility. Hence, many developing nations impose partial controls.
Example:
An Indian investor buying foreign stocks without limits would require full capital account convertibility.
3. Full Convertibility
A currency is fully convertible when both current and capital account transactions are unrestricted. Major global currencies like the US Dollar, Euro, British Pound, and Japanese Yen are fully convertible.
Partial vs Full Convertibility
Many emerging economies adopt partial convertibility as a balanced approach. Under this system:
Trade and service-related transactions are liberalized.
Capital flows are regulated through limits, approvals, or sector-specific controls.
This allows countries to enjoy the benefits of globalization while safeguarding against sudden capital flight and financial instability.
Advantages of Currency Convertibility
Boosts Trade and Exports
Easier currency exchange reduces transaction costs and improves competitiveness of exporters.
Attracts Foreign Capital
Convertible currencies signal openness and stability, attracting FDI and portfolio investments.
Improves Resource Allocation
Capital flows to sectors with higher returns, increasing overall economic efficiency.
Enhances Financial Market Development
Convertibility encourages deeper bond, equity, and forex markets.
Strengthens Global Integration
Countries with convertible currencies participate more actively in global financial systems.
Risks and Challenges of Currency Convertibility
Despite its advantages, currency convertibility also carries significant risks:
Capital Flight Risk
Sudden withdrawal of foreign capital during economic or political instability can destabilize the economy.
Exchange Rate Volatility
Free capital flows can lead to sharp currency fluctuations, affecting trade and inflation.
Loss of Monetary Control
Central banks may find it harder to control money supply and interest rates under full convertibility.
Exposure to Global Shocks
Global financial crises can quickly transmit to domestic markets through capital flows.
Speculative Attacks
Weak economies with open capital accounts may face speculative pressure on their currencies.
Currency Convertibility and Developing Economies
For developing countries, currency convertibility is a strategic decision rather than a binary choice. Gradual liberalization is often preferred to ensure:
Strong banking systems
Adequate foreign exchange reserves
Fiscal discipline
Stable inflation
India, for instance, adopted current account convertibility in the 1990s while cautiously liberalizing the capital account. This phased approach helped balance growth with stability.
Role of Central Banks and Governments
Central banks play a vital role in managing currency convertibility by:
Regulating foreign exchange markets
Managing reserves
Monitoring capital flows
Intervening during excessive volatility
Governments complement this by maintaining sound fiscal policies, regulatory oversight, and transparent financial systems.
Currency Convertibility in the Era of Globalization
With globalization, digital payments, and cross-border investments, currency convertibility has become even more relevant. However, recent trends show that even advanced economies may impose temporary controls during crises, highlighting that convertibility is dynamic and policy-driven rather than absolute.
Conclusion
Understanding currency convertibility is essential for grasping how modern economies function in a globalized world. It influences trade, investment, exchange rates, and financial stability. While full convertibility offers greater integration and efficiency, it also exposes economies to external risks. Therefore, the optimal level of convertibility depends on a country’s economic strength, financial maturity, and policy preparedness.
A well-managed convertibility framework—supported by strong institutions, prudent regulation, and sound macroeconomic policies—can serve as a powerful engine for sustainable growth and global economic participation.

Central Bank Policies Explained for BeginnersWhat Is a Central Bank?
A central bank is the main monetary authority of a country. Examples include the Reserve Bank of India (RBI), Federal Reserve (USA), European Central Bank (ECB), and Bank of England. Unlike commercial banks, central banks do not deal directly with the public. Instead, they regulate banks, manage money supply, and guide the economy through policy decisions.
The central bank’s primary objectives usually include:
Price stability (controlling inflation)
Economic growth
Financial system stability
Employment support (in some countries)
Currency stability
Monetary Policy: The Core Tool
Central bank policies are mainly executed through monetary policy, which controls the supply and cost of money in the economy. Monetary policy is broadly divided into two types:
1. Expansionary Monetary Policy
This policy is used when the economy is slowing down or facing recession. The central bank increases money supply to encourage spending and investment.
Key features:
Lower interest rates
Cheaper loans
Increased borrowing by businesses and consumers
Boost to economic growth
Example: During an economic slowdown, the central bank may reduce interest rates so that businesses invest more and consumers spend more.
2. Contractionary Monetary Policy
This policy is used when inflation is too high. The central bank reduces money supply to control rising prices.
Key features:
Higher interest rates
Costlier loans
Reduced borrowing and spending
Inflation control
Example: When prices of goods rise rapidly, the central bank may increase interest rates to slow down excessive demand.
Key Central Bank Policy Tools
To implement monetary policy, central banks use several important tools:
1. Interest Rates (Policy Rates)
Interest rates are the most visible and powerful policy tool. In India, these include:
Repo Rate: The rate at which banks borrow money from the central bank.
Reverse Repo Rate: The rate at which banks lend excess funds to the central bank.
When the repo rate is reduced, banks can borrow cheaply and pass on lower rates to customers. When increased, borrowing becomes expensive.
2. Open Market Operations (OMO)
Open Market Operations involve buying or selling government securities in the open market.
Buying securities → increases money supply
Selling securities → reduces money supply
This tool helps control liquidity in the banking system.
3. Cash Reserve Ratio (CRR)
CRR is the percentage of deposits that banks must keep with the central bank in cash form.
Lower CRR → banks have more money to lend
Higher CRR → banks have less money to lend
4. Statutory Liquidity Ratio (SLR)
SLR requires banks to maintain a portion of deposits in safe assets like government bonds.
Lower SLR → more lending capacity
Higher SLR → tighter liquidity
5. Moral Suasion
This is an informal method where the central bank persuades banks to follow certain practices, such as reducing risky lending or supporting specific sectors.
Inflation Control and Price Stability
One of the most important roles of a central bank is controlling inflation. Inflation means a continuous rise in prices, which reduces purchasing power.
Central banks usually set an inflation target. If inflation goes above this target, contractionary policies are applied. If inflation falls too low (deflation risk), expansionary measures are used.
Stable inflation:
Protects savings
Encourages investment
Maintains economic confidence
Central Bank and Banking System Stability
Central banks act as the lender of last resort. When banks face liquidity problems, the central bank provides emergency funds to prevent bank failures and protect depositors.
They also:
Regulate and supervise banks
Set capital and risk guidelines
Ensure financial discipline
This role became especially important during financial crises, such as global recessions or banking failures.
Currency and Exchange Rate Management
Central banks manage the country’s currency and foreign exchange reserves. They may intervene in currency markets to prevent extreme volatility.
Strong currency → cheaper imports, controlled inflation
Weak currency → boosts exports but increases import costs
Balanced currency management helps maintain economic competitiveness and investor confidence.
Central Bank Independence
Most modern economies emphasize central bank independence, meaning the central bank can make policy decisions without political pressure. This independence helps ensure long-term economic stability rather than short-term political gains.
However, central banks still coordinate closely with governments, especially during crises.
Impact on Common People
Central bank policies directly affect everyday life:
Home loan and car loan interest rates
Fixed deposit and savings returns
Stock market and bond market movements
Employment and business growth
Inflation and cost of living
For example, when interest rates fall, EMIs become cheaper, but fixed deposit returns may decline.
Why Beginners Should Understand Central Bank Policies
For beginners in finance, trading, or investing, understanding central bank policies is crucial because:
Markets react strongly to policy announcements
Interest rate changes affect asset prices
Currency movements influence global trade
Long-term financial planning depends on monetary conditions
Even non-investors benefit by understanding why prices rise, why loans become expensive, or why the economy slows or accelerates.
Conclusion
Central bank policies may seem technical at first, but they are designed to balance growth, inflation, and financial stability. By adjusting interest rates, managing money supply, and regulating banks, central banks guide the economy through booms and downturns. For beginners, learning the basics of central bank policies builds a strong foundation for understanding economics, making smarter financial decisions, and navigating markets with confidence. Over time, this knowledge becomes a powerful tool in both personal finance and professional growth.
Global Equity Markets Under Pressure: Causes and ConsequencesMacroeconomic Headwinds Driving Market Stress
One of the primary reasons global equities face pressure is the challenging macroeconomic backdrop. High inflation, tighter monetary policy, and slowing economic growth often converge to create an unfavorable environment for stocks. Central banks, led by the US Federal Reserve and followed by institutions such as the European Central Bank and the Bank of England, tend to raise interest rates to control inflation. While necessary, higher interest rates increase borrowing costs for businesses and consumers, reduce corporate profitability, and lower future earnings expectations. Since equity valuations are largely based on discounted future cash flows, rising rates directly weigh on stock prices.
In addition, uneven global growth adds to market uncertainty. While some economies show resilience, others struggle with weak consumption, declining exports, or fiscal constraints. China’s growth fluctuations, Europe’s energy-related challenges, and the cyclical slowdown in parts of the US economy collectively affect global investor confidence. When growth expectations fall, equity markets usually reprice lower.
Geopolitical Tensions and Global Uncertainty
Geopolitical developments play a major role in putting pressure on global equities. Conflicts, trade disputes, sanctions, and diplomatic tensions disrupt supply chains, increase commodity prices, and create uncertainty about future economic stability. Markets dislike uncertainty more than bad news; when the outlook becomes unclear, investors often reduce exposure to risk assets like equities and shift towards safer instruments such as bonds, gold, or cash.
Trade fragmentation and protectionist policies also impact multinational corporations. Many global companies rely on integrated supply chains and international markets for revenue growth. Any disruption or restriction increases costs and reduces margins, leading to downward revisions in earnings forecasts and, ultimately, lower stock prices.
Corporate Earnings Under Strain
Another key factor behind global equity pressure is the strain on corporate earnings. Rising input costs, higher wages, and expensive financing compress profit margins. Even companies with strong revenue growth may struggle to maintain profitability in such an environment. When quarterly earnings fail to meet expectations or forward guidance turns cautious, markets react swiftly and negatively.
Moreover, currency fluctuations add another layer of complexity. A strong US dollar, for example, can hurt companies that earn a significant portion of their revenue overseas, as foreign earnings translate into fewer dollars. Emerging market companies may also face higher debt servicing costs if they have dollar-denominated liabilities, further affecting profitability and investor sentiment.
Liquidity Tightening and Risk Appetite
Global equity markets thrive on liquidity. When central banks reduce liquidity through quantitative tightening or balance sheet reductions, the flow of easy money into financial markets slows down. Lower liquidity means fewer buyers at higher prices, making markets more sensitive to negative news. As a result, even small disappointments can trigger sharp corrections.
Risk appetite among investors also declines during such phases. Institutional investors, hedge funds, and retail participants become more selective, preferring quality stocks with strong balance sheets over speculative or highly leveraged companies. This shift often leads to broad market weakness, especially in high-growth sectors that depend heavily on future earnings.
Sectoral Impact and Market Rotation
Pressure on global equities does not affect all sectors equally. Technology and growth-oriented sectors are usually the most sensitive to rising interest rates because their valuations depend on long-term growth assumptions. Financials may face mixed outcomes, benefiting from higher interest margins but suffering from increased credit risk. Cyclical sectors such as metals, energy, and industrials often reflect concerns about slowing global demand.
At the same time, defensive sectors like healthcare, utilities, and consumer staples tend to outperform during periods of equity market stress. This sectoral rotation reflects investors’ attempts to preserve capital rather than chase high returns. However, even defensive stocks may not be immune if broader market sentiment turns deeply negative.
Emerging Markets and Capital Flows
Emerging market equities often experience amplified pressure during global risk-off phases. Capital tends to flow out of emerging economies and into developed markets perceived as safer. This outflow weakens local currencies, increases inflationary pressure, and forces central banks to maintain higher interest rates, further slowing economic growth.
Despite these challenges, emerging markets with strong fundamentals, improving reforms, and domestic demand-driven growth can show relative resilience. However, in the short term, global equity pressure usually leads to synchronized declines across most regions.
Investor Psychology and Market Volatility
Psychology plays a crucial role when global equities are under pressure. Fear, uncertainty, and negative headlines can create a self-reinforcing cycle of selling. As markets fall, investors worry about further losses and rush to exit positions, increasing volatility. Social media, algorithmic trading, and 24-hour news coverage amplify these reactions, making market moves sharper and faster than in the past.
However, such periods of stress also lay the groundwork for future opportunities. Valuations become more attractive, weak hands exit the market, and long-term investors can gradually accumulate quality assets at discounted prices.
The Road Ahead: Risks and Opportunities
While global equities remain under pressure, the future path depends on several key variables. Inflation trends, central bank policy decisions, geopolitical stability, and corporate earnings growth will determine whether markets stabilize or face further downside. Any sign of easing inflation, rate cuts, or improved global coordination can quickly boost investor confidence.
For investors, the focus should shift from short-term market noise to long-term fundamentals. Diversification across regions and asset classes, disciplined risk management, and patience become especially important during such phases. History shows that periods of equity market pressure, though uncomfortable, are a natural part of market cycles and often precede phases of recovery and growth.
Conclusion
Global equity markets under pressure reflect a complex mix of economic, political, and psychological factors. While the current environment may appear challenging, it is not unprecedented. Understanding the underlying drivers helps investors make informed decisions rather than emotional reactions. Ultimately, equity markets reward long-term discipline, and periods of stress often create the foundation for the next cycle of opportunity.

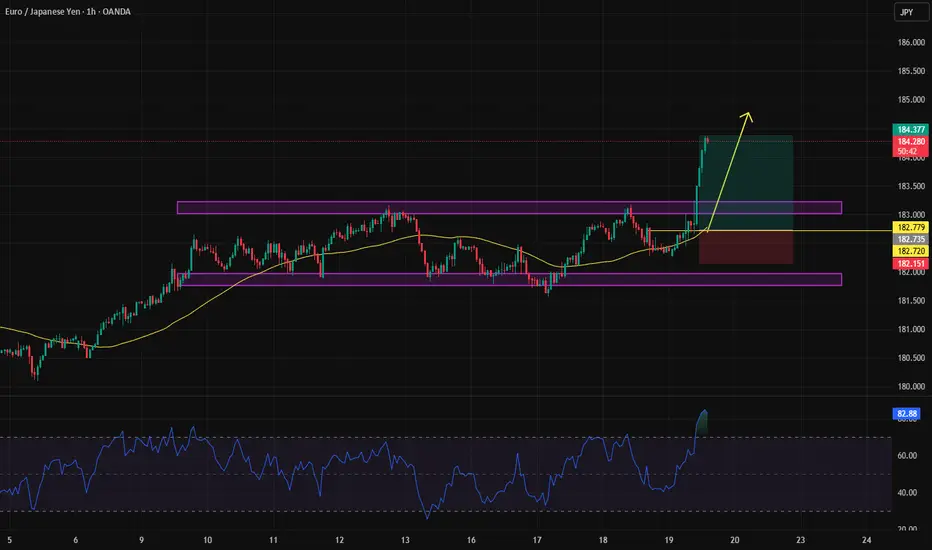
EURJPY-Educational TipEducational Tip: When price stays in a range for a long time, the probability increases that a whale (big player) will break it from one side. Look at this pair— what a great opportunity it was for an earlier entry into the position without missing the move.
The background trend is strongly bullish, and in the end, price couldn't even reach the channel bottom—this in itself is a signal for early entry. If we had entered at the point marked with the yellow line, we wouldn't have missed this move.
You might say, "It's easy to say this now that it's clear," but the truth is: with proper money management, there's no fear of getting stopped out.
| This Chart Shows How We Look at BTC Halving & Market Cycles | This chart shows how we look at BTC halvings and market cycles. Every cycle follows a similar structure — accumulation, expansion, distribution, reaccumulation — but the way it plays out is never the same. That’s the key part most people miss.
Yes, around 539 days have already passed since the last halving, but so far what we’ve really seen is BTC printing a new ATH. And that alone does not define the start of a bull market. BTC making an ATH has happened before without a proper broad market expansion right away.
For us, the real confirmation comes from ETH. Once ETH prints a new ATH — or at least starts hovering close to it — that’s when we can say the bull market has actually started. Only then do we expect the kind of expansion most people are waiting for, especially on alts. Until that happens, everything before it is just positioning and volatility.
We’ve said it before and we’ll say it again: every bull run is different. This one is no exception. Too many people were waiting for the bull run to “just work” the same way it always did. When expectations become that obvious, markets rarely deliver in a clean way.
The most logical outcomes in that case are either delaying the bull run or aggressively taking liquidity — exactly like the recent dip that wiped out a lot of positions and shook people out. Bigger players need fuel, and that fuel comes from impatience.
So no, this doesn’t mean the bull run is cancelled. It means it’s evolving differently. BTC did its part by making a new ATH. Now the market is waiting on ETH. Once that happens, the smaller bull run most people are hoping for can finally kick off.
Until then, patience, positioning, and understanding the cycle matters more than hype.

Inflation, Recession Fears, and Geopolitical ConflictsSafe Haven Gold Trading:
Gold has long occupied a unique position in global financial markets as a safe haven asset—a store of value that investors turn to during periods of uncertainty. Unlike equities, which are closely tied to corporate earnings and economic growth, or fiat currencies, which are subject to monetary policy and inflation risk, gold derives its value from scarcity, durability, and universal acceptance. In times marked by rising inflation, looming recession fears, and escalating geopolitical conflicts, gold trading becomes especially significant as investors seek stability, capital preservation, and portfolio diversification.
Gold as a Hedge Against Inflation
Inflation erodes the purchasing power of money, reducing the real value of cash and fixed-income investments. When inflation rises sharply or is expected to remain elevated, investors often shift capital toward assets that historically maintain value over time. Gold is widely perceived as one such hedge. Its supply grows slowly and cannot be expanded easily by central banks, unlike paper currency, which can be created through monetary easing and deficit financing.
During inflationary periods, real interest rates—nominal rates minus inflation—often turn negative. When real yields fall, the opportunity cost of holding non-yielding assets like gold decreases, making it more attractive. Traders closely monitor inflation indicators such as consumer price indices (CPI), producer prices, and wage growth, as well as central bank signals regarding interest rates. Sustained inflation combined with accommodative monetary policy typically supports bullish gold trends.
For traders, inflation-driven gold movements offer opportunities across multiple time frames. Long-term investors may accumulate gold or gold-backed instruments as a strategic hedge, while short-term traders capitalize on volatility around inflation data releases and policy announcements.
Gold During Recession Fears and Economic Slowdowns
Recession fears often trigger risk aversion across financial markets. As economic growth slows, corporate profits decline, unemployment rises, and equity markets tend to weaken. In such environments, investors reduce exposure to risk assets and reallocate capital toward defensive instruments, including gold.
Gold’s appeal during recessions lies in its perceived stability and independence from economic cycles. While demand for industrial commodities may fall during downturns, gold demand often increases due to its role as a monetary and investment asset. Central banks may also respond to recessions with rate cuts, liquidity injections, and quantitative easing—policies that can weaken currencies and further support gold prices.
From a trading perspective, recession-driven gold rallies are often characterized by strong trends and momentum. Technical indicators such as moving averages, trend channels, and momentum oscillators are widely used to identify entry and exit points. Additionally, correlations play a crucial role: gold often shows an inverse relationship with equities and, at times, with the US dollar, making it a valuable tool for portfolio hedging during economic stress.
Geopolitical Conflicts and Crisis-Driven Demand
Geopolitical conflicts—wars, trade disputes, sanctions, and political instability—are among the most powerful drivers of safe haven demand for gold. Such events increase uncertainty, disrupt supply chains, and threaten global economic stability. When traditional financial systems appear vulnerable, gold’s status as a universally recognized asset becomes particularly valuable.
Historically, gold prices tend to spike during periods of heightened geopolitical tension. Even the risk or anticipation of conflict can drive speculative and hedging demand. Traders pay close attention to developments in major geopolitical hotspots, diplomatic breakdowns, and military escalations, as these events can trigger sudden price movements and increased volatility.
In conflict-driven markets, gold trading often requires swift decision-making and robust risk management. Prices may react sharply to news headlines, making stop-loss placement, position sizing, and disciplined execution essential. For experienced traders, such volatility can present lucrative opportunities, while for long-term investors, it reinforces gold’s role as insurance against extreme scenarios.
Role of Central Banks and Global Demand
Central banks are major players in the gold market and significantly influence long-term price trends. In recent years, many central banks—particularly in emerging economies—have increased gold reserves to diversify away from dependence on major reserve currencies. This structural demand provides a strong underlying support for gold prices, especially during periods of global financial fragmentation.
In addition to central banks, physical demand from jewelry, technology, and investment products such as exchange-traded funds (ETFs) shapes the gold market. During crises, ETF inflows often surge as investors seek quick and liquid exposure to gold, amplifying price movements.
Trading Gold as a Safe Haven Strategy
Safe haven gold trading involves more than simply buying during crises. Successful traders integrate fundamental analysis, technical analysis, and macroeconomic awareness. Fundamentals help identify the broader environment—such as inflation trends, monetary policy, and geopolitical risk—while technical tools guide precise trade execution.
Risk management is critical, as gold can experience sharp corrections even in bullish environments, particularly when markets shift toward risk-on sentiment or when interest rates rise unexpectedly. Diversification across instruments—spot gold, futures, options, and gold mining equities—allows traders to tailor exposure according to risk tolerance and market conditions.
Conclusion
Safe haven gold trading plays a vital role in navigating periods of inflation, recession fears, and geopolitical conflicts. Gold’s enduring value, limited supply, and global acceptance make it a powerful hedge against economic instability and financial uncertainty. Whether used as a long-term store of value or actively traded to capitalize on market volatility, gold remains a cornerstone asset in times of crisis. In an increasingly interconnected and unpredictable world, understanding the dynamics of safe haven gold trading is essential for investors and traders seeking resilience, protection, and strategic advantage in global markets.

Global Positional TradingA Strategic Approach to Profiting from Medium- to Long-Term Market Trends
Global positional trading is a widely practiced trading and investment strategy that focuses on capturing price movements over a medium- to long-term horizon across international financial markets. Unlike intraday or short-term swing trading, positional trading emphasizes holding positions for weeks, months, or sometimes even years, based on strong macroeconomic, fundamental, and technical convictions. In an increasingly interconnected global financial system, positional trading allows market participants to benefit from structural trends, policy shifts, and economic cycles that shape asset prices worldwide.
Understanding Positional Trading in a Global Context
Positional trading is rooted in the belief that major market trends tend to persist over time. Global positional traders aim to identify these trends early and maintain exposure until the underlying drivers weaken or reverse. The “global” dimension expands this approach beyond domestic markets, enabling traders to operate in equities, commodities, forex, bonds, indices, and alternative assets across multiple countries and regions.
This strategy benefits from globalization, where events in one part of the world can influence markets elsewhere. For example, changes in U.S. Federal Reserve policy can impact emerging market currencies, global bond yields, and equity flows. Positional traders analyze such interconnections to position themselves advantageously.
Time Horizon and Trading Psychology
The holding period in global positional trading typically ranges from several weeks to multiple months. This longer timeframe reduces the noise associated with intraday volatility and allows traders to focus on broader price structures. However, it also requires patience, discipline, and emotional control, as positions may experience interim drawdowns before reaching their intended targets.
Psychologically, positional trading demands confidence in analysis and the ability to withstand short-term market fluctuations. Traders must avoid overreacting to daily news or price movements and instead remain aligned with the broader thesis supporting their trade.
Key Asset Classes in Global Positional Trading
Global positional traders operate across a wide array of asset classes:
Equities and Global Indices: Traders may take positions in individual stocks or major indices such as the S&P 500, FTSE 100, Nikkei 225, DAX, or emerging market indices, based on economic growth prospects, earnings cycles, and valuation trends.
Forex Markets: Currency pairs are particularly suited for positional trading due to clear macroeconomic drivers like interest rate differentials, inflation trends, and balance-of-payments dynamics.
Commodities: Gold, crude oil, natural gas, industrial metals, and agricultural commodities often experience long-lasting trends driven by supply-demand imbalances, geopolitical tensions, and global growth cycles.
Fixed Income and Bonds: Positional traders may trade government bonds or bond ETFs to capitalize on changing interest rate expectations and monetary policy cycles.
Role of Fundamental Analysis
Fundamental analysis forms the backbone of global positional trading. Traders closely monitor macroeconomic indicators such as GDP growth, inflation, employment data, interest rates, fiscal policy, and central bank guidance. Geopolitical developments, trade agreements, sanctions, and political stability also play a crucial role in shaping long-term trends.
For example, an expectation of prolonged monetary tightening in developed economies may lead a positional trader to favor stronger currencies, weaker equity markets, or rising bond yields. Similarly, long-term infrastructure spending plans can support bullish positions in industrial metals or construction-related equities.
Technical Analysis for Timing and Risk Control
While fundamentals define the “what” and “why” of a trade, technical analysis helps determine the “when.” Global positional traders rely on higher-timeframe charts such as daily, weekly, or even monthly charts to identify trend direction, key support and resistance levels, and price patterns.
Common tools include moving averages, trendlines, Fibonacci retracements, momentum indicators, and chart formations. Technical analysis is especially useful for optimizing entry points, setting stop-loss levels, and planning profit targets without undermining the core fundamental view.
Risk Management in Global Positional Trading
Effective risk management is critical in positional trading, particularly when dealing with global markets that can be affected by sudden political or economic shocks. Traders typically use wider stop-losses compared to short-term strategies but compensate by reducing position size to maintain acceptable risk exposure.
Diversification across asset classes and regions is another key element. By spreading capital across uncorrelated markets, traders reduce the impact of adverse movements in any single position. Currency risk, overnight gaps, and varying market regulations are also carefully considered in global positioning.
Impact of Global Events and Geopolitics
Global positional trading is highly sensitive to geopolitical developments. Wars, trade conflicts, elections, sanctions, and diplomatic shifts can redefine long-term market narratives. A well-informed positional trader continuously reassesses positions in light of new information while avoiding impulsive decisions.
For instance, escalating geopolitical tensions may support defensive assets such as gold or safe-haven currencies, while easing tensions could encourage risk-on positions in equities and emerging markets.
Advantages of Global Positional Trading
One of the main advantages of global positional trading is reduced transaction frequency, which lowers trading costs and minimizes the impact of short-term market noise. It also allows traders to align with powerful, long-lasting trends rather than chasing daily price movements.
Additionally, this approach is well-suited for individuals who cannot monitor markets continuously, as decisions are made based on broader analysis rather than minute-by-minute price action.
Challenges and Limitations
Despite its advantages, global positional trading is not without challenges. Markets can remain range-bound for extended periods, testing a trader’s patience. Unexpected policy changes or black-swan events can disrupt even the strongest fundamental setups. Furthermore, holding positions over long periods exposes traders to overnight and weekend risks.
Success therefore depends on continuous learning, adaptability, and a structured trading plan that balances conviction with flexibility.
Conclusion
Global positional trading represents a disciplined, strategic approach to participating in international financial markets. By combining macroeconomic insight, fundamental research, and higher-timeframe technical analysis, traders can position themselves to benefit from major global trends. While it requires patience, strong risk management, and emotional resilience, positional trading offers a powerful framework for those seeking consistent, well-researched exposure to global market opportunities over the medium to long term.

Energy Market Dynamics Amid Rising Geopolitical TensionsThe Strategic Importance of Energy in Global Politics
Energy resources are not merely commodities; they are strategic assets. Countries that control major reserves of oil, natural gas, or critical energy infrastructure often wield significant geopolitical influence. Energy-exporting nations use supply control as a diplomatic and economic tool, while energy-importing countries focus on securing stable and diversified supply chains. As a result, disruptions caused by wars, sanctions, or diplomatic breakdowns can have immediate and far-reaching effects on global energy prices and availability.
Historically, events such as the Middle East conflicts, the Russia–Ukraine war, tensions in the South China Sea, and instability in key producing regions have demonstrated how energy markets react swiftly to geopolitical risk. Even the threat of conflict or sanctions can lead to price spikes, increased hedging activity, and speculative movements in energy futures markets.
Oil Markets Under Geopolitical Stress
Crude oil remains the most geopolitically sensitive energy commodity. Major oil-producing regions such as the Middle East, Russia, and parts of Africa are frequently affected by political instability. When tensions rise in these areas, concerns about supply disruptions quickly translate into higher oil prices.
Sanctions imposed on major oil exporters can significantly reduce global supply, forcing markets to rebalance through alternative sources. This often benefits other producing nations but increases costs for importing countries. Strategic petroleum reserves (SPRs) have become a key policy tool, with governments releasing reserves to stabilize prices during periods of geopolitical stress. However, these measures are typically temporary and do not address long-term supply challenges.
Natural Gas and Energy Security
Natural gas markets have become central to geopolitical discussions, particularly due to their role in power generation, industrial use, and heating. Pipeline infrastructure creates strong interdependence between exporting and importing countries, making gas supply especially vulnerable to political disputes. When diplomatic relations deteriorate, gas supplies can be reduced or halted, leading to sharp price increases and energy shortages.
Liquefied natural gas (LNG) has emerged as a strategic alternative, allowing importing countries to diversify supply sources and reduce reliance on specific pipeline routes. However, LNG markets are also influenced by geopolitical competition, as nations compete for cargoes during periods of high demand or supply disruption. Rising geopolitical tensions have accelerated investments in LNG infrastructure, storage facilities, and cross-border energy cooperation agreements.
Energy Transition and Geopolitical Competition
Geopolitical tensions are not only impacting fossil fuel markets but also shaping the global energy transition. Countries are increasingly viewing renewable energy, nuclear power, and energy storage as tools for achieving energy independence and reducing exposure to geopolitical risk. Solar, wind, and hydrogen technologies are gaining strategic importance, as they rely less on imported fuels once infrastructure is established.
At the same time, the energy transition has introduced new geopolitical challenges. Competition over critical minerals such as lithium, cobalt, nickel, and rare earth elements has intensified, as these resources are essential for batteries, electric vehicles, and renewable energy systems. Control over supply chains for these materials is becoming a new arena of geopolitical rivalry, potentially replacing traditional oil and gas conflicts.
Impact on Global Trade and Inflation
Rising energy prices driven by geopolitical tensions have a direct impact on global inflation and economic stability. Energy is a core input for transportation, manufacturing, and agriculture, meaning higher prices quickly filter through supply chains. For developing economies and energy-importing nations, this can strain public finances, widen trade deficits, and increase the cost of living.
Global trade flows are also being reconfigured as countries seek to secure energy supplies from politically aligned partners. This has led to the formation of new energy alliances and long-term supply contracts, sometimes at the expense of market efficiency. While these arrangements can enhance energy security, they may also increase costs and reduce flexibility in the global energy system.
Financial Markets and Investor Sentiment
Geopolitical tensions introduce significant uncertainty into energy markets, influencing investor behavior and capital allocation. Energy stocks, commodities, and related derivatives often experience increased volatility during periods of geopolitical stress. While higher prices can boost revenues for energy producers, uncertainty can deter long-term investment, particularly in capital-intensive projects.
Investors are increasingly factoring geopolitical risk into their decision-making processes, alongside environmental, social, and governance (ESG) considerations. This dual pressure is reshaping the energy investment landscape, with greater emphasis on diversification, risk management, and resilience.
Long-Term Outlook and Strategic Adaptation
Looking ahead, geopolitical tensions are likely to remain a defining feature of the global energy market. Climate policies, shifting power balances, and technological advancements will continue to interact with political developments in complex ways. Countries that successfully balance energy security, affordability, and sustainability will be better positioned to navigate this evolving landscape.
Strategic adaptation will require diversified energy portfolios, resilient infrastructure, international cooperation, and transparent markets. While geopolitical tensions pose significant challenges, they also create opportunities for innovation, collaboration, and the acceleration of cleaner energy systems. Ultimately, the future of the energy market will depend not only on resource availability but also on how nations manage geopolitical risk in an interconnected world.
Conclusion
The rise in geopolitical tensions has reinforced the central role of energy in global economic and political systems. From oil and gas markets to renewables and critical minerals, energy dynamics are being reshaped by conflict, competition, and strategic realignment. As uncertainty persists, the ability to understand and anticipate the interaction between geopolitics and energy markets will be crucial for ensuring stability, growth, and long-term energy security in a rapidly changing world.

A Complete Guide to Consistent Currency Market SuccessTrading Forex Major Pairs
The foreign exchange (forex) market is the largest and most liquid financial market in the world, with daily trading volumes exceeding trillions of dollars. At the heart of this vast marketplace lie the major currency pairs, which are the most actively traded and widely followed instruments by traders, institutions, and central banks. Trading forex major pairs offers stability, transparency, and abundant opportunities, making them ideal for both beginners and experienced traders. This guide explains what forex major pairs are, why they matter, and how to trade them effectively for long-term success.
What Are Forex Major Pairs?
Forex major pairs are currency pairs that always include the US Dollar (USD) and are paired with the world’s strongest and most influential currencies. The commonly recognized major pairs are:
EUR/USD (Euro / US Dollar)
GBP/USD (British Pound / US Dollar)
USD/JPY (US Dollar / Japanese Yen)
USD/CHF (US Dollar / Swiss Franc)
AUD/USD (Australian Dollar / US Dollar)
USD/CAD (US Dollar / Canadian Dollar)
NZD/USD (New Zealand Dollar / US Dollar)
These pairs dominate global forex trading because they represent economies with high trade volumes, stable political systems, and strong financial institutions.
Why Trade Forex Major Pairs?
Forex major pairs are popular for several compelling reasons. First, they offer high liquidity, meaning trades can be executed quickly with minimal price slippage. This is especially important during volatile market conditions. Second, major pairs have tight spreads, reducing transaction costs and making them cost-efficient for frequent trading strategies such as scalping and day trading.
Another advantage is the availability of information. Economic data, central bank policies, and geopolitical developments related to major currencies are widely reported and analyzed. This transparency allows traders to make informed decisions based on reliable data rather than speculation. Additionally, major pairs tend to respect technical levels more consistently due to large institutional participation, making technical analysis more effective.
Understanding the Behavior of Major Pairs
Each major forex pair has its own personality and reacts differently to economic events. For example, EUR/USD is heavily influenced by interest rate decisions from the European Central Bank (ECB) and the US Federal Reserve. GBP/USD is known for its volatility, especially during UK political or economic announcements. USD/JPY often acts as a safe-haven pair, reacting strongly to global risk sentiment and bond yields.
Understanding these behavioral traits helps traders select the right pair for their trading style. Some pairs trend smoothly, while others move aggressively in short bursts. Matching pair characteristics with your strategy is a key step toward consistency.
Fundamental Analysis in Major Pair Trading
Fundamental analysis plays a vital role when trading forex major pairs. Since these currencies represent powerful economies, macroeconomic indicators strongly influence price movements. Key factors include interest rates, inflation data, employment figures, GDP growth, and central bank guidance.
Interest rate differentials are particularly important. Currencies with higher interest rates tend to attract capital inflows, strengthening their value. For instance, if the Federal Reserve signals rate hikes while another central bank remains dovish, USD-based pairs may trend strongly. Traders who follow economic calendars and central bank statements gain a significant edge in anticipating medium- to long-term trends.
Technical Analysis and Chart Patterns
Technical analysis is widely used in major pair trading due to the clean and structured price movements these pairs often exhibit. Support and resistance levels, trendlines, moving averages, and momentum indicators such as RSI and MACD work effectively on major pairs.
Chart patterns like flags, triangles, head and shoulders, and double tops frequently appear and offer high-probability trade setups. Because institutional traders also rely heavily on technical analysis, price often reacts strongly at key technical zones. Combining multiple technical signals rather than relying on a single indicator improves trade accuracy.
Best Trading Sessions for Major Pairs
Timing is crucial in forex trading. Major pairs are most active during specific market sessions. The London session and the New York session are particularly important, as they overlap for several hours and account for the highest trading volume.
EUR/USD and GBP/USD show strong movement during the London–New York overlap, making this period ideal for intraday traders. USD/JPY often moves more actively during the Asian session, especially when Japanese economic data is released. Trading during high-liquidity sessions improves execution quality and increases the likelihood of meaningful price movement.
Risk Management: The Key to Survival
Even when trading stable major pairs, risk management remains essential. No strategy works 100% of the time, and protecting capital is the top priority. Traders should always use stop-loss orders, limit risk to a small percentage of their trading account per trade, and avoid excessive leverage.
Major pairs may appear less volatile, but unexpected news events can cause sharp price swings. A disciplined approach to position sizing and risk control ensures that a few losing trades do not wipe out weeks or months of progress. Consistency in risk management separates professional traders from emotional gamblers.
Common Mistakes to Avoid
One common mistake in trading forex major pairs is overtrading. Because these pairs are always active, traders may feel compelled to trade constantly. Quality setups matter more than quantity. Another mistake is ignoring fundamentals and focusing only on technical signals during major news releases, which can lead to unpredictable outcomes.
Traders should also avoid emotional decision-making. Chasing trades after missing an entry or holding losing positions in hope of reversal often leads to unnecessary losses. A clear trading plan with predefined rules helps maintain discipline.
Building a Long-Term Trading Approach
Successful forex major pair trading is not about quick profits but about building a sustainable process. Traders should specialize in a few major pairs rather than trying to trade all of them. This allows deeper understanding of price behavior and improves decision-making.
Keeping a trading journal, reviewing past trades, and continuously refining strategies contribute to long-term improvement. Markets evolve, and traders must adapt while staying true to their core principles.
Conclusion
Trading forex major pairs offers a balanced combination of liquidity, reliability, and opportunity. These pairs provide an ideal environment for applying both technical and fundamental analysis, making them suitable for traders of all experience levels. By understanding pair behavior, respecting market sessions, managing risk effectively, and maintaining discipline, traders can unlock consistent performance in the global currency market. Mastery of forex major pairs is often the foundation upon which long-term trading success is built.

Why Consistency Beats Talent in TradingWelcome all to another post! In today's post we will review the difference between Talented trading and consistent trading.
Why Consistency Beats Talent in Trading
Many new traders usually enter trading believing that success belongs to the most intelligent individuals, the most analytical, or the most “naturally gifted.” In any field.
When in reality, the market only rewards something that is far less glamorous, and that is.. consistency.
Talent can help you understand charts faster and/or grasp concepts a lot quicker, but it is consistency that determines and shows whether you survive long enough to become profitable and make a positive return.
Talent Creates Potential | Consistency Creates Results
Talent shows up early, like in the first week or two.
You might spot patterns instantly, win a few trades, or feel like trading “just makes sense” to you.
Consistency shows up later and it’s far rarer.
The market does not care how smart you are.
It only responds to:
- How often you follow your rules and system.
- How well you manage risk ( or gamble it. )
- How disciplined you are under pressure and stress
- A talented trader who trades emotionally will eventually lose, ( always lose. )
- A consistent trader with average skills can compound them steadily over time.
Why Talented Traders Often Struggle
Ironically, talent can be a disadvantage ( keep on reading )
Talented traders often:
- Rely on intuition instead of their own rules or the games rules ( or common sense. )
- Take trades outside their plan ( like above, not following their rules. )
- Increase risk after a few wins ( again, not following RM rules. )
- Ignore data because “ they feel confident ”
This leads to inconsistency big wins followed by bigger losses. ( Gambling )
The market eventually punishes anyone who treats probability like certainty.
Consistency Turns Probability into an Edge
Trading is not about being right it’s about commencing the same process over and over.
Consistency means:
- Taking only the setups you’ve defined. (Defined what A+ is)
- Risking the same amount per trade. (Risk Management)
- Accepting losses without deviation. (Moving on after a loss)
- Following your plan even after losing streaks. (Maintaining consistency)
One trade means nothing.
A hundred trades executed the same way reveal your edge.
Consistency allows probability to work for you, not against you.
The Market Rewards Discipline, Not Brilliance
The best traders in the world are not constantly trying to outsmart the market.
They:
- Trade fewer setups
- Keep their approach simple
- Protect capital first
- Let time and repetition do the work
- They understand that survival is the first goal.
- You can’t compound an account you’ve blown.
Consistency Is Boring and That’s the Point
Consistencty lacks excitement.
There are no adrenaline rushes, no heroic trades, no all-in moments.
Just repetition, patience, and restraint. This is why most people fail.
The market filters out those who chase excitement and rewards those who treat trading like a business, not entertainment.
Talent Without Consistency Is Temporary
Many traders experience early success.
Very few maintain it.
Short-term success often comes from:
- Favorable market conditions
- Random luck
- Overconfidence
Long-term success comes from:
- Process
- Risk control
- Emotional discipline
Consistency is what turns a good month into a sustainable career.
How to Build Consistency as a Trader
Consistency is a skill not a personality trait.
You build it by:
- Defining clear trading rules
- Using fixed risk per trade
- Journaling every trade honestly
- Reviewing performance regularly
- Trading less, not more
Your goal isn’t to be impressive.
Your goal is to be repeatable.
Final Thoughts
Talent may get you interested in trading.
Consistency keeps you in the game.
In a profession driven by uncertainty, the trader who shows up the same way every day will always outperform the one chasing brilliance.
In trading, consistency doesn’t just beat talent > it replaces it.
Thank you all so much for reading, I hope everyone enjoys it and that it benefits you all!
Let me know in the comments below if you have any questions or requests.

Global Bonds Trading and Its Role in the World EconomyGlobal bonds trading is one of the most important yet often less visible pillars of the international financial system. While equity markets usually attract more public attention due to their volatility and growth potential, bond markets are significantly larger in size and play a foundational role in funding governments, corporations, and development projects worldwide. Bonds represent debt instruments where issuers borrow capital from investors and promise fixed or floating interest payments over a defined period. Global bonds trading refers to the buying, selling, issuance, and management of these debt securities across international markets, currencies, and jurisdictions.
At its core, global bonds trading connects savers with borrowers on a worldwide scale. Governments issue sovereign bonds to finance fiscal deficits, infrastructure, and public welfare programs. Corporations issue bonds to expand operations, refinance debt, or fund acquisitions. Supranational institutions such as the World Bank or Asian Development Bank issue bonds to support development goals. Investors—including central banks, pension funds, insurance companies, hedge funds, and retail investors—participate in these markets to earn stable returns, manage risk, and diversify portfolios.
Structure of the Global Bond Market
The global bond market can be broadly divided into several categories. Sovereign bonds form the backbone of the system and are issued by national governments. Examples include U.S. Treasury bonds, German Bunds, Japanese Government Bonds (JGBs), and Indian Government Securities (G-Secs). These bonds are generally considered low-risk, especially those issued by developed economies, and are often used as benchmarks for pricing other debt instruments.
Corporate bonds are issued by private and public companies and usually offer higher yields than sovereign bonds to compensate for higher credit risk. They range from investment-grade bonds issued by financially strong companies to high-yield or “junk” bonds issued by companies with weaker balance sheets. Emerging market bonds, issued by governments and companies in developing economies, form another important segment, offering higher returns but also carrying risks such as currency volatility, political instability, and weaker regulatory frameworks.
Another critical segment is the Eurobond market, where bonds are issued in a currency different from the issuer’s domestic currency and sold internationally. For example, a Japanese company issuing U.S. dollar–denominated bonds in Europe would be part of the Eurobond market. This market enhances global liquidity and allows issuers to tap into a wider investor base.
Key Participants in Global Bonds Trading
Global bonds trading involves a diverse ecosystem of participants. Central banks play a dominant role, especially through monetary policy operations such as open market purchases, quantitative easing, and interest rate management. Their actions directly influence bond yields, liquidity, and investor sentiment worldwide.
Institutional investors such as pension funds and insurance companies are major buyers of bonds due to their need for long-term, stable income streams. Mutual funds and exchange-traded funds (ETFs) allow retail and institutional investors to gain diversified exposure to global bond markets. Investment banks act as intermediaries, underwriting new bond issues, making markets, and facilitating secondary market trading.
Hedge funds and proprietary trading desks add liquidity and efficiency by engaging in active trading strategies, including yield curve positioning, arbitrage, and macro-driven trades. Sovereign wealth funds also play a growing role, allocating capital across global bond markets to preserve and grow national wealth.
Pricing, Yields, and Interest Rate Dynamics
Bond prices and yields move inversely, and this relationship is central to global bonds trading. Interest rates set by major central banks—such as the U.S. Federal Reserve, European Central Bank, and Bank of Japan—have a profound impact on bond markets worldwide. When interest rates rise, existing bond prices typically fall, and when rates decline, bond prices rise.
Yield curves, which plot yields across different maturities, provide critical insights into market expectations for economic growth, inflation, and monetary policy. An upward-sloping yield curve usually indicates expectations of economic expansion, while an inverted yield curve often signals recession risks. Traders and investors closely monitor yield curve movements across countries to identify relative value opportunities and macroeconomic trends.
Inflation expectations are another major driver. Since bonds provide fixed payments, rising inflation erodes real returns, leading investors to demand higher yields. This makes inflation data, commodity prices, and fiscal policy developments highly relevant to global bond trading decisions.
Currency Risk and Cross-Border Considerations
Unlike domestic bond trading, global bonds trading involves currency risk. When investors buy bonds denominated in foreign currencies, their returns depend not only on bond yields but also on exchange rate movements. A strong appreciation in the investor’s home currency can reduce returns, while currency depreciation can enhance gains.
To manage this risk, investors often use currency hedging strategies through forward contracts, futures, or swaps. Currency considerations also influence issuance decisions, as borrowers choose currencies with lower interest rates or stronger investor demand. As a result, global bonds trading is closely intertwined with the foreign exchange market.
Role in Economic Stability and Capital Flows
Global bond markets play a vital role in channeling capital from surplus economies to deficit economies. Developed countries with large savings pools invest in bonds issued by emerging markets, supporting growth and development. At the same time, sudden shifts in global risk sentiment can trigger capital outflows, leading to bond market volatility, currency depreciation, and financial stress in vulnerable economies.
During periods of crisis, such as financial meltdowns or pandemics, global bond markets often act as safe havens. Investors flock to high-quality sovereign bonds, pushing yields lower and providing governments with cheaper borrowing costs. Central banks also rely on bond markets as key transmission channels for stabilizing the economy.
Technology, Transparency, and Market Evolution
Advancements in trading technology have transformed global bonds trading. Traditionally dominated by over-the-counter (OTC) transactions and relationship-based trading, bond markets are gradually becoming more electronic and transparent. Electronic trading platforms, algorithmic trading, and improved data analytics have enhanced price discovery and liquidity, especially in developed markets.
However, bond markets still face challenges related to fragmentation, regulatory differences, and liquidity constraints, particularly during periods of stress. Regulatory reforms after global financial crises have improved transparency and risk management but have also altered dealer participation, changing market dynamics.
Conclusion
Global bonds trading is a cornerstone of the international financial architecture, influencing interest rates, capital flows, currency markets, and economic stability. It provides essential funding for governments and corporations while offering investors a wide spectrum of risk-return opportunities. Understanding the structure, participants, and drivers of global bond markets is crucial for policymakers, investors, and traders alike. As globalization, technological innovation, and shifting economic power continue to reshape the world economy, global bonds trading will remain central to how capital is allocated and how financial risks are managed across borders.

Global Trade in the Modern MarketStructure, Dynamics, and Strategic Importance
Global trade in the modern market represents one of the most powerful engines of economic growth, innovation, and international interdependence. Unlike earlier eras—when trade was limited by geography, slow transportation, and fragmented information—today’s global trade ecosystem operates at high speed, across digital platforms, and through deeply integrated supply chains. Goods, services, capital, data, and technology now move across borders with unprecedented scale and complexity, reshaping how nations compete and collaborate.
1. Evolution of Global Trade
Modern global trade has evolved from simple bilateral exchange into a sophisticated, multi-layered network. Containerization revolutionized logistics, reducing costs and transit times. The rise of multinational corporations (MNCs) fragmented production into global value chains (GVCs), where design, manufacturing, assembly, and marketing occur in different countries. Digitalization further transformed trade by enabling real-time coordination, e-commerce, and cross-border services that require no physical shipment at all.
2. Key Drivers of Modern Global Trade
Several forces define today’s trading environment:
Technology and Digital Platforms: Cloud computing, AI, and data analytics optimize inventory, pricing, and demand forecasting. Digital marketplaces allow even small firms to access global customers.
Trade Liberalization: Free trade agreements (FTAs) and regional blocs reduce tariffs, harmonize standards, and encourage cross-border investment.
Capital Mobility: Global finance supports trade through credit, hedging instruments, and risk management tools such as futures, options, and insurance.
Consumer Demand: Rising incomes in emerging markets fuel demand for diverse products, while developed markets seek cost efficiency and innovation.
3. Structure of Global Trade Flows
Modern trade flows extend beyond physical goods:
Merchandise Trade: Includes commodities (energy, metals, agriculture) and manufactured goods (electronics, automobiles, machinery).
Services Trade: Finance, IT services, logistics, consulting, tourism, and digital services are growing faster than goods trade.
Intellectual Property and Data: Licensing, software, patents, and data flows are now critical trade assets.
Capital and Investment: Foreign direct investment (FDI) supports production hubs and market access.
4. Role of Global Value Chains (GVCs)
Global value chains are the backbone of modern trade. A single product—such as a smartphone—may involve raw materials from Africa, components from East Asia, design from the US or Europe, and assembly in Southeast Asia. This specialization increases efficiency but also creates vulnerability. Disruptions like pandemics, geopolitical tensions, or natural disasters can ripple across the entire chain, forcing firms to rethink resilience and diversification.
5. Emerging Markets and Trade Power Shifts
The modern trade landscape reflects a gradual shift from a unipolar system to a multipolar one. Emerging economies—particularly in Asia, Latin America, and parts of Africa—are no longer just low-cost manufacturers. They are becoming:
Major consumer markets
Innovation hubs
Strategic suppliers of critical resources
Countries like China, India, Vietnam, and Mexico play increasingly central roles in global production and trade negotiations, influencing pricing, standards, and supply-chain strategies.
6. Geopolitics and Trade Policy
Trade today is inseparable from geopolitics. Tariffs, sanctions, export controls, and industrial policies are used as strategic tools. Governments prioritize:
Economic security (semiconductors, energy, food)
Supply-chain sovereignty
Strategic alliances and friend-shoring
This has led to partial de-globalization or “re-globalization,” where trade is restructured around trusted partners rather than purely cost-based efficiency.
7. Financial Markets and Trade Integration
Modern trade is closely linked with global financial markets:
Foreign Exchange (FX): Currency movements directly impact trade competitiveness and profitability.
Derivatives: Futures and options help exporters and importers hedge price and currency risks.
Trade Finance: Letters of credit, guarantees, and supply-chain finance enable liquidity and trust across borders.
This integration allows trade to scale rapidly but also exposes it to financial volatility and capital flow reversals.
8. Sustainability and ESG in Global Trade
Environmental, Social, and Governance (ESG) considerations are reshaping trade decisions. Companies and governments now factor in:
Carbon footprints and green logistics
Ethical sourcing and labor standards
Circular economy principles
Carbon border taxes, sustainability-linked financing, and green trade corridors are emerging as defining features of modern global commerce.
9. Digital Trade and the Future of Commerce
Digital trade is one of the fastest-growing segments:
Cross-border e-commerce platforms connect sellers and buyers directly.
Digital payments and blockchain improve transparency and settlement.
Services like cloud computing, online education, and remote work are traded globally without physical borders.
Regulation of data flows, cybersecurity, and digital taxation will heavily influence the next phase of global trade.
10. Risks and Challenges in the Modern Trade System
Despite its scale and efficiency, modern global trade faces key challenges:
Supply-chain disruptions
Trade wars and protectionism
Currency volatility
Regulatory fragmentation
Climate-related risks
Managing these risks requires diversification, strategic inventory management, and advanced risk-hedging tools.
11. Strategic Importance of Global Trade
Global trade is more than economic exchange—it is a strategic asset. It shapes:
National growth and employment
Corporate profitability and competitiveness
Innovation diffusion
Global political influence
Countries that master trade logistics, financial integration, and technological adoption gain long-term strategic advantages.
Conclusion
Global trade in the modern market is a complex, fast-moving, and deeply interconnected system. It blends physical goods, digital services, finance, and geopolitics into a single global framework. While efficiency and scale have reached historic highs, resilience, sustainability, and strategic alignment are now equally important. The future of global trade will not be defined solely by how cheaply goods move across borders, but by how intelligently, securely, and sustainably global markets are connected.
Trading Global Indices: Opportunities, Strategies, and RisksUnderstanding Global Indices
A global index is a benchmark that tracks the performance of a group of stocks representing a specific market. Examples include the S&P 500 in the United States, the FTSE 100 in the United Kingdom, the DAX 40 in Germany, the Nikkei 225 in Japan, and the Nifty 50 in India. There are also broader indices such as the MSCI World Index or MSCI Emerging Markets Index, which capture performance across multiple countries.
These indices are usually weighted by market capitalization, meaning larger companies have a greater impact on index movement. When traders buy or sell an index, they are effectively trading the overall direction of that economy or market rather than betting on the success or failure of a single firm.
Why Traders Choose Global Index Trading
One of the biggest advantages of trading global indices is diversification. Since an index contains many stocks, the risk associated with one company’s poor performance is reduced. This makes indices relatively more stable compared to individual equities, especially during periods of company-specific volatility.
Another major reason is liquidity. Popular indices such as the S&P 500, Dow Jones, Nasdaq, and DAX are among the most liquid instruments in the world. High liquidity ensures tight spreads, efficient price discovery, and smooth execution, which is particularly attractive for intraday traders and institutional participants.
Global indices are also highly responsive to macroeconomic events. Interest rate decisions, inflation data, employment numbers, geopolitical developments, and central bank policies all influence index movement. For traders who enjoy macro-driven strategies, indices offer a direct way to express views on economic growth or slowdown.
Instruments Used to Trade Global Indices
Traders can access global indices through multiple instruments. Index futures are widely used by professional traders and institutions, offering leverage and standardized contracts traded on regulated exchanges. Index options provide strategies for hedging, income generation, and volatility trading.
For retail traders, contracts for difference (CFDs) and exchange-traded funds (ETFs) are common choices. CFDs allow traders to speculate on price movements without owning the underlying asset, while ETFs provide a simpler way to invest in an index through the stock market. Each instrument has its own cost structure, risk profile, and suitability depending on the trader’s objectives.
Key Drivers of Global Index Movements
Global indices are influenced by a combination of economic, political, and psychological factors. Monetary policy is one of the most important drivers. Interest rate hikes or cuts by central banks such as the Federal Reserve, ECB, or RBI directly impact equity valuations and index trends.
Economic data releases like GDP growth, inflation, manufacturing indices, and employment reports often cause sharp short-term moves. Strong data typically supports bullish sentiment, while weak data can trigger sell-offs.
Corporate earnings also play a significant role. Since indices are composed of major companies, quarterly earnings seasons often bring increased volatility. Strong earnings across sectors can lift an index, while widespread disappointments can drag it down.
Geopolitical events, trade policies, wars, sanctions, and global crises can lead to risk-off or risk-on behavior across global indices. In times of uncertainty, capital often flows out of equities into safe-haven assets, putting pressure on indices worldwide.
Trading Strategies for Global Indices
Index trading supports a wide range of strategies. Trend-following is one of the most common approaches, as indices often move in sustained trends driven by economic cycles. Traders use moving averages, trendlines, and momentum indicators to capture these moves.
Range trading is effective during periods of consolidation, when indices move between well-defined support and resistance levels. Breakout strategies are popular around major economic announcements, where indices can move sharply once key levels are breached.
Swing trading focuses on capturing medium-term moves over days or weeks, often based on technical patterns combined with macro themes. Long-term investors, on the other hand, use indices to participate in economic growth over years, benefiting from compounding and reinvested dividends.
Risk Management in Index Trading
Despite their diversification benefits, global indices are not risk-free. Market-wide crashes, such as those seen during financial crises or pandemics, can cause rapid and deep declines. Proper risk management is therefore essential.
Using stop-loss orders, controlling position size, and avoiding excessive leverage are fundamental principles. Traders should also be aware of correlation risk, as global indices often move together during periods of stress, reducing the benefits of diversification across regions.
Understanding trading hours is another key aspect. Different indices are most active during their local market sessions, and volatility can spike when major markets overlap.
Role of Global Indices in a Trading Portfolio
Global indices play a crucial role in portfolio construction. They can be used as core holdings to represent equity exposure, while other instruments such as commodities, bonds, or currencies are added for balance. Active traders use indices to hedge exposure in individual stocks or sectors, especially during uncertain market conditions.
For Indian traders, global indices also provide international exposure beyond domestic markets. Movements in the US or European indices often influence Asian markets, making global index analysis valuable even for local trading decisions.
Conclusion
Trading global indices offers a powerful way to participate in the world’s financial markets with diversification, liquidity, and strong macroeconomic relevance. Whether used for short-term trading, swing strategies, or long-term investment, indices reflect the collective behavior of economies and investors worldwide. Success in global index trading depends on understanding economic drivers, choosing the right instruments, applying disciplined strategies, and managing risk effectively. In an increasingly interconnected world, mastering global index trading is an essential skill for modern market participants.

Spot Forex Secrets: The Core of the Global Currency Market1. What Spot Forex Really Means
The word spot refers to transactions settled “on the spot,” usually within two business days. In practice, most retail traders never take delivery of currencies; they speculate on price movements. The spot forex market is decentralized, meaning there is no single exchange. Prices are derived from a network of global banks, financial institutions, and liquidity providers. This decentralization creates deep liquidity, tight spreads, and fast execution—key advantages that attract traders worldwide.
2. Liquidity: The Hidden Advantage
One of the biggest secrets of spot forex is liquidity. Major currency pairs like EUR/USD, USD/JPY, and GBP/USD trade in enormous volumes. High liquidity reduces slippage, allows smooth entry and exit, and makes technical analysis more reliable. Many professional traders focus only on highly liquid pairs because price behavior tends to respect levels, trends, and patterns better than thinly traded markets.
3. The Power of Currency Pair Dynamics
Spot forex trading is unique because every trade involves two economies. A currency pair is not just a price chart—it reflects interest rates, inflation, employment data, political stability, and central bank policy from both countries. Successful traders understand relative strength: a strong currency paired against a weak one often produces clearer, more sustained trends.
For example, if one central bank is raising interest rates while another is cutting, the interest rate differential becomes a powerful driver of spot prices. This macro awareness gives traders an edge beyond simple chart reading.
4. Time Zones and Market Sessions
Another lesser-known secret is the importance of trading sessions. The forex market follows the sun—from Sydney to Tokyo, London, and New York. Each session has its own characteristics:
Asian Session: Often slower, range-bound, dominated by JPY and AUD pairs.
London Session: High volatility and volume; trends often begin here.
New York Session: Strong momentum, especially during overlap with London.
Professional traders align their strategies with session behavior. Breakout traders prefer London opens, while range traders may thrive in Asian hours.
5. Price Action Over Indicators
Many beginners overload charts with indicators. Seasoned spot forex traders, however, rely heavily on price action. Candlestick patterns, support and resistance, trend structure, and market context often provide clearer signals than lagging indicators.
Indicators can help confirm momentum or volatility, but price itself tells the real story. The “secret” is learning to read what the market is doing, not what an indicator says it already did.
6. Leverage: A Double-Edged Sword
Leverage is both the greatest attraction and the greatest danger in spot forex. It allows traders to control large positions with small capital, amplifying profits—but also losses. The secret here is not avoiding leverage, but respecting it.
Professional traders use low effective leverage, risking only a small percentage of capital per trade. Survival and consistency matter more than chasing quick gains. Proper position sizing and stop-loss discipline separate long-term traders from gamblers.
7. Risk Management Is the Real Edge
Many believe the edge lies in finding the perfect strategy. In reality, risk management is the true secret of spot forex success. Even a strategy with a modest win rate can be profitable if losses are controlled and winners are allowed to run.
Key principles include:
Fixed risk per trade
Favorable risk-to-reward ratios
Avoiding overtrading
Protecting capital during losing streaks
Traders who master risk management stay in the game long enough to benefit from experience and probability.
8. The Role of News and Fundamentals
Spot forex reacts instantly to economic data, central bank statements, and geopolitical events. Interest rate decisions, inflation reports, and employment numbers can cause sharp price movements within seconds.
The secret is not predicting news outcomes, but understanding expectations. Markets move based on how data compares to forecasts. Many professional traders either trade the volatility carefully or stay flat during high-impact news to avoid unpredictable spikes.
9. Psychology: The Invisible Battlefield
The most underestimated secret of spot forex trading is psychology. Fear, greed, impatience, and overconfidence sabotage more traders than poor analysis. Emotional trading leads to revenge trades, premature exits, and ignoring stop losses.
Successful traders develop mental discipline:
Accepting losses as part of business
Following a trading plan strictly
Detaching ego from outcomes
Focusing on process, not individual trades
Consistency in mindset leads to consistency in results.
10. Adaptability and Continuous Learning
The forex market evolves with changes in global economics, technology, and regulation. Strategies that worked in one environment may fail in another. The real secret is adaptability—reviewing trades, refining approaches, and staying informed.
Professional traders keep journals, analyze mistakes, and remain students of the market. Spot forex rewards those who respect its complexity and commit to long-term learning.
Conclusion
Spot forex trading is not a shortcut to instant wealth, nor is it a game of luck. Its “secrets” lie in understanding liquidity, respecting leverage, mastering risk management, reading price action, and maintaining psychological discipline. The global currency market offers immense opportunity, but only to those who approach it with patience, structure, and humility.
In the end, the true secret of spot forex is simple but demanding: treat trading as a profession, not a gamble, and let discipline—not emotion—guide every decision.

Forward and Futures Forex TradingUnderstanding the Backbone of Currency Risk Management and Speculation
Foreign exchange (forex) markets are the largest and most liquid financial markets in the world. Within this vast ecosystem, forward and futures forex trading play a critical role for governments, corporations, banks, hedge funds, and traders. These instruments go beyond simple spot currency exchange and allow market participants to manage risk, lock in prices, and speculate on future currency movements. Understanding how forwards and futures work is essential for anyone looking to grasp the deeper mechanics of global finance.
1. Introduction to Forex Derivatives
In forex trading, derivatives are contracts whose value is derived from an underlying currency pair, such as USD/INR, EUR/USD, or GBP/JPY. Forwards and futures are two of the most important derivative instruments. While both allow traders to agree on a currency exchange rate today for settlement at a future date, they differ significantly in structure, trading venue, flexibility, and risk management.
These instruments are especially important in a world where exchange rates are influenced by interest rates, inflation, geopolitical events, trade balances, and capital flows.
2. Forward Forex Contracts: Meaning and Structure
A forward forex contract is a private, over-the-counter (OTC) agreement between two parties to buy or sell a specific amount of currency at a predetermined exchange rate on a specified future date.
Key Characteristics of Forward Contracts
Customized contracts: Amount, maturity date, and currency pair are tailored to the needs of the parties involved.
OTC trading: Traded directly between banks, corporations, or financial institutions, not on an exchange.
No daily settlement: Profit or loss is realized only at maturity.
Counterparty risk: Since there is no central clearinghouse, there is a risk that one party may default.
3. Purpose of Forward Forex Trading
The primary purpose of forward contracts is hedging rather than speculation.
Corporate hedging: Importers and exporters use forward contracts to protect themselves from unfavorable currency movements.
Example: An Indian importer expecting to pay USD in three months may lock in today’s USD/INR rate using a forward contract.
Budget certainty: Businesses can plan cash flows with confidence.
Interest rate parity: Forward rates reflect the interest rate differential between two countries, not just market expectations.
While speculation is possible, forwards are typically used by large institutions due to their customized nature.
4. Advantages and Limitations of Forward Contracts
Advantages
Complete flexibility in contract terms
Effective protection against exchange rate volatility
Ideal for long-term and large-value transactions
Limitations
Counterparty default risk
Low liquidity (cannot be easily exited before maturity)
Limited transparency in pricing
5. Futures Forex Contracts: Meaning and Structure
A forex futures contract is a standardized agreement traded on a regulated exchange to buy or sell a specific currency at a predetermined price on a fixed future date.
Key Characteristics of Futures Contracts
Standardized size and maturity
Exchange-traded (such as CME or NSE in India)
Daily mark-to-market settlement
Clearinghouse guarantee, eliminating counterparty risk
Unlike forwards, futures contracts are designed for both hedgers and speculators.
6. How Forex Futures Trading Works
When a trader enters a futures contract:
They deposit an initial margin with the exchange.
Profits and losses are settled daily based on price movements.
If losses exceed a certain level, a margin call is issued.
For example, if a trader believes the USD will strengthen against the INR, they can buy a USD/INR futures contract. If the exchange rate rises, they profit; if it falls, they incur losses.
7. Uses of Forex Futures
Forex futures serve multiple purposes:
Hedging: Similar to forwards, but with higher liquidity and transparency.
Speculation: Traders attempt to profit from short-term or medium-term currency movements.
Arbitrage: Exploiting price differences between spot, futures, and forward markets.
Portfolio diversification: Currency futures can reduce overall portfolio risk.
Retail traders often prefer futures due to their regulated nature and ease of access.
8. Advantages and Limitations of Futures Contracts
Advantages
High liquidity
Transparent pricing
No counterparty risk due to clearinghouse
Easy entry and exit
Limitations
Lack of customization
Daily margin requirements can increase volatility risk
Contract sizes may not perfectly match hedging needs
9. Forward vs Futures: A Comparative Perspective
Aspect Forwards Futures
Trading venue OTC Exchange
Customization High Standardized
Counterparty risk Present Eliminated
Liquidity Low High
Margin requirement Usually none Mandatory
Users Corporates, banks Traders, hedgers, institutions
This comparison highlights why forwards dominate corporate hedging, while futures dominate trading and speculation.
10. Role in the Global Forex Market
Forward and futures markets influence:
Exchange rate expectations
Interest rate parity mechanisms
Central bank interventions
Capital flow decisions
In emerging markets like India, forex futures have grown rapidly due to increased participation by retail traders and institutional investors, while forwards remain crucial for exporters and importers.
11. Risks in Forward and Futures Forex Trading
Despite their benefits, both instruments carry risks:
Market risk: Adverse currency movements
Leverage risk (especially in futures)
Liquidity risk (more prominent in forwards)
Operational risk due to contract complexity
Proper risk management, position sizing, and understanding macroeconomic factors are essential.
12. Conclusion
Forward and futures forex trading form the foundation of modern currency risk management and speculation. Forwards provide flexibility and precision for businesses exposed to currency fluctuations, while futures offer transparency, liquidity, and safety for traders and investors. Together, they enhance market efficiency, stabilize cash flows, and allow participants to navigate the ever-changing dynamics of global currencies.
In a world shaped by interest rate cycles, geopolitical shifts, and global trade, mastering forward and futures forex trading is not just a technical skill—it is a strategic necessity for anyone involved in international finance or currency markets.

Emerging Market ProfitsUnlocking Growth Beyond Developed Economies
Emerging markets have become one of the most compelling engines of global economic growth in the 21st century. Countries across Asia, Latin America, Africa, the Middle East, and parts of Eastern Europe are transforming rapidly—industrializing, urbanizing, digitizing, and integrating into global trade and financial systems. For businesses, investors, and policymakers, emerging market profits represent not just higher returns, but access to the future drivers of global demand. However, these profits come with unique dynamics, opportunities, and risks that require deep understanding and strategic execution.
1. Understanding Emerging Markets
Emerging markets are economies that are in transition from low-income, less-developed status toward more advanced industrial and service-based structures. Examples include India, China, Brazil, Indonesia, Vietnam, Mexico, South Africa, and Nigeria. These markets are characterized by:
Faster GDP growth compared to developed economies
Rising middle-class populations
Increasing consumption and investment
Structural reforms and policy evolution
Profits in emerging markets are often fueled by catch-up growth, where productivity, income levels, and infrastructure improve rapidly from a low base.
2. Demographics as a Profit Multiplier
One of the strongest foundations of emerging market profits is demographics. Many emerging economies have:
Young populations
Expanding workforces
Rising urbanization
A young and growing population drives demand for housing, education, healthcare, consumer goods, financial services, and digital platforms. For companies, this translates into:
Long-term revenue visibility
Expanding customer bases
Higher volume-driven profitability
Unlike aging developed markets, emerging economies often enjoy decades of demographic tailwinds that support sustained profit growth.
3. Rising Incomes and Consumption Growth
As emerging markets grow, per capita incomes rise, creating powerful consumption cycles. Millions of people move from subsistence living into discretionary spending. This shift drives profits across sectors such as:
FMCG and retail
Automobiles and mobility
Consumer electronics
Travel, entertainment, and lifestyle services
Even small increases in income can lead to large increases in consumption, creating exponential growth opportunities for well-positioned businesses.
4. Cost Advantages and Operating Leverage
Emerging markets often offer lower costs of production, including:
Labor
Land
Raw materials
Operational overhead
Companies that manufacture or operate efficiently in these regions benefit from strong operating leverage. As revenues grow faster than costs, margins expand, leading to higher profitability. Global corporations frequently use emerging markets as:
Manufacturing hubs
Outsourcing centers
Global supply chain anchors
This cost competitiveness enhances profit margins while improving global market positioning.
5. Infrastructure and Industrialization Upside
Large-scale investments in infrastructure—roads, ports, power, telecom, and logistics—are a major profit catalyst. Governments in emerging markets actively invest in:
Transportation networks
Energy generation and distribution
Digital infrastructure
Infrastructure development unlocks productivity, reduces costs, and enables new industries. Companies involved in construction, capital goods, engineering, logistics, and energy often experience multi-year profit cycles aligned with national development agendas.
6. Digital Leapfrogging and Technology Profits
Unlike developed markets, emerging economies often leapfrog technologies. Instead of gradual adoption, they move directly to advanced digital solutions:
Mobile payments instead of traditional banking
E-commerce instead of physical retail expansion
Telemedicine instead of hospital-heavy models
This leapfrogging creates extraordinary profit opportunities for fintech, edtech, healthtech, and platform-based businesses. High scalability combined with low marginal costs enables rapid user growth and strong long-term profitability.
7. Financial Deepening and Capital Market Growth
As emerging economies mature, financial systems deepen. Credit penetration, insurance coverage, investment products, and capital markets expand. This benefits:
Banks and NBFCs
Asset management companies
Insurance providers
Fintech platforms
In early stages, even modest increases in financial inclusion can generate substantial profits. Over time, improving asset quality, fee income, and digital efficiency further enhance returns.
8. Valuation Advantage for Investors
From an investment perspective, emerging markets often trade at valuation discounts compared to developed markets due to perceived risks. For long-term investors, this creates:
Higher return potential
Margin of safety
Re-rating opportunities as economies stabilize
When growth visibility improves and reforms succeed, market valuations often expand, resulting in both earnings growth and multiple expansion, a powerful combination for profits.
9. Role of Reforms and Policy Evolution
Structural reforms—such as tax reforms, labor laws, ease of doing business initiatives, and privatization—play a crucial role in unlocking profits. Effective reforms:
Improve capital efficiency
Reduce compliance costs
Attract foreign investment
Enhance corporate governance
Countries that maintain policy stability and reform momentum tend to generate more sustainable and higher-quality profits over time.
10. Risks That Shape Profit Cycles
Emerging market profits are not linear. They are influenced by:
Currency volatility
Political and regulatory changes
Inflation and interest rate cycles
Global capital flow movements
Short-term disruptions can impact earnings, but companies with strong balance sheets, pricing power, and local understanding are better positioned to navigate volatility. Risk management is not about avoidance, but selectivity and patience.
11. Sectoral Leaders Drive Disproportionate Profits
In emerging markets, profits often concentrate among:
Market leaders
Companies with strong distribution networks
Firms aligned with long-term structural themes
Winner-takes-most dynamics are common. Identifying sector champions early can result in outsized profit compounding over long periods.
12. Long-Term Compounding Over Short-Term Noise
The true power of emerging market profits lies in long-term compounding. While quarterly earnings may fluctuate, structural growth trends unfold over decades. Investors and businesses that focus on:
Fundamentals
Scalability
Governance
Competitive advantage
are rewarded with sustained profit growth that often outpaces developed markets over complete economic cycles.
Conclusion: Profits Rooted in the Future
Emerging market profits are not merely about higher growth rates; they represent participation in the transformation of societies, economies, and consumption patterns. From demographic strength and digital leapfrogging to infrastructure expansion and financial deepening, these markets embody the future of global economic growth.
While risks exist, they are inseparable from opportunity. Those who approach emerging markets with discipline, patience, and a long-term vision can unlock profits that are not only higher, but more meaningful—driven by real economic progress and human development. In a world of slowing growth in developed economies, emerging market profits stand as one of the most powerful engines of global wealth creation.

Derivatives Market Made EasyWhat Is the Derivatives Market?
A derivative is a financial contract whose value depends on the price movement of another asset, known as the underlying asset. This underlying asset can be stocks, stock indices, commodities (like gold or crude oil), currencies, interest rates, or even cryptocurrencies. Unlike the cash market, where investors buy or sell the actual asset, in the derivatives market traders deal with contracts linked to the asset’s price.
For example, instead of buying 100 shares of a company, a trader may buy a futures or options contract based on that company’s share price. The value of the derivative changes as the price of the underlying asset moves.
Why Do Derivatives Exist?
Derivatives serve three main purposes:
Hedging (Risk Management)
Derivatives help businesses and investors protect themselves against adverse price movements. For instance, a farmer can lock in a price for crops using futures contracts, reducing uncertainty. Similarly, an investor can use options to protect a stock portfolio from market falls.
Speculation (Profit Opportunities)
Traders use derivatives to profit from price movements without owning the underlying asset. Because derivatives allow leverage, even small price changes can lead to significant gains (or losses).
Price Discovery and Market Efficiency
Derivatives markets help determine future prices based on current information and expectations, improving transparency and efficiency in financial markets.
Key Types of Derivatives
The derivatives market mainly consists of four instruments, but futures and options are the most widely used.
1. Futures Contracts
A futures contract is an agreement to buy or sell an underlying asset at a fixed price on a specified future date. Both buyer and seller are obligated to fulfill the contract.
For example, if a trader believes that crude oil prices will rise, they may buy a crude oil futures contract. If prices rise, the trader profits; if prices fall, the trader incurs a loss. Futures are standardized contracts traded on exchanges and require margin deposits.
2. Options Contracts
Options give the buyer the right, but not the obligation, to buy or sell an asset at a predetermined price before or on a specific date.
Call Option: Right to buy the asset
Put Option: Right to sell the asset
The buyer pays a premium to the seller (writer) of the option. Options are popular because they limit risk for buyers while offering flexible strategies for different market conditions.
3. Forwards
Forward contracts are similar to futures but are customized agreements traded over-the-counter (OTC). They are mostly used by institutions and corporations for hedging.
4. Swaps
Swaps involve exchanging cash flows or financial instruments, such as interest rate swaps or currency swaps. These are mainly used by large financial institutions.
Understanding Leverage and Margin
One of the most important features of the derivatives market is leverage. Leverage allows traders to control a large contract value with a relatively small amount of capital, known as margin.
For example, instead of paying the full value of ₹10 lakh worth of shares, a trader may only need to deposit ₹1 lakh as margin to trade a derivatives contract. While leverage magnifies profits, it also magnifies losses, making risk management crucial.
Role of Exchanges and Regulation
Derivatives are traded on regulated exchanges such as NSE and BSE in India or CME and NYSE globally. Exchanges standardize contracts, ensure transparency, and reduce counterparty risk through clearing corporations. Regulatory bodies monitor these markets to protect investors and maintain stability.
Common Participants in the Derivatives Market
Hedgers: Use derivatives to reduce risk
Speculators: Seek profits from price movements
Arbitrageurs: Exploit price differences between markets
Each participant plays a role in providing liquidity and efficiency to the market.
Advantages of the Derivatives Market
Efficient risk management
Lower capital requirement due to leverage
Ability to profit in rising, falling, or sideways markets
High liquidity and transparency
Risks Involved in Derivatives Trading
Despite its benefits, the derivatives market carries risks:
High leverage can cause rapid losses
Requires strong discipline and knowledge
Market volatility can lead to margin calls
Emotional trading can result in poor decisions
Therefore, education and risk control are essential before entering derivatives trading.
Derivatives Market for Beginners
For beginners, it is advisable to start with basic instruments like index futures or simple options strategies. Understanding the underlying asset, contract specifications, and risk-reward profile is critical. Paper trading and small position sizes help build confidence and experience.
Conclusion
The derivatives market may appear complicated, but at its foundation, it is simply a tool for managing risk and taking advantage of price movements. By understanding basic concepts such as futures, options, leverage, and hedging, anyone can grasp how derivatives work. When used wisely and responsibly, derivatives can be powerful financial instruments. However, they demand discipline, knowledge, and proper risk management. With the right approach, the derivatives market becomes not only easy to understand but also a valuable part of the modern financial system.

Cross-Border Payments: The Future of Global Money MovementUnderstanding Cross-Border Payments
At its core, a cross-border payment occurs when the payer and the recipient are located in different countries and the transaction involves at least two different currencies or financial systems. Examples include an Indian exporter receiving payment from a US buyer, a migrant worker sending money to family back home, or a multinational company paying overseas suppliers.
Unlike domestic payments, cross-border payments must navigate differences in currencies, banking regulations, time zones, compliance standards, and settlement systems. This makes them slower, costlier, and more complicated than local transactions.
How Cross-Border Payments Work
Traditional cross-border payments are typically processed through correspondent banking networks. In this system, banks maintain relationships with foreign banks (correspondent banks) to facilitate international transfers. When a payment is initiated, it may pass through multiple intermediary banks before reaching the final beneficiary. Each intermediary charges a fee and adds processing time.
The SWIFT (Society for Worldwide Interbank Financial Telecommunication) network plays a major role by providing secure messaging between banks. However, SWIFT itself does not move money; it only sends payment instructions. Actual fund settlement happens through bank accounts held across borders.
In recent years, alternative mechanisms have emerged, including fintech platforms, digital wallets, and blockchain-based systems, which aim to simplify and speed up cross-border transfers.
Key Participants in Cross-Border Payments
Several entities are involved in the cross-border payment ecosystem:
Banks and Financial Institutions: Provide traditional wire transfers and trade finance services.
Payment Service Providers (PSPs): Companies like PayPal, Wise, and Stripe offer faster and more transparent international payments.
Central Banks: Regulate currency flows and oversee payment systems.
Clearing and Settlement Systems: Ensure final transfer of funds between institutions.
Businesses and Individuals: End users such as exporters, importers, freelancers, students, and migrant workers.
Costs and Fees in Cross-Border Payments
One of the biggest challenges in cross-border payments is cost. Fees may include:
Transfer fees charged by banks or PSPs
Currency conversion or foreign exchange (FX) margins
Intermediary bank charges
Compliance and documentation costs
For small-value transactions like remittances, these costs can be disproportionately high. Reducing fees has become a global priority, especially for developing economies where remittances are a major source of income.
Speed and Transparency Issues
Traditional cross-border payments can take anywhere from one to five business days to settle. Delays occur due to manual processing, time zone differences, compliance checks, and multiple intermediaries. Additionally, senders often lack transparency on where their money is during the transfer process and what total fees will be deducted.
Modern digital payment platforms are addressing these issues by offering near real-time transfers, upfront fee disclosure, and end-to-end tracking.
Regulatory and Compliance Challenges
Cross-border payments are subject to strict regulatory requirements, including anti-money laundering (AML), combating the financing of terrorism (CFT), and know-your-customer (KYC) rules. Each country has its own regulatory framework, which can create friction and increase compliance costs.
Sanctions, capital controls, and geopolitical tensions further complicate cross-border transactions. Financial institutions must continuously monitor regulatory changes to avoid penalties and ensure smooth operations.
Role of Technology in Cross-Border Payments
Technology is transforming the cross-border payments landscape. Fintech innovations are reducing reliance on correspondent banking and improving efficiency. Key technological trends include:
Blockchain and Distributed Ledger Technology (DLT): Enables faster settlement and reduced intermediaries.
Application Programming Interfaces (APIs): Allow seamless integration between payment systems.
Real-Time Payment Networks: Enable instant or near-instant transfers across borders.
Artificial Intelligence (AI): Enhances fraud detection and compliance monitoring.
These innovations are making cross-border payments more accessible, especially for small businesses and individuals.
Cross-Border Payments and Global Trade
International trade depends heavily on efficient cross-border payment systems. Exporters need timely payments to manage cash flows, while importers seek secure and cost-effective settlement options. Trade finance instruments such as letters of credit, bank guarantees, and documentary collections are closely linked to cross-border payment mechanisms.
Efficient payment systems reduce transaction risks, improve trust between trading partners, and support global supply chains.
Importance of Cross-Border Remittances
Remittances are one of the most significant components of cross-border payments, particularly for emerging economies. Millions of migrant workers send money home regularly to support families, education, healthcare, and housing. These flows contribute significantly to national income and economic stability.
Improving the affordability and speed of remittance services can have a direct positive impact on financial inclusion and poverty reduction.
The Future of Cross-Border Payments
The future of cross-border payments is moving toward greater speed, lower cost, and enhanced transparency. Central bank digital currencies (CBDCs), global payment interoperability, and standardized compliance frameworks are expected to play a major role.
Collaboration between banks, fintech firms, regulators, and international organizations will be crucial in building efficient global payment infrastructure. As technology evolves, cross-border payments are likely to become as seamless as domestic transactions.
Conclusion
Cross-border payments are a vital pillar of the global financial system, enabling trade, investment, and personal financial connections across nations. While traditional systems face challenges related to cost, speed, and complexity, technological innovation and regulatory cooperation are driving meaningful improvements. As the world becomes more interconnected, efficient and inclusive cross-border payment systems will be essential for sustainable global economic growth.
