Tesla Stock Lifts 2025 Gains to 20% as Traders Eye Santa RallyA megacap squeezing in one more rally before year-end? Yes, please.
🚗 A Holiday Glide Higher for Tesla Shares
Tesla NASDAQ:TSLA is heading into December with solid momentum. Coming into Monday, the stock has risen 20% since January, putting it on track for a third straight annual gain .
Inv

The best trades require research, then commitment.
Get started for free$0 forever, no credit card needed

Scott "Kidd" PoteetThe unlikely astronaut

Where the world does markets
Join 100 million traders and investors taking the future into their own hands.

GBPUSD: Rallies Are Getting Sold, & Dollar Still Has Upper HandEvery time GBPUSD tries to lift its head, it seems to run straight into supply. Zooming out, this chart feels like a classic distribution phase after a strong first-half rally. Fundamentally, that makes sense. Sterling has lost its earlier policy edge, while the dollar continues to benefit from re

Velocity Of Money Rolling Over Again!The Real Interpretation
This chart is telling one story:
Money supply growth has massively outpaced real output for decades.
It lines up perfectly with:
Falling real productivity
Stagnant wages
Declining borrower quality
Rising debt-to-GDP
Asset inflation decoupling from fundamentals
T

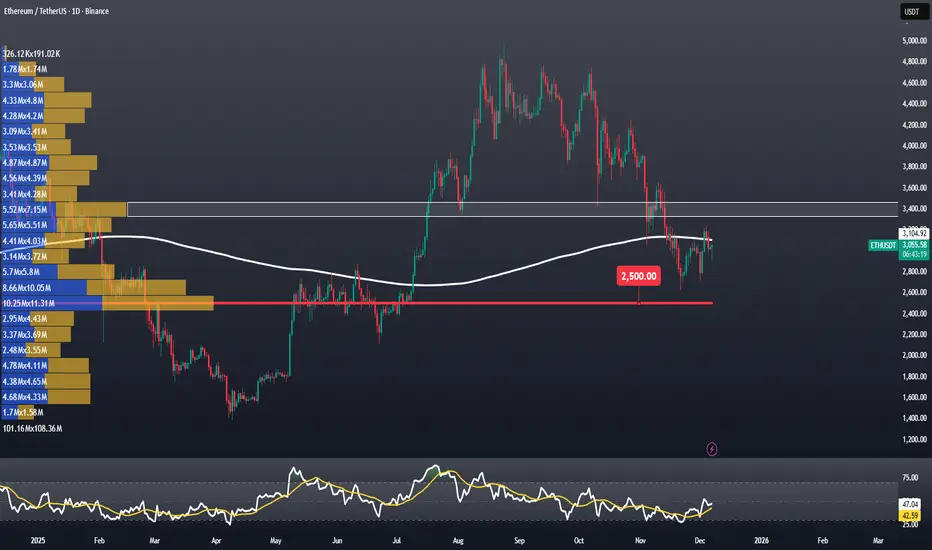
Why Does Ethereum Need a Weekly Close Above $3,100?Why Does Ethereum Need a Weekly Close Above $3,100?
Ethereum is currently trading around $3,035, while the SMA365 sits near $3,100. A weekly close above this level would give ETH investors some breathing room. If ETH can secure a close above the SMA365, we could expect a relief rally toward $3,689,
GOLD 1H CHART ROUTE MAP UPDATE & TRADING PLAN FOR THE WEEKHey Everyone,
Please see our 1h chart levels and targets for the coming week, which is still active and in play.
We are seeing price play between two weighted levels with a gap above at 4221 and a gap below at 4169, as support. We will need to see ema5 cross and lock on either weighted level to de

IBEX 35 Hits Historic LevelIBEX 35 Hits Historic Levels, Facing the Challenge of Winning Back Retail Investors
Ion Jauregui – Analyst at ActivTrades
01/12/2025
The IBEX 35 has officially returned to territory unseen since 2007. The Spanish benchmark is trading at historic highs and has established itself in 2025 as the b

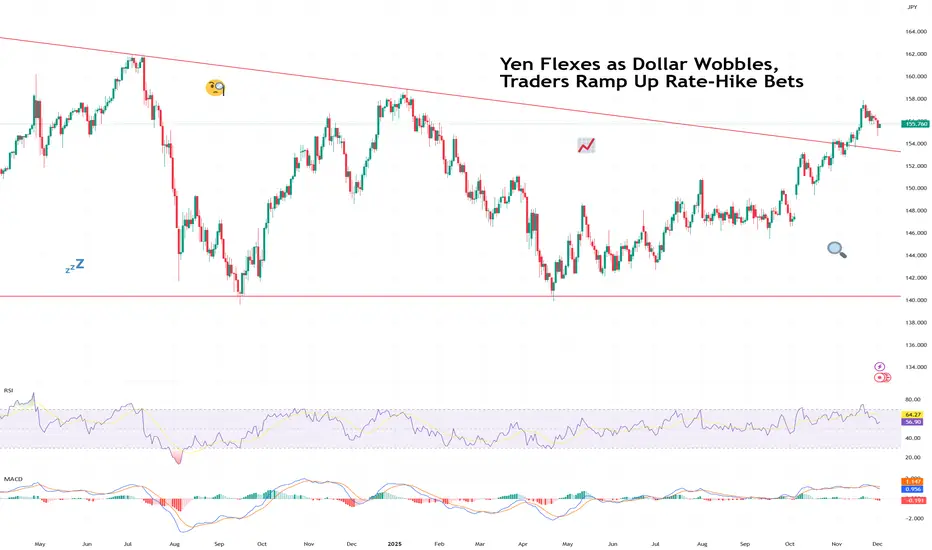
Yen Flexes as Dollar Wobbles, Traders Ramp Up Rate-Hike BetsThe yen came into Monday looking calm… and then proceeded to bench-press the dollar.
The FX:USDJPY pair slid under ¥155, hitting a session low of ¥154.65, after BoJ Governor Kazuo Ueda dropped one of the most powerful phrases in global FX:
“We will weigh the pros and cons of tightening.”
In Tok
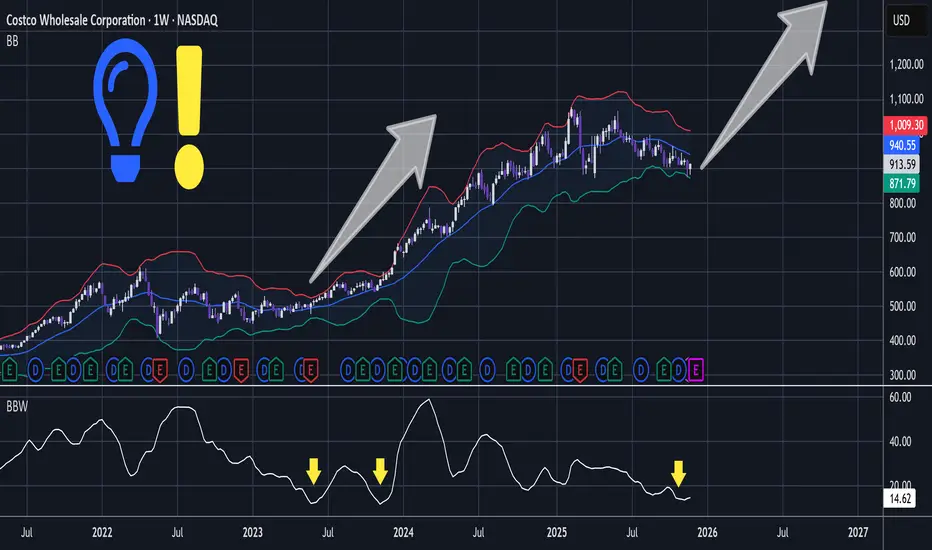
COST - Retail Powerhouse In Ideal HTF PositionShallow compressive action has printed contracting Bollinger Bands.
Notice that the BBW - Bollinger Band Width is similar to the previous correction before breakout.
In lower time frame the significantly sized slump has whipsawed through support and wedge trendline to become a bullish engulf:
T
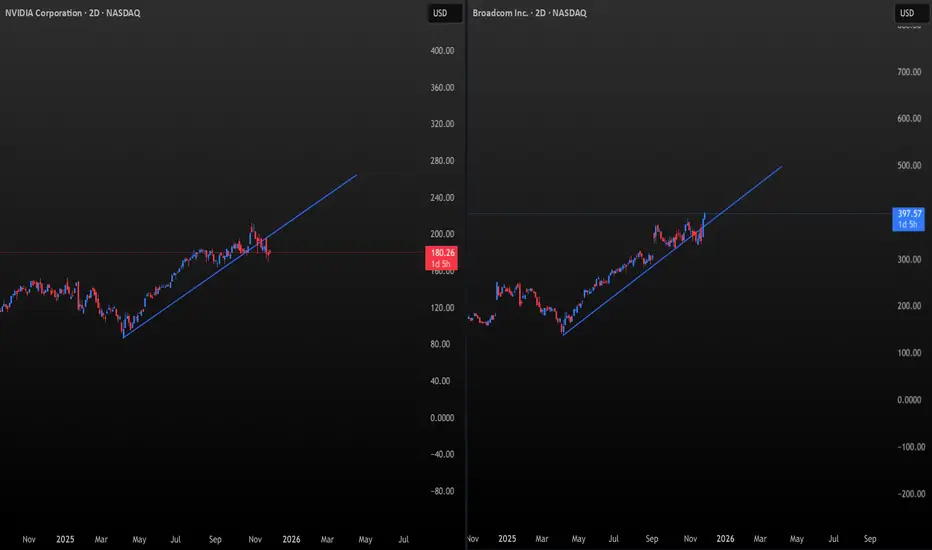
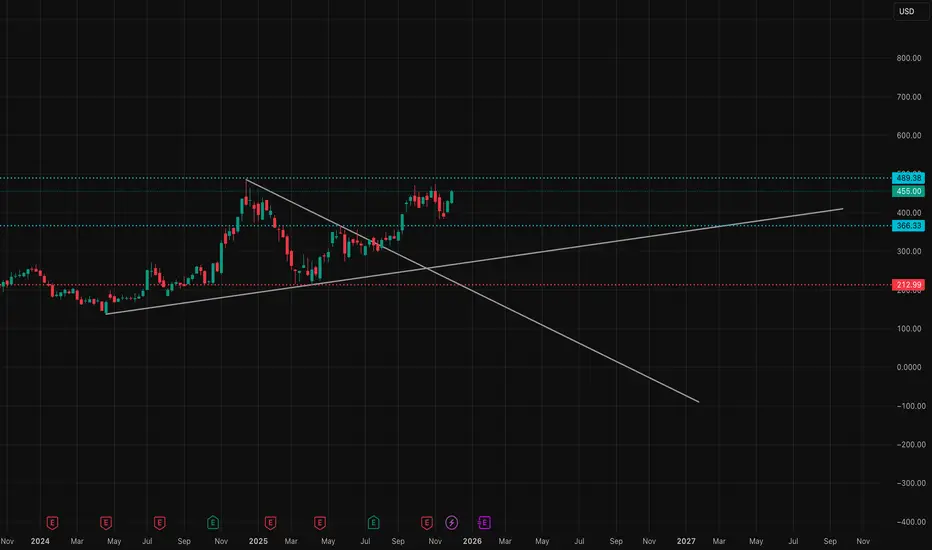
NVDA vs AVGO: The Battle for the AI Throne Has Begun⚡A New Leader Emerges in the Semiconductors
For years, NVDA was the undisputed titan — the gravitational center of the semiconductor universe.
But now, the geometry tells a different story.
THE CHARTS 📐
Both charts use the same natural scaling:
1° of time = $1 of price per unit.
And here’s the
SPX to Money Supply WARNING!If the charts aren’t showing bubble setups, I’m not going to invent them. I post what the data shows. So please don’t shoot the messenger when I say GTFO & STFO.
And just to keep the facts straight:
Brokerage, stock, and crypto accounts are not part of M2.
Why does M2 matter?
It’s the actual spe

See all editors' picks ideas
Volume Gaps & Imbalances (Zeiierman)█ Overview
Volume Gaps & Imbalances (Zeiierman) is an advanced market-structure and order-flow visualizer that maps where the market traded, where it did not, and how buyer-vs-seller pressure accumulated across the entire price range.
The core of the indicator is a price-by-price volume prof

Match Finder [theUltimator5]Match Finder is the dating app of indicators. It takes your current ticker and finds the most compatible match over a recent time period. The match may not be Mr. right, but it is Mr. right now. It doesn't forecast future connection, but it tells you current compatibility for today.
Jokes aside,

Trend Line Methods (TLM)Trend Line Methods (TLM)
Overview
Trend Line Methods (TLM) is a visual study designed to help traders explore trend structure using two complementary, auto-drawn trend channels. The script focuses on how price interacts with rising or falling boundaries over time. It does not generate trade sign

Breakouts & Pullbacks [Trendoscope®]🎲 Breakouts & Pullbacks - All-Time High Breakout Analyzer
Probability-Based Post-Breakout Behavior Statistics | Real-Time Pullback & Runup Tracker
A professional-grade Pine Script v6 indicator designed specifically for analyzing the historical and real-time behavior of price after strong All-Ti

Count█ OVERVIEW
A library of functions for counting the number of times (frequency) that elements occur in an array or matrix.
█ USAGE
Import the Count library.
import joebaus/count/1 as c
Create an array or matrix that is a `float`, `int`, `string`, or `bool` type to count elements from, t

Holographic Market Microstructure | AlphaNattHolographic Market Microstructure | AlphaNatt
A multidimensional, holographically-rendered framework designed to expose the invisible forces shaping every candle — liquidity voids, smart money footprints, order flow imbalances, and structural evolution — in real time.
---
📘 Overview
The Hol

PriceFormatLibrary for automatically converting price values to formatted strings
matching the same format that TradingView uses to display open/high/low/close prices on the chart.
█ OVERVIEW
This library is intended for Pine Coders who are authors of scripts that display numbers onto a user's charts. T

LogNormalLibrary "LogNormal"
A collection of functions used to model skewed distributions as log-normal.
Prices are commonly modeled using log-normal distributions (ie. Black-Scholes) because they exhibit multiplicative changes with long tails; skewed exponential growth and high variance. This approach i

Range Oscillator (Zeiierman)█ Overview
Range Oscillator (Zeiierman) is a dynamic market oscillator designed to visualize how far the price is trading relative to its equilibrium range. Instead of relying on traditional overbought/oversold thresholds, it uses adaptive range detection and heatmap coloring to reveal where pri

Volume Surprise [LuxAlgo]The Volume Surprise tool displays the trading volume alongside the expected volume at that time, allowing users to spot unexpected trading activity on the chart easily.
The tool includes an extrapolation of the estimated volume for future periods, allowing forecasting future trading activity.
🔶 U

See all indicators and strategies
Community trends
Netflix Paramount - Acquisition war - What You need to know. Netflix is selling off because it announced a massive, high‑risk acquisition of major Warner Bros. Discovery assets — and the market hates the price, the leverage, and the regulatory risk.
The bid is in the range of $72-$82 Billion.
Trump tweeted last night putting the deal under scrutiny.
This

Alphabet - The exceptional short setup!🔒Alphabet ( NASDAQ:GOOG ) is reversing right now:
🔎Analysis summary:
Alphabet is clearly indicating a major bearish move. With the current retest of major resistance, Alphabet is slowly reversing. Since Alphabet is also massively overextended, really everything is pointing towards a move lowe

I Found a Pattern in $AI That Shouldn’t Exist. 45–46 (late 2026)I’ve been studying NYSE:AI ’s entire 2025 price cycle, and what I found is pretty interesting.
The entire downtrend wasn’t random, it behaved like a damped harmonic oscillator.
First drop: –28
Second drop: –15
Third drop: –7
Each decline was almost exactly 50% of the previous one.
Same t

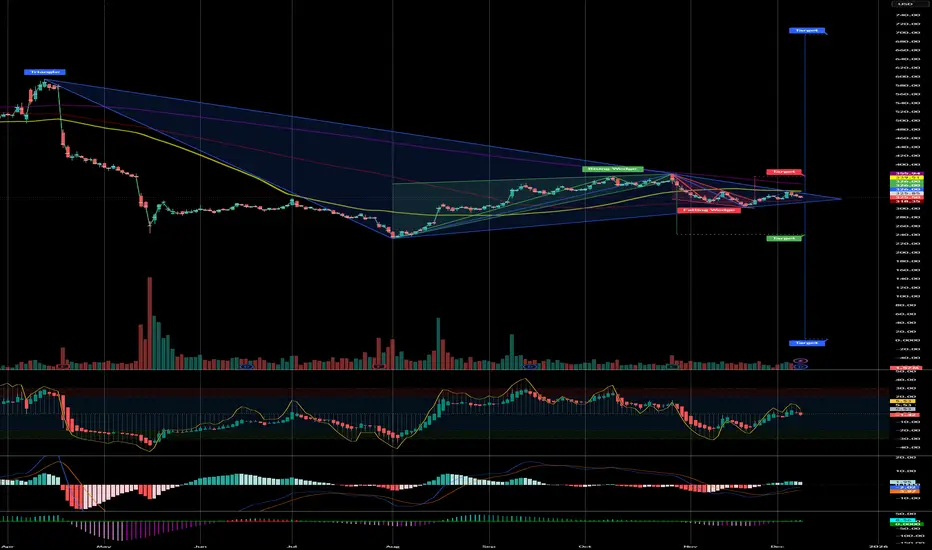
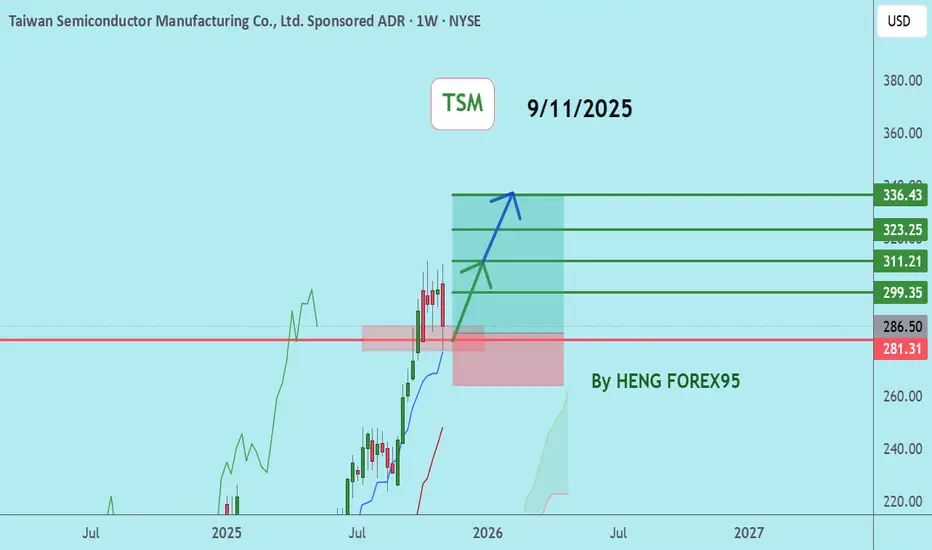
TSMTaiwan Semiconductor Manufacturing Company Limited (TSM) pioneered the pure-play foundry business model and has consistently emerged as a global leader in specialty semiconductor foundries.
The overall trend remains bullish, but the price is currently undergoing a short-term correction. The price i
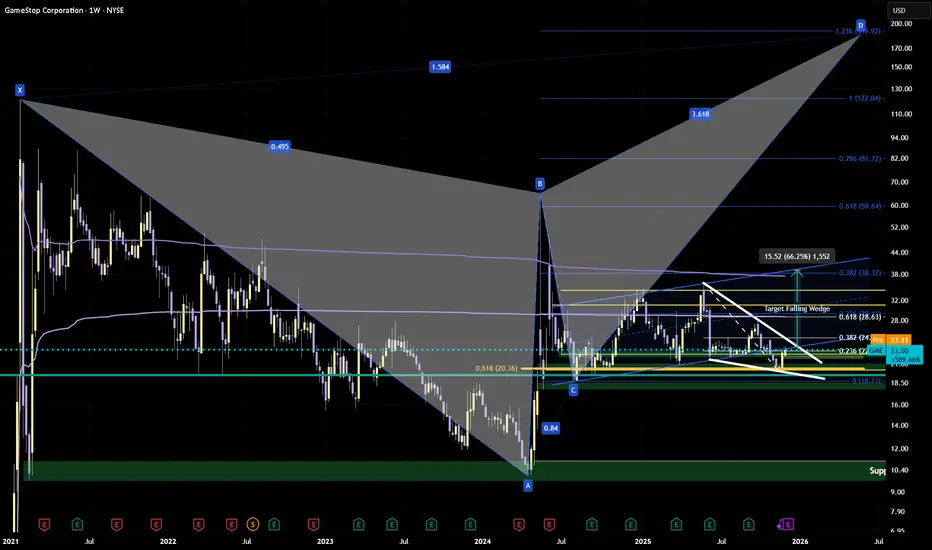
GME: Falling Wedge + Fib area’s + Character loop + Bearish CrabWe're sitting at a juicy confluence right now — the 0.618 fib from the 2024 low-to-high AND the 0.236 from the 2025 high-to-low. When fibs stack, they have my attention.
The Falling Wedge
Classic bullish pattern forming since the end of May: price coiling tighter between converging trendlines.
•
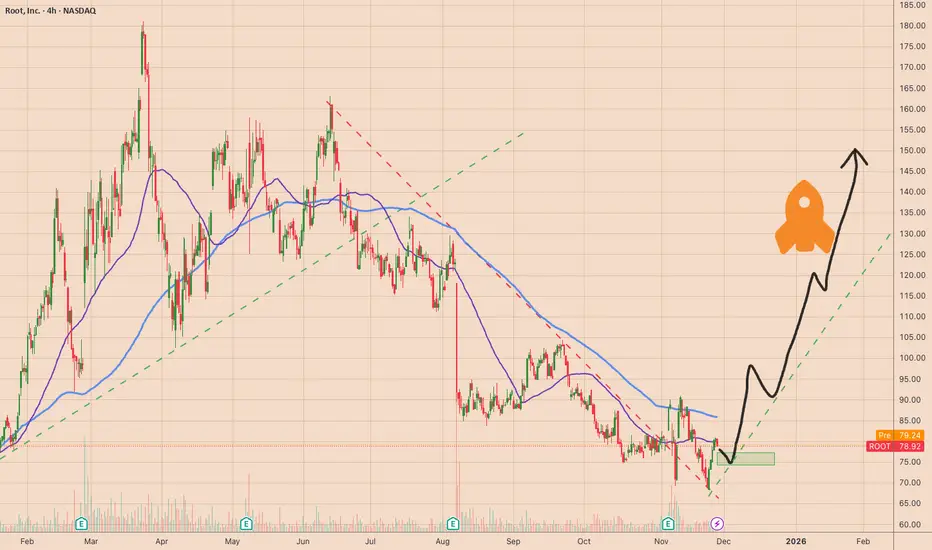
ROOT AI powered Insurance company BREAKOUT!2025 has seen explosive gains in companies building AI infrastructure — data centers, chips, and networking. But the next wave of opportunity may lie in the industries that unlock real productivity and profit improvements from adopting AI.
Insurance is a prime example. Historically, insurers have b
Tesla Stock Lifts 2025 Gains to 20% as Traders Eye Santa RallyA megacap squeezing in one more rally before year-end? Yes, please.
🚗 A Holiday Glide Higher for Tesla Shares
Tesla NASDAQ:TSLA is heading into December with solid momentum. Coming into Monday, the stock has risen 20% since January, putting it on track for a third straight annual gain .
Inv
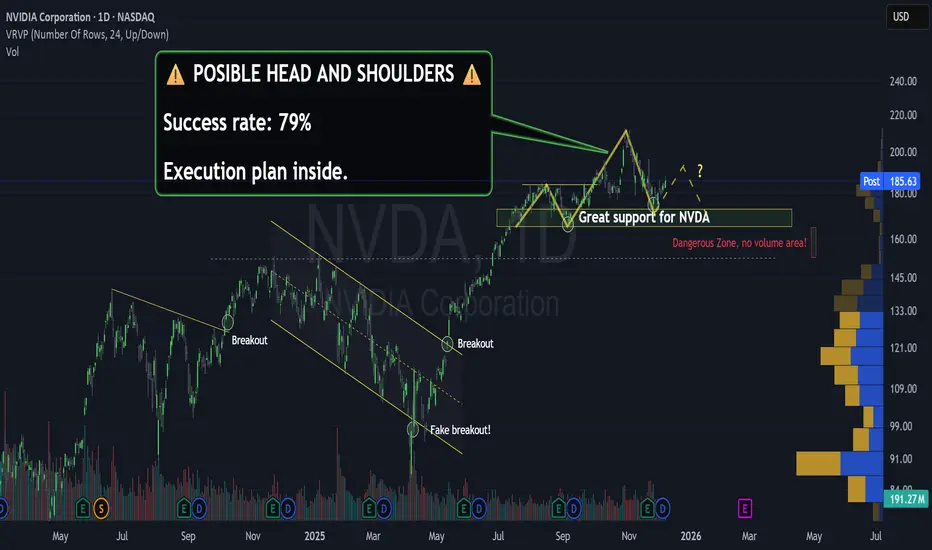
NVDA Is Creating The More Bearish PatternNVDA Is Creating The More Bearish Pattern
The NASDAQ:NVDA chart is currently screaming something that most retail investors, blinded by the AI narrative, are choosing to ignore. While the fundamental sentiment remains bullish, the price structure on the daily timeframe is carving out one of the
TSLA – Dec 8–12: Breakout or Breakdown Week TSLA – Dec 8–12: Breakout or Breakdown Week (Full Technical Outlook + GEX Insight)
TSLA sits at a major decision point heading into the week. The trend beneath is still constructive, but price is now pressing directly into the 456–474 supply zone, a region that has repeatedly capped upside. How TSLA
See all stocks ideas
Today
E
ELWTElauwit Connection, Inc.
Actual
−0.03
USD
Estimate
−0.01
USD
Today
CALCaleres, Inc.
Actual
—
Estimate
0.85
USD
Today
KFYKorn Ferry
Actual
—
Estimate
1.31
USD
Today
DBIDesigner Brands Inc.
Actual
—
Estimate
0.18
USD
Today
TBHCThe Brand House Collective, Inc
Actual
—
Estimate
−0.42
USD
Today
PLCEChildren's Place, Inc. (The)
Actual
—
Estimate
0.70
USD
Today
SAILSailPoint, Inc.
Actual
—
Estimate
0.06
USD
Today
LELands' End, Inc.
Actual
—
Estimate
0.17
USD
See more events
Today
J
JMGJM Group Ltd.
Exchange
AMEX
Offer price
4.00 - 5.00
USD
Tomorrow
CDNLCardinal Infrastructure Group Inc.
Exchange
NASDAQ
Offer price
20.00 - 22.00
USD
Dec 11
LMRILumexa Imaging Holdings Inc.
Exchange
NASDAQ
Offer price
17.00 - 25.00
USD
Dec 12
S
SFDXSFIDA X Inc.
Exchange
NASDAQ
Offer price
5.00 - 6.00
USD
Dec 12
W
WLTHWealthfront Corp.
Exchange
NASDAQ
Offer price
12.00 - 14.00
USD
Dec 15
ELCGELC Group Holdings Ltd.
Exchange
NASDAQ
Offer price
4.00 - 6.00
USD
Dec 15
DTDTDt House Ltd.
Exchange
NASDAQ
Offer price
4.00 - 5.00
USD
See more events
Community trends
Bitcoin - Sell this upcoming pump! New Bear Flag - Target 74k!I am currently bullish on Bitcoin in the short term, and I believe Bitcoin will hit 96k, probably this week. The current price is around 91k, so this is definitely a good opportunity to sell or open a short position at 96k on futures because later this month/in January Bitcoin will most likely conti

BTCUSDT Long: Demand Line Holds — Path Toward 96,500 Opens UpHello, traders! BTCUSDT is respecting the Triangle Demand Line after completing a full bearish cycle inside the descending channel earlier. Sellers maintained control for an extended period, pushing price steadily lower until it reached the pivot point near 88,800, where buyers finally stepped in an

Bitcoin: Critical Levels Ahead, $106k or $65kHi guys!
The current BTC structure displays a textbook Three Drives Pattern, followed by visible momentum weakness. After the first, second, and third drives completed, price failed to create higher highs, confirming exhaustion. This aligns with the RSI divergence, which began forming during the se

Lingrid | BTCUSDT Potential Bullish Trend Continuation SetupBINANCE:BTCUSDT is holding above the trendline after defending the higher-low zone, keeping the broader bullish structure intact. The recent pullback swept short-term liquidity before price stabilized near the 89,000 support band, where buyers stepped back in. This behavior suggests the move lower

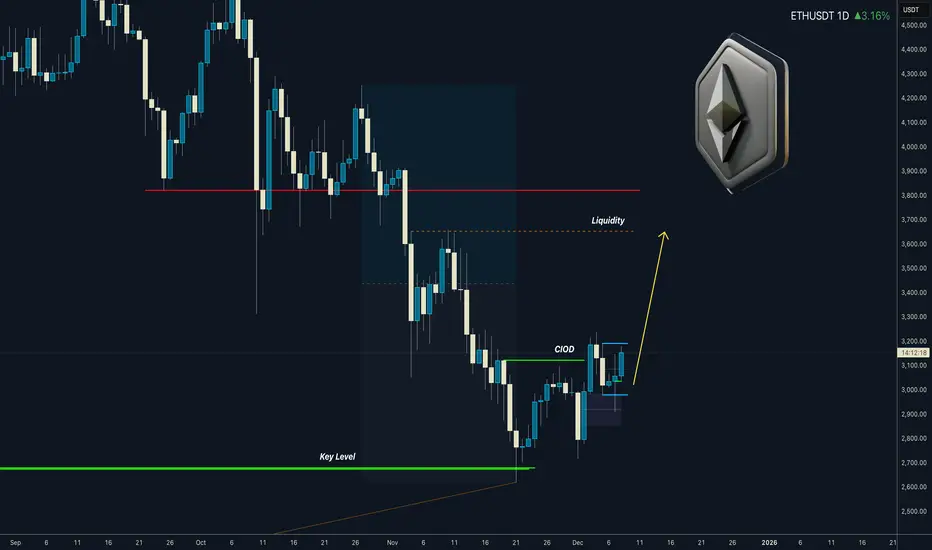
Ethereum path to 3600 is open Ethereum is bouncing from weekly key level. We got Change in Order flow on daily and Daily CLS range activated. It looks clearly like we can go to $3600 Liquidity in the premium.
HTF View I promised myself I’d become the person I once needed the most as a beginner. Below are links to a powerfu
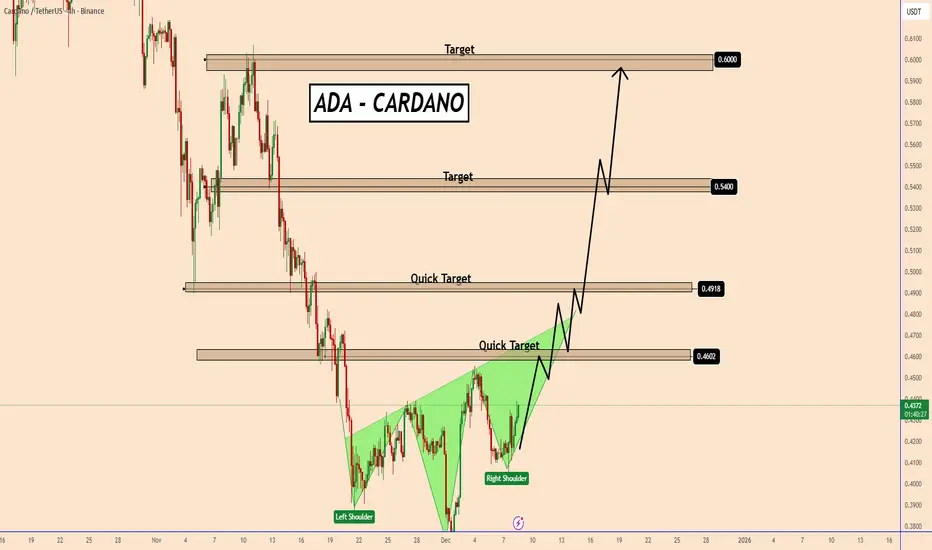
ADA: Cardano Near Breakout: H&S Reversal Pattern in PlayADA: Cardano Near Breakout: H&S Reversal Pattern in Play
ADA is about to complete and reverse the Head and Shoulders pattern. The price is currently rising to test the neckline of the pattern, which is also the strongest area for buyers.
Once this area is broken, we can see ADA rising in a clear
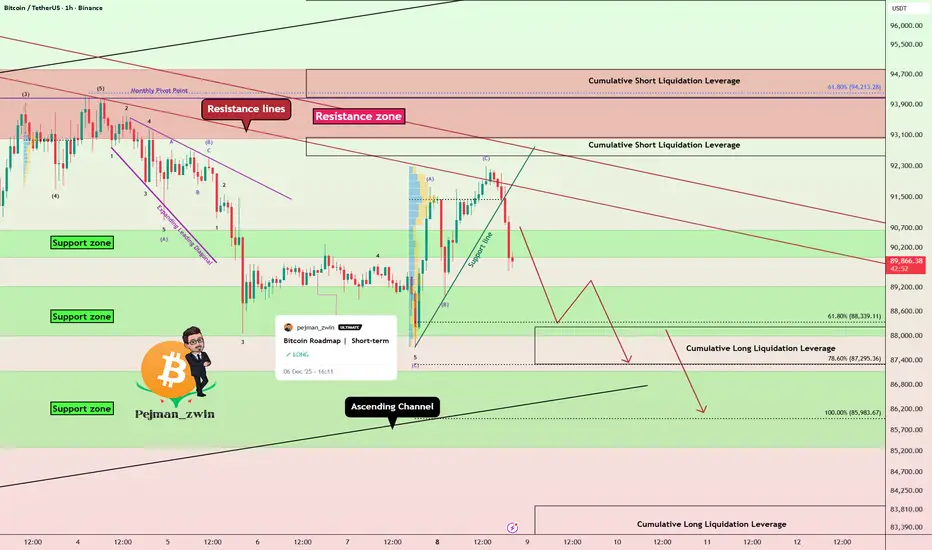
Bitcoin Breakdown After Perfect Bounce — Short Setup LoadingAs I expected , Bitcoin bounced from the support zone and reached its targets.
Right now, Bitcoin has rejected from resistance lines and successfully broke both the support line and the support zone($90,650-$90,000).
From an Elliott Wave perspective, it appears that Bitcoin has completed a ZigZag
BTCUSDT: Failed Recovery Opens Path to 87,000 SupportHello everyone, here is my breakdown of the current BTCUSDT setup.
Market Analysis
BTCUSDT is trading inside a broader ascending channel, but the recent price action shows clear signs of weakness near the upper structure. Price previously attempted a breakout above the 90,000 Resistance Zone, how

ALCTCOIN SEASON? OTHERS MARKETCAP 1w ALCTCOIN SEASON? OTHERS MARKETCAP 1w
2022–2025: Horizontal Compression + Higher Lows
The highlighted yellow structure is a classic Higher Lows Compression Pattern:
-Each retest forms a higher low on the macro trend
-RSI repeatedly bounced from the oversold midline zone
-Price consolidated side

The Market Awaits the Fed to Set the TrendHi everyone, Domic here again.
On the chart, ETH is still holding its short-term uptrend as the 34 EMA (red) remains above the 89 EMA (blue), but the bullish momentum has clearly slowed down. Price is hovering just above both EMAs without forming any widening angle, while the EMAs themselves are b

See all crypto ideas
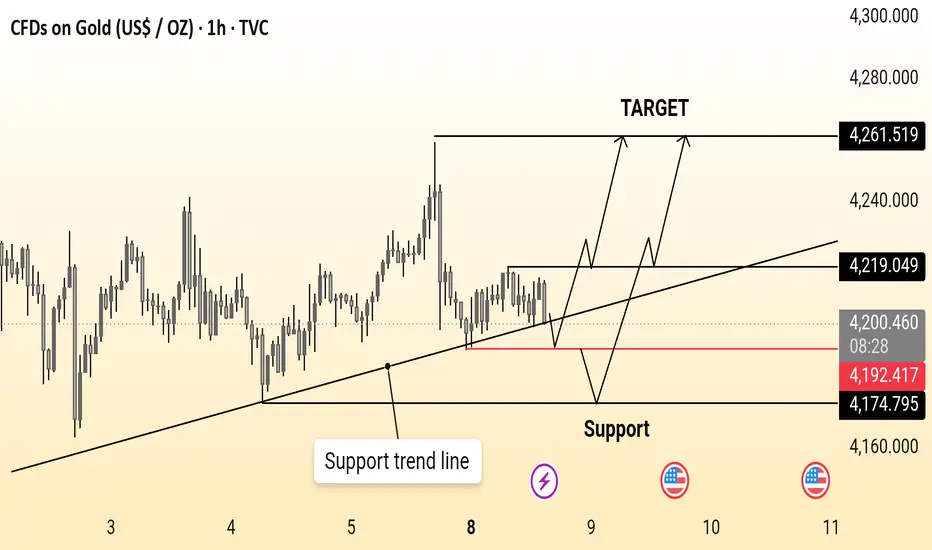
GOLD 1H CHART ROUTE MAP UPDATE & TRADING PLAN FOR THE WEEKHey Everyone,
Please see our 1h chart levels and targets for the coming week, which is still active and in play.
We are seeing price play between two weighted levels with a gap above at 4221 and a gap below at 4169, as support. We will need to see ema5 cross and lock on either weighted level to de
Lingrid | GOLD Weekly Analysis: Calm Before the Fed-Driven StormOANDA:XAUUSD price action this week has been a masterclass in consolidation, trading in a tight, choppy range just around $4,200 technical level. This sideways movement is not a sign of weakness but rather a necessary pause after the recent parabolic rally, allowing traders to digest gains and buil

XAUUSD: Buying Pressure Aims for the $4,260 ResistanceHello everyone, here is my breakdown of the current Gold (XAUUSD) setup.
Market Analysis
Gold continues to trade within a broader bullish structure, with price action developing inside a well-defined ascending channel. After the previous impulse move higher, the market entered a consolidation pha

Gold Price Update – Clean & Clear Explanation✅ Gold where the market has been moving inside repeated zones of support and resistance. You can clearly see that price has been bouncing between these grey areas, which act like barriers that stop the market from moving too far in one direction without a reaction.
🤙At the right side of the chart,
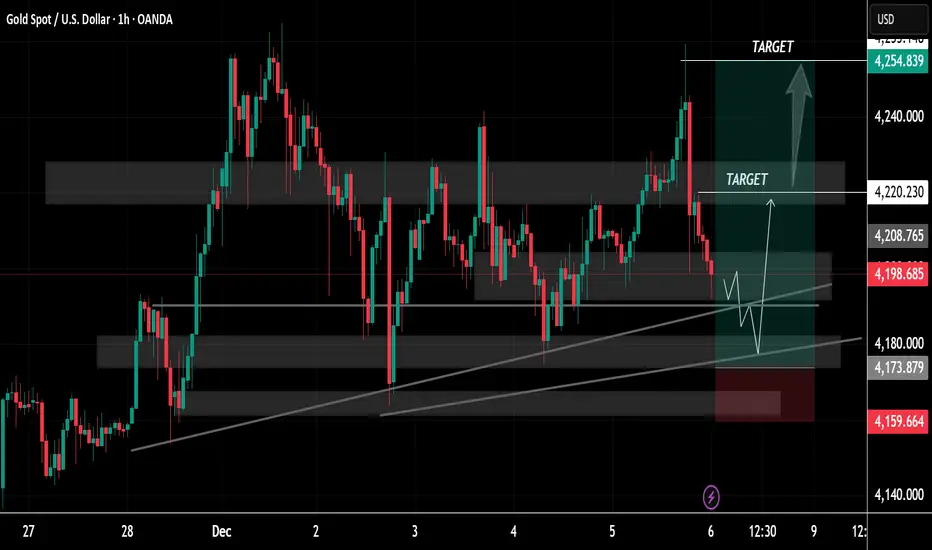
XAUUSD Bullish Trend in Play — Path Open Toward 4,300 TargetHello traders! Here’s my technical outlook on XAU/USD (Gold) based on the current market structure. Gold remains in a broader bullish trend, supported by a clearly defined rising Trend Line that has guided price action since the beginning of the impulsive move. After the initial breakout from the Su

THE KOG REPORTTHE KOG REPORT:
In last week’s KOG Report we said we would look for the price to tap into the lower level where we wanted a bounce to then target the red box above. We managed to get that long into the defence level for it to give us a nice tap and bounce again giving the short and following the

Gold ideaGold (1H) is holding above a rising support trend line, maintaining a bullish structure. As long as price stays above the 4,174–4,192 support zone, a move toward 4,261 remains likely.
GOLD → Retest of upward trend support. Focus on 4200FX:XAUUSD is trading near $4,200, remaining cautious at the start of the week ahead of the Fed's decision. The trend is bullish, with the dollar stagnating. A long squeeze of support could trigger a rebound...
The Fed is expected to cut rates by 25 bps (probability ≈90%). Weak US data supports

GOLD Current Consolidation range remains bullishGold Consolidation bullish range after price holds the support manage bulls the signal the end of consolidation and start of the next up side.
Gold prices hovered near $4,200/oz on Monday, stabilizing after last week’s decline as traders awaited the Federal Reserve’s final policy meeting of the yea

Gold 1H – Will 4232 Trap Liquidity or 4170 Spark Expansion?🟡 XAUUSD – Intraday Smart Money Plan | by Ryan_TitanTrader (08/12)
📈 Market Context
Gold trades inside politically-driven liquidity as Donald Trump signals that the current method of tariffing through the US Supreme Court is “more direct, less cumbersome, and much faster.”
This introduces fresh unc

See all futures ideas
EURUSD I Daily CLS I Model 2- CountertrendHi friends, new range created. As always we are looking for the manipulation in to the key level around the range. Don't forget confirmation switch from manipulation phase to the distribution phase to make the setup valid. Stay patient and enter only after change in order flow. If price reaches Its

USD/JPY - Interest Rate Ahead! (08.12.2025) 📝 Description FX:USDJPY
USD/JPY continues to respect the Bearish Channel Pattern, with price rejecting the upper boundary and failing to break the resistance zone. Combined with strong fundamentals—expected Fed rate cut and potential BoJ tightening—the setup favors downside movement.
A break and

EURUSD Rising Channel Intact as Price Targets 1.16800 ResistanceHello traders! Here’s my technical outlook on EUR/USD based on the current market structure. After an earlier breakout from the lower consolidation area, the price entered a steady ascending channel, forming a sequence of higher highs and higher lows while respecting the rising Support Line. The pre

Big Week for USD: USDJPY Approaches Major Sell Zone!Hey Traders,
In today's trading session we are monitoring USDJPY for a selling opportunity around the 155.750 zone. USDJPY is trading in a downtrend and is currently in a correction phase, approaching the trend area at 155.750, which acts as a key support-turned-resistance level.
On the fundamenta

GBPUSD: Rallies Are Getting Sold, & Dollar Still Has Upper HandEvery time GBPUSD tries to lift its head, it seems to run straight into supply. Zooming out, this chart feels like a classic distribution phase after a strong first-half rally. Fundamentally, that makes sense. Sterling has lost its earlier policy edge, while the dollar continues to benefit from re
08.12.25 Daily ForecastPairs on Watch -
FX:CADJPY
FX:AUDJPY
FX:AUDUSD
FX:EURGBP
A short overview of the instruments I am looking at for today, multi-timeframe analysis down to what I will be looking at for an entry. Enjoy!

USDJPY 30-Min — Volume Buy & sell Reversal Triggered⚡Base : Hanzo Trading Alpha Algorithm
The algorithm calculates volatility displacement vs liquidity recovery, identifying where probability meets imbalance.
It trades only where precision, volume, and manipulation intersect —only logic.
✈️ Technical Reasons
/ Direction — LONG / Reversal 155.100 Are

USDJPY Market Update & Technical OutlookUSD/JPY where the market has been moving inside a long downward trend. The chart has a clear descending trendline drawn from previous highs, showing that sellers were controlling the market for several days. However, price has now reached an important support zone, and instead of continuing downwar

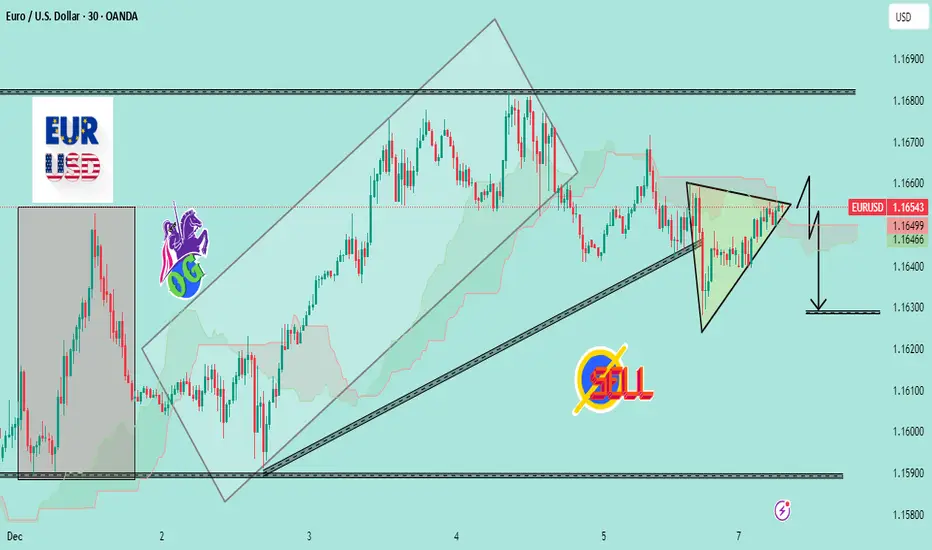
EURUSD Coiling for Breakdown — Triangle Ready to Crack📉 EURUSD Analysis — Bearish Breakout Setting Up
EURUSD is trading inside a tight symmetrical triangle after breaking its previous ascending channel. Price is compressing right under the Ichimoku cloud, showing weak buying momentum.
The structure suggests a bearish continuation:
The uptrend channe
EURUSD:Rate Cut Priced In - Can Powell Boost the Dollar Again?EURUSD:Rate Cut Priced In - Can Powell Boost the Dollar Again?
From our previous analysis on EURUSD, the price created a move above the structure area, opening the door for further growth. But what could happen during the FOMC?
Could this be just a false bullish breakout, and the price could fall

See all forex ideas
| - | - | - | - | - | - | - | ||
| - | - | - | - | - | - | - | ||
| - | - | - | - | - | - | - | ||
| - | - | - | - | - | - | - | ||
| - | - | - | - | - | - | - | ||
| - | - | - | - | - | - | - | ||
| - | - | - | - | - | - | - | ||
| - | - | - | - | - | - | - |
Trade directly on the supercharts through our supported, fully-verified and user-reviewed brokers.


