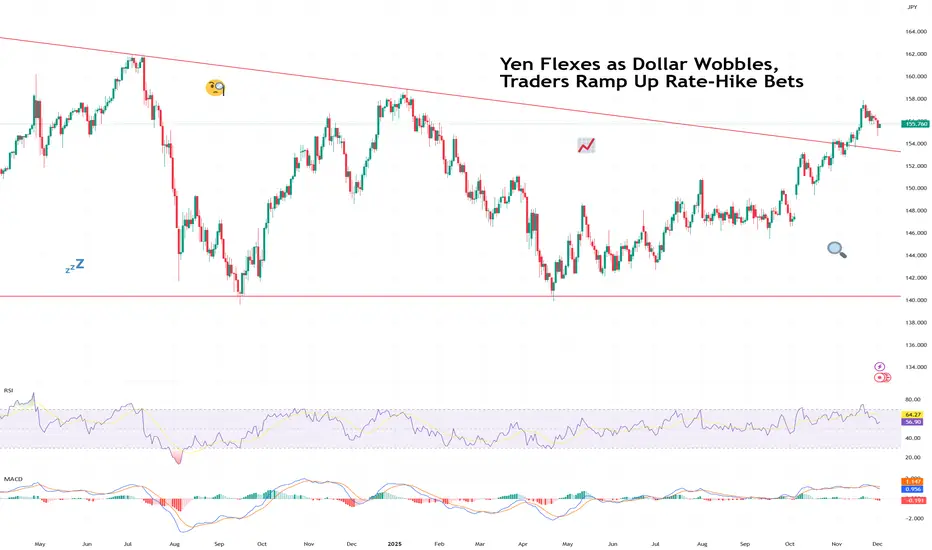
Yen Flexes as Dollar Wobbles, Traders Ramp Up Rate-Hike BetsThe yen came into Monday looking calm… and then proceeded to bench-press the dollar.
The FX:USDJPY pair slid under ¥155, hitting a session low of ¥154.65, after BoJ Governor Kazuo Ueda dropped one of the most powerful phrases in global FX:
“We will weigh the pros and cons of tightening.”
In Tok

Cyber Monday
The greatest deal of the year is in its final orbit.Secure this offer before it's gone.
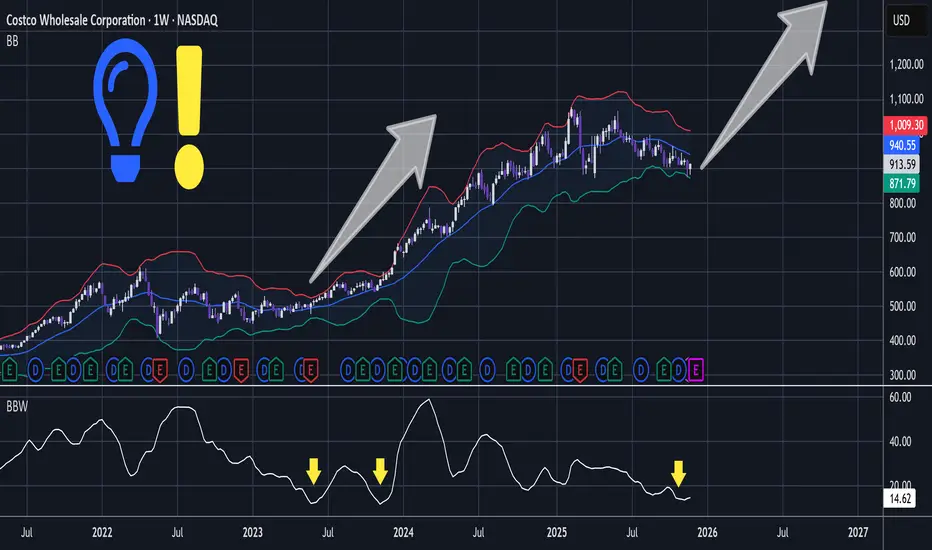
COST - Retail Powerhouse In Ideal HTF PositionShallow compressive action has printed contracting Bollinger Bands.
Notice that the BBW - Bollinger Band Width is similar to the previous correction before breakout.
In lower time frame the significantly sized slump has whipsawed through support and wedge trendline to become a bullish engulf:
T
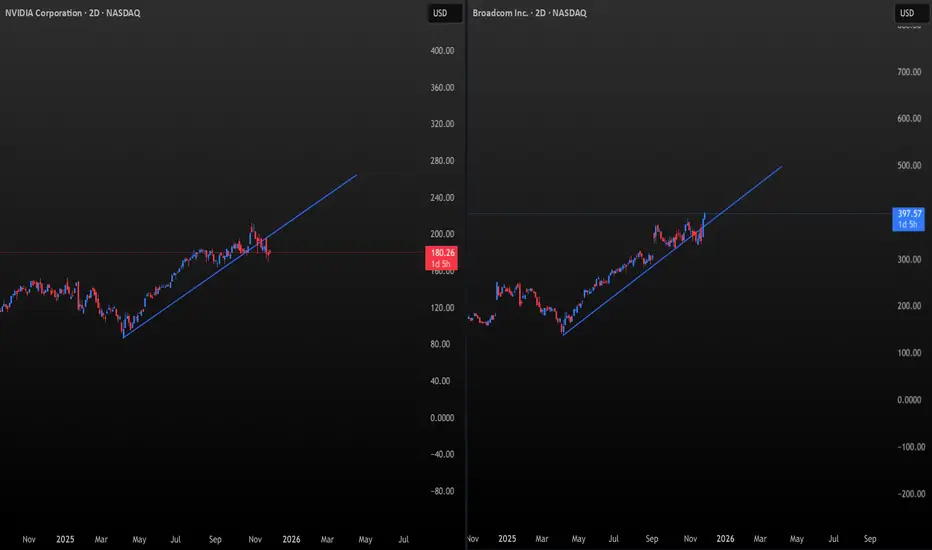
NVDA vs AVGO: The Battle for the AI Throne Has Begun⚡A New Leader Emerges in the Semiconductors
For years, NVDA was the undisputed titan — the gravitational center of the semiconductor universe.
But now, the geometry tells a different story.
THE CHARTS 📐
Both charts use the same natural scaling:
1° of time = $1 of price per unit.
And here’s the
SPX to Money Supply WARNING!If the charts aren’t showing bubble setups, I’m not going to invent them. I post what the data shows. So please don’t shoot the messenger when I say GTFO & STFO.
And just to keep the facts straight:
Brokerage, stock, and crypto accounts are not part of M2.
Why does M2 matter?
It’s the actual spe

Stocks Stage Comeback in Time for Thanksgiving. What's Behind ItIt’s Thanksgiving, and you know what that means. “Hey, sweety, why don't you come here and let us know how your high-beta stocks are doing. Here’s our little investor.”
And for once, the answer isn’t followed by a sigh. Stock traders are heading into the holiday with something they haven’t had in

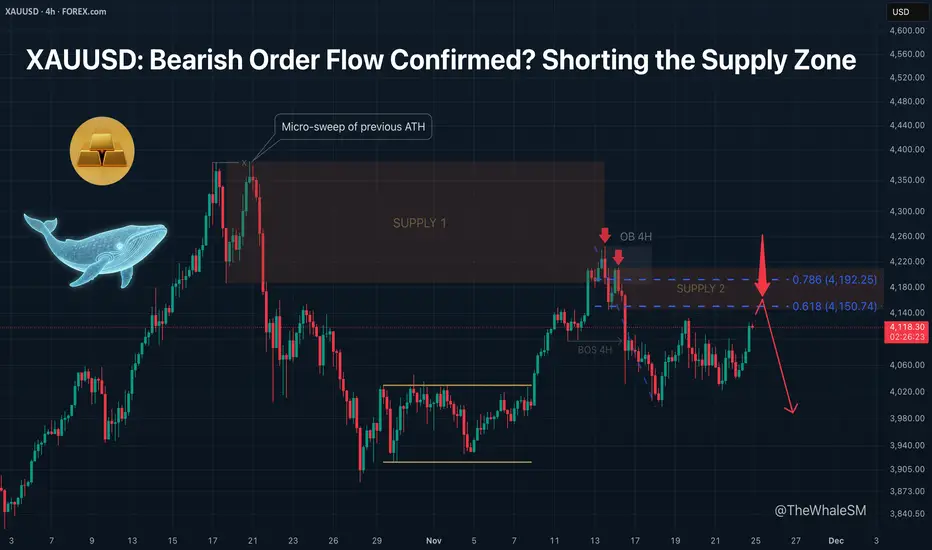
XAUUSD: Bearish Order Flow Confirmed? Shorting the Supply Zone.After updating the All-Time High (ATH), Gold performed a micro-sweep of liquidity from the previous ATH. This move was engineered via a Supply Zone . Following the sweep, this zone was mitigated, initiating a bearish order flow that broke the 4H structure to the downside (BOS 4H).
After the struc
ETHUSD H1 | Bullish Bounce Off Key SupportMomentum: Bullish
Price is currently above the ichimoku cloud.
Buy entry: 2,867.08
- Pullback support
- 61.8% Fib retracement
- 100% Fib projection
Stop Loss: 2,777.16
- Overlap support
Take Profit: 2,972.69
- Swing high resistance
High Risk Investment Warning
Stratos Markets Limited (tradu.com

NZDUSD downtrend continuation below falling resistanceThe NZDUSD currency pair continues to display a bearish outlook, in line with the prevailing downward trend. Recent price action suggests a corrective pullback, potentially setting up for another move lower if resistance holds.
Key Level: 0.5675
This zone, previously a consolidation area, now acts

PYPL USPayPal is a rare combination of value and growth.
The company demonstrates strong fundamentals, is strategically focused on the future, and trades at record-low multiples. The combination of financial discipline, capital return, and AI innovation makes it an attractive asset for long-term investor

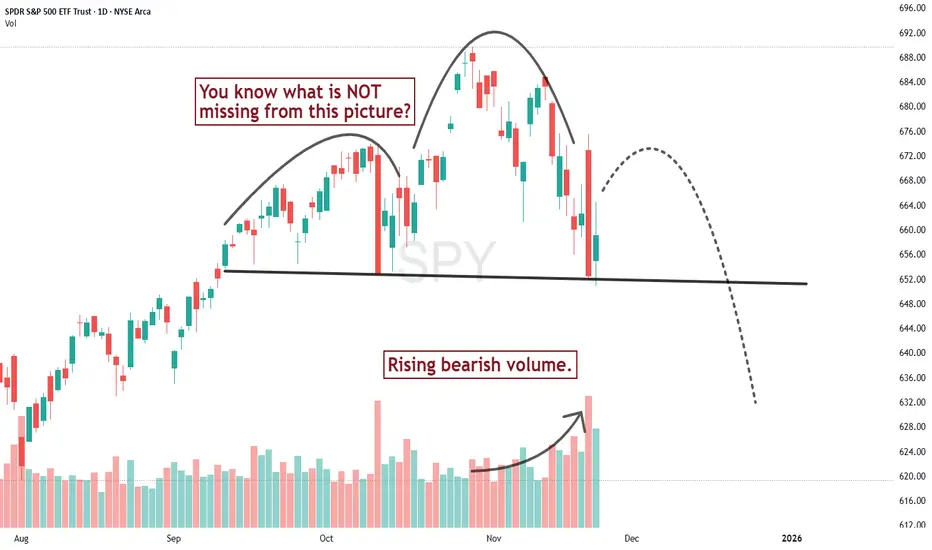
Oh what a difference a day makes!A couple days ago I thought there wasn't sufficient price pattern evidence to talk about a serious change in trend for the S&P 500, mostly because I didn't see the volume pattern confirming the downward slide of the recent high. But Thursday changed that. Redrawing the neckline, we get a chart that
See all editors' picks ideas
Match Finder [theUltimator5]Match Finder is the dating app of indicators. It takes your current ticker and finds the most compatible match over a recent time period. The match may not be Mr. right, but it is Mr. right now. It doesn't forecast future connection, but it tells you current compatibility for today.
Jokes aside,

Trend Line Methods (TLM)Trend Line Methods (TLM)
Overview
Trend Line Methods (TLM) is a visual study designed to help traders explore trend structure using two complementary, auto-drawn trend channels. The script focuses on how price interacts with rising or falling boundaries over time. It does not generate trade sign

Breakouts & Pullbacks [Trendoscope®]🎲 Breakouts & Pullbacks - All-Time High Breakout Analyzer
Probability-Based Post-Breakout Behavior Statistics | Real-Time Pullback & Runup Tracker
A professional-grade Pine Script v6 indicator designed specifically for analyzing the historical and real-time behavior of price after strong All-Ti

Count█ OVERVIEW
A library of functions for counting the number of times (frequency) that elements occur in an array or matrix.
█ USAGE
Import the Count library.
import joebaus/count/1 as c
Create an array or matrix that is a `float`, `int`, `string`, or `bool` type to count elements from, t

Holographic Market Microstructure | AlphaNattHolographic Market Microstructure | AlphaNatt
A multidimensional, holographically-rendered framework designed to expose the invisible forces shaping every candle — liquidity voids, smart money footprints, order flow imbalances, and structural evolution — in real time.
---
📘 Overview
The Hol

PriceFormatLibrary for automatically converting price values to formatted strings
matching the same format that TradingView uses to display open/high/low/close prices on the chart.
█ OVERVIEW
This library is intended for Pine Coders who are authors of scripts that display numbers onto a user's charts. T

LogNormalLibrary "LogNormal"
A collection of functions used to model skewed distributions as log-normal.
Prices are commonly modeled using log-normal distributions (ie. Black-Scholes) because they exhibit multiplicative changes with long tails; skewed exponential growth and high variance. This approach i

Range Oscillator (Zeiierman)█ Overview
Range Oscillator (Zeiierman) is a dynamic market oscillator designed to visualize how far the price is trading relative to its equilibrium range. Instead of relying on traditional overbought/oversold thresholds, it uses adaptive range detection and heatmap coloring to reveal where pri

Volume Surprise [LuxAlgo]The Volume Surprise tool displays the trading volume alongside the expected volume at that time, allowing users to spot unexpected trading activity on the chart easily.
The tool includes an extrapolation of the estimated volume for future periods, allowing forecasting future trading activity.
🔶 U

Smooth Theil-SenI wanted to build a Theil-Sen estimator that could run on more than one bar and produce smoother output than the standard implementation. Theil-Sen regression is a non-parametric method that calculates the median slope between all pairs of points in your dataset, which makes it extremely robust to o

See all indicators and strategies
Community trends
TESLA: Bullish Continuation Pattern: Eyes on 482 → 550 → 600TESLA: Bullish Continuation Pattern: Eyes on 482 → 550 → 600
TSLA is forming another bullish continuation pattern after a series of higher-low triangle formations. The structure suggests strong trend continuation potential if buyers reclaim momentum.
A confirmed breakout above the current resist

COST - Retail Powerhouse In Ideal HTF PositionShallow compressive action has printed contracting Bollinger Bands.
Notice that the BBW - Bollinger Band Width is similar to the previous correction before breakout.
In lower time frame the significantly sized slump has whipsawed through support and wedge trendline to become a bullish engulf:
T
advertise your products better, whats wrong with the marketing.you can do better BYND. advertise your food better

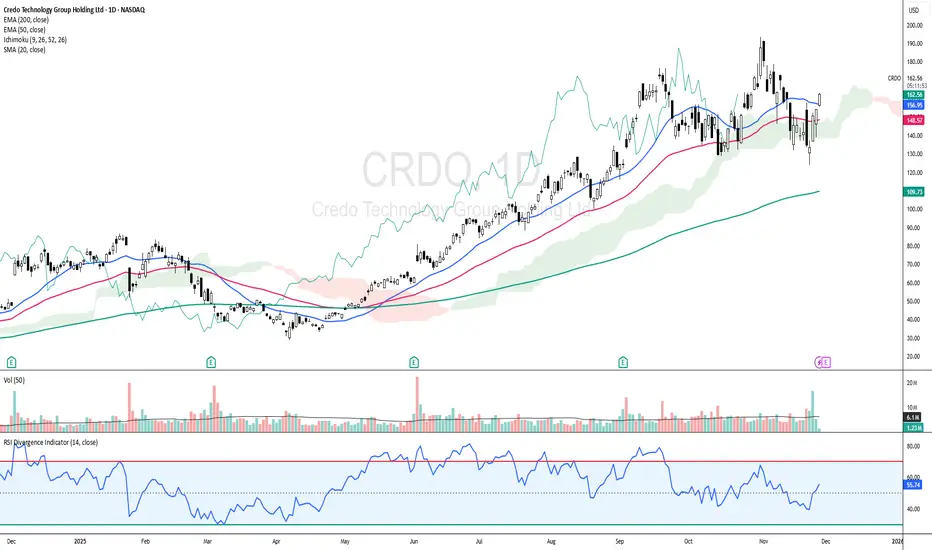
CRDO: Cloud + EMAs Aligning for Upside ContinuationCRDO - CURRENT PRICE : 162.95
CRDO is showing a bullish reversal setup as price rebounds and closes back above the EMA50 while holding firmly above the Ichimoku Cloud , signaling the major trend remains intact. Momentum is improving with RSI rising above 50 and not yet overbought, supported by in
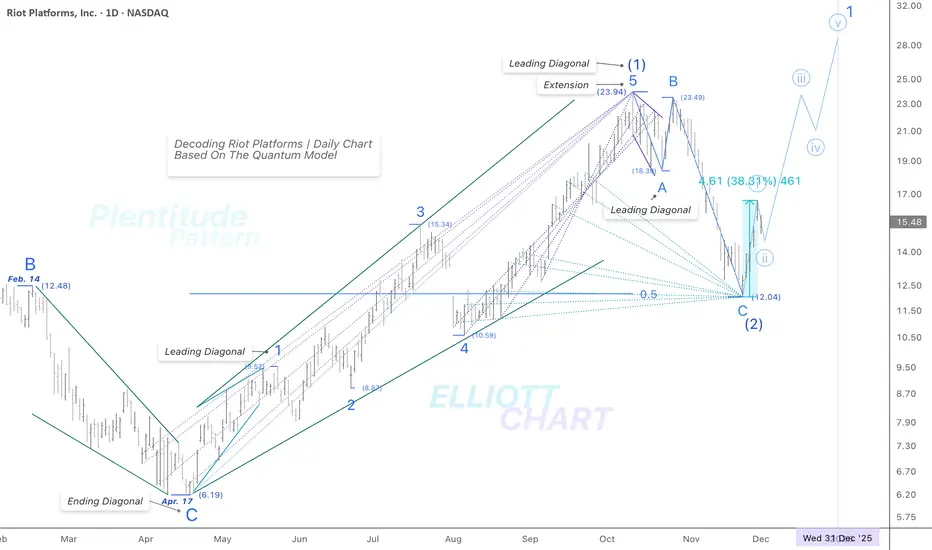
RIOT | DailyNASDAQ:RIOT — Technical Update
As anticipated in prior updates, RIOT completed a 50% retracement of the rising Leading Diagonal as Intermediate Wave (1), potentially marking the extreme low of Intermediate Wave (2).
Last week’s 38% initial surge — consistent with renewed strength across the broad
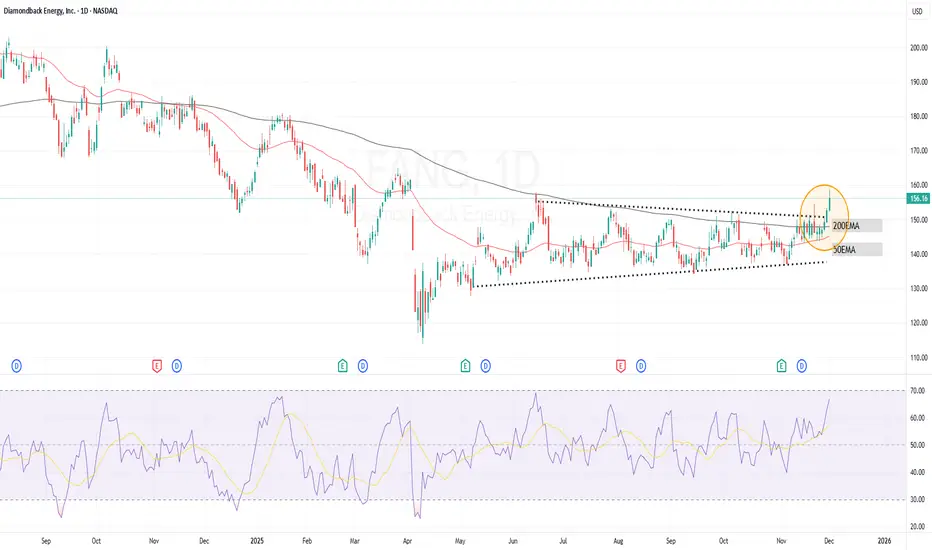
$FANG stock price analysis
Some of my students have asked me about the NASDAQ:FANG stock. So here is my analysis.
Fundamentally speaking, Diamondback Energy delivered a solid earnings beat this Q, with revenue and EPS exceeding expectations. Margins remain strong, free cash flow is healthy, and the company continues aggr
Nvidia - Now is the time to go short!💣Nvidia ( NASDAQ:NVDA ) is now creating a top:
🔎Analysis summary:
Just a couple of days ago, Nvidia perfectly retested a major resistance trendline. Always in the past, such a retest was followed by a major move towards the downside. Therefore, Nvidia is preparing for a major drop, which coul

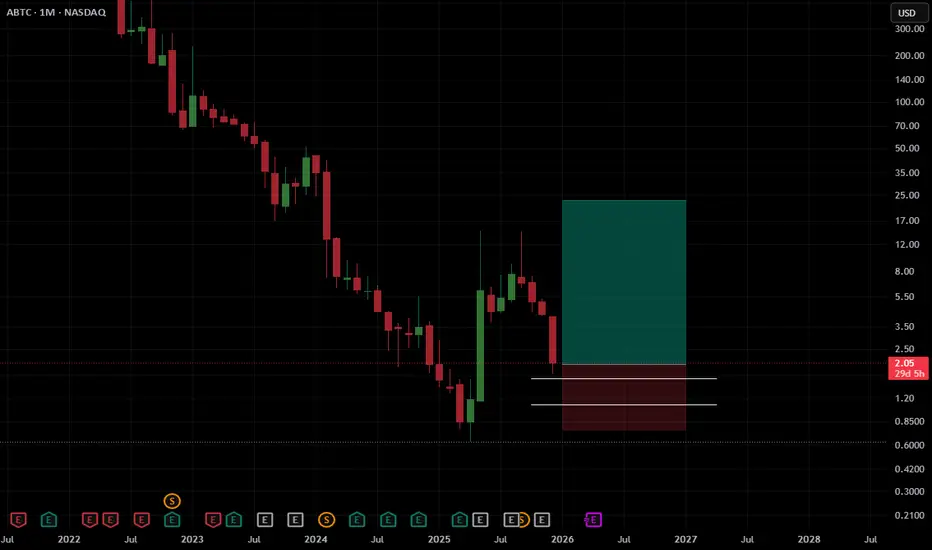
$ABTC (NASDAQ) Long Setup ABTC continues bleeding exactly as expected and has now tapped the lower white trendline for the 4th time within the macro down-channel. Every previous touch has generated multi-week rallies, even during bear phases.
With the monthly candle printing around $2.02 and extreme fear across crypto mining
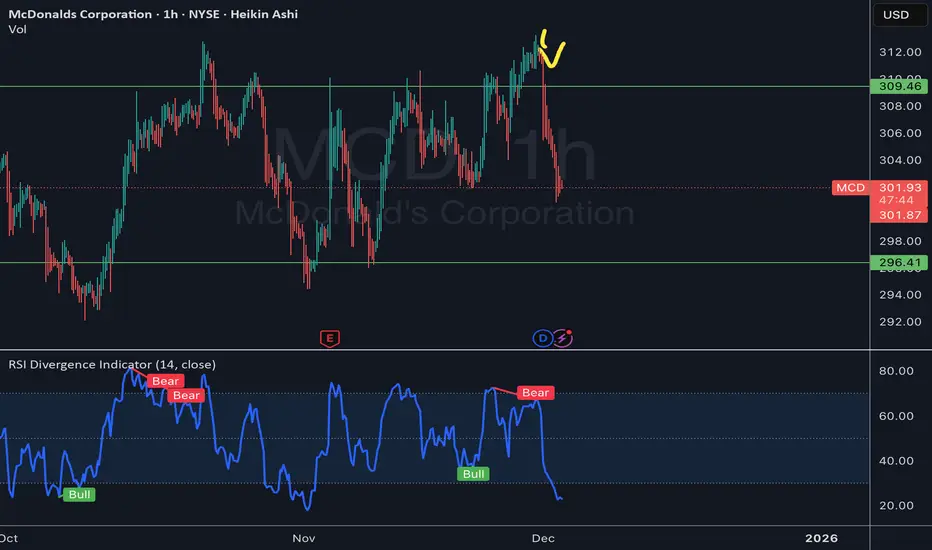
MCD $305 PUT $380Date Added 12/1
Expiration Date 12/9
Mcdonalds is always a great option play for me! Clear indicators this stock was heading downward so I entered into a short.
Total return 111%
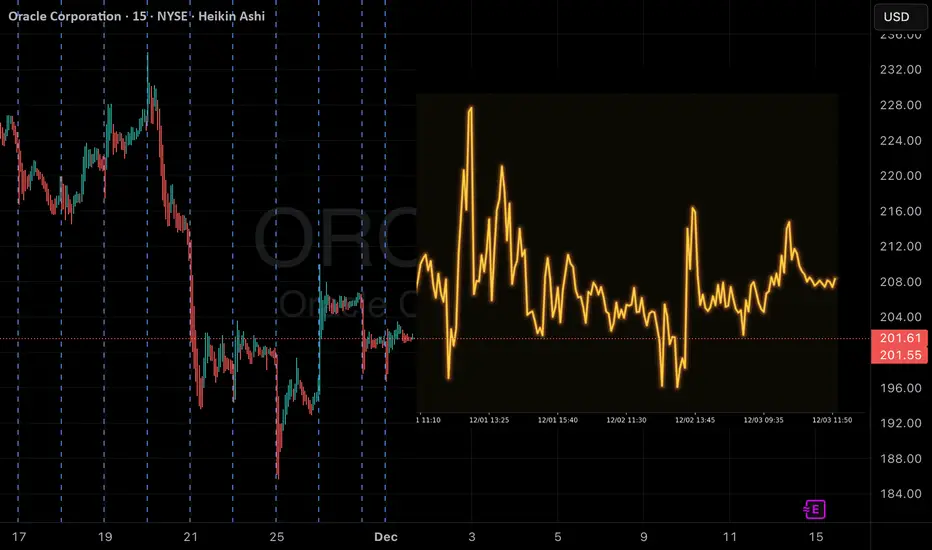
ORCL Weekly Signal: Overbought & Set for PullbackORCL Weekly Signal | 2025-12-01
Instrument: ORCL
Strategy: Weekly PUT (Short)
Strike Price: $195.00
Entry Price: $8.75 – $9.20
Target 1: $13.85 (50% gain)
Target 2: $16.65 (80% gain)
Stop Loss: $6.50 (≈30% loss)
Expiry: 2025-12-05 (4 days)
Position Size: 2% of portfolio
Confidence: 58%
Weekly Moment
See all stocks ideas
Today
MMacy's Inc
Actual
—
Estimate
−0.13
USD
Today
USAUU.S. Gold Corp.
Actual
—
Estimate
−0.13
USD
Today
PAVSParanovus Entertainment Technology Ltd.
Actual
—
Estimate
—
Today
ATHRAether Holdings, Inc.
Actual
—
Estimate
−0.09
USD
Today
IMGCIMG Inc.
Actual
—
Estimate
—
Today
GIIIG-III Apparel Group, LTD.
Actual
—
Estimate
1.60
USD
Today
M
MPLTMapLight Therapeutics, Inc.
Actual
—
Estimate
−1.73
USD
Today
TBHCThe Brand House Collective, Inc
Actual
—
Estimate
−0.42
USD
See more events
Community trends
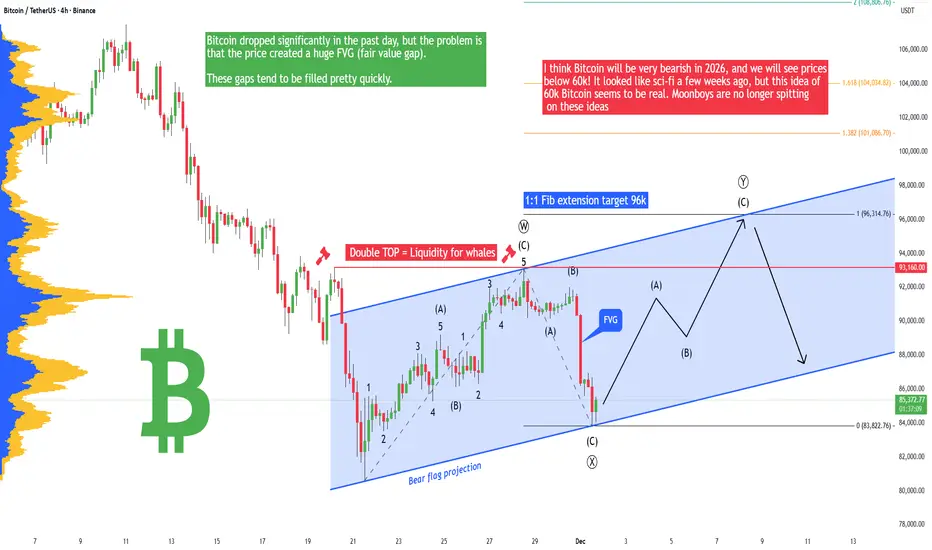
Bitcoin - Fake drop! Soon return to 96k (December PUMP!)Bitcoin has dropped like crazy in the past day because we are in a strong bear market, but I think we should see a December rally! I have been warning you against these big crashes pretty much since Summer 2025. I knew it was going to happen - the question was not if but when.
The price created a
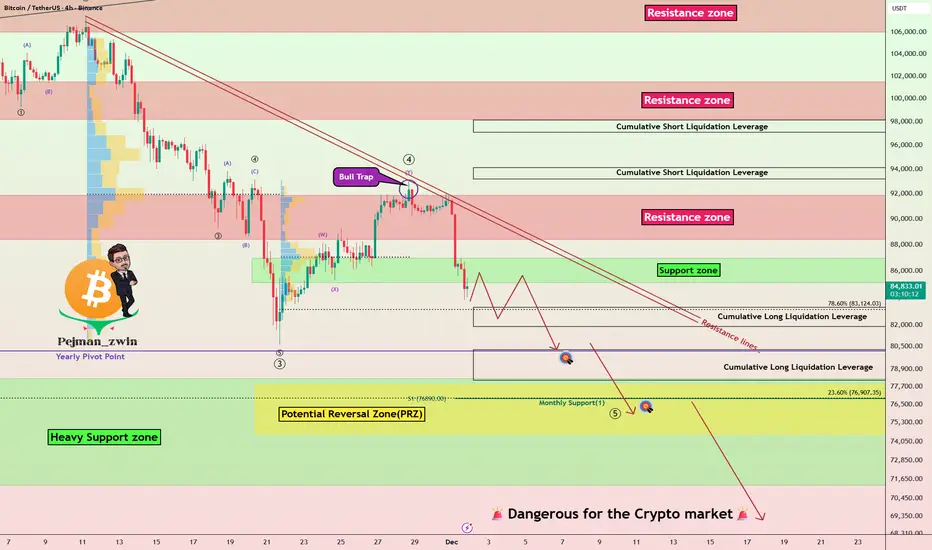
Crypto Winter 2026: BTC 75% Correction PT 30 000 USDInvestment Memo: Anticipating a 2026 Bitcoin Crypto Winter
By ProjectSyndicate
________________________________________
1. Executive Summary
❄️ Summary view: This memo treats 2026 as the high-probability crypto winter year for Bitcoin following the 2024 halving, with a working top around 123,0

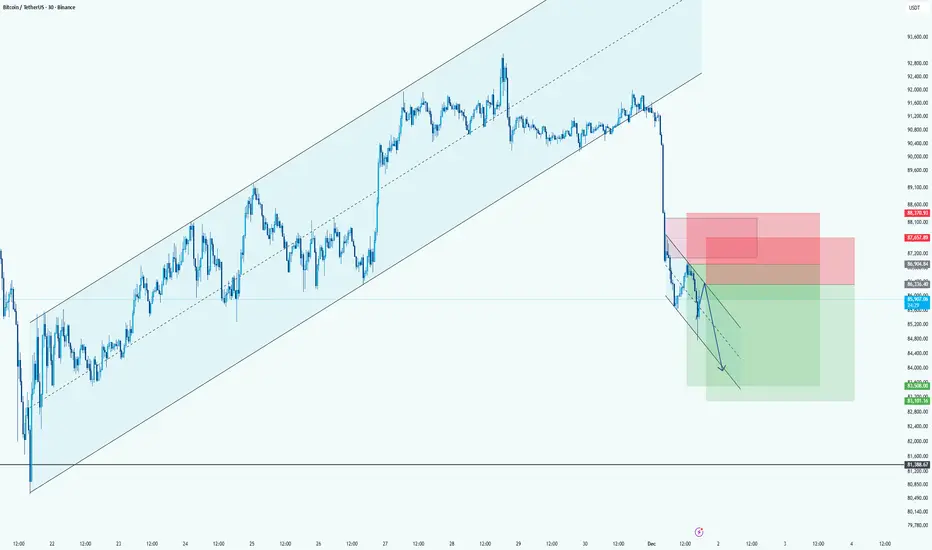
BTC: Bearish Continuation Setup After Major Channel BreakdownHi!
Price broke hard below the long-term ascending channel, confirming a clear shift from bullish to bearish momentum.
After the breakdown, BTC is moving in a small descending correction channel, creating a classic lower-high retracement toward supply.
Direction: Short
Entry Area: 87,200 – 88,
BTCUSD Long: Volatility Rising — Retest of 90,000 ExpectedHello, traders! The price auction for BTCUSD has been in a corrective phase, forming a broad descending structure guided by the major Trend Line. This bearish pattern has been defined by a sequence of lower highs and lower lows, with price repeatedly getting rejected from the Supply Zone and consoli

Bitcoin’s Worst November Ever — More Dump?In the past 24 hours, Bitcoin( BINANCE:BTCUSDT ) has dropped by more than -8%, marking its worst November performance ever, with a decline of about -17.67% this month alone.
Now, the question is whether Bitcoin will continue its downward trend or start to rebound. So, stay tuned!
At the moment, it
Swing trade opportunity for AsterAfter a good week of heavy selling pressure, I think mostly due to the fact there is a lot of airdrops being released (I received a good portion of USDF rewards too on asterdex), as well that Bitcoin is doing a healthy correction, I expect the price to stabilize again.
I have spot holdings for the

BTCUSD–Major Head&Shoulders Breakdown and Key Demand Zones AheadBTCUSD recently completed a clear Head & Shoulders reversal pattern, confirmed by a break of the neckline and a strong downside continuation. After the breakdown, price has reached an important demand area, where it is attempting to stabilize.
Left Shoulder – Head – Right Shoulder structure
Neckl

A Pullback Cannot Hide a Weakening TrendHello everyone, it’s Domic here ✌️
Looking at Bitcoin’s recent price action, you can probably feel that the latest drop wasn’t a random fall. The market completely broke through a multi-day equilibrium zone, and the moment BTC was repeatedly rejected at the EMA 89 and then lost the EMA 34, the bal
BITCOIN Can this Bear Cycle be mapped?Bitcoin (BTCUSD) is on its 3rd straight week of consolidation on its 1W MA100 (green trend-line) after marginally breaking below it (green circle). We've shown in previous analyses how the build up, including the Higher Lows trend-line (1W RSI Lower Highs Bearish Divergence) and the 1W MA50 (blue tr

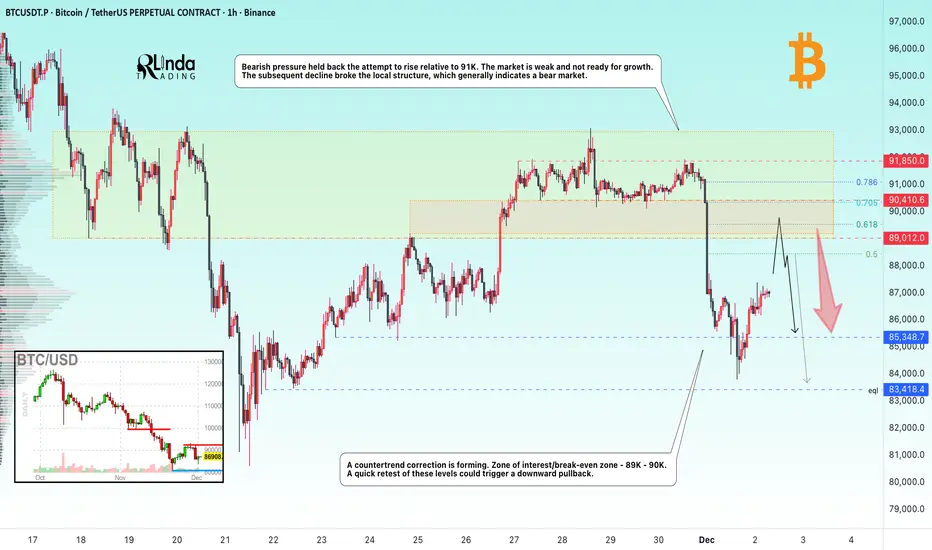
BITCOIN → The hunt for liquidity before the fallBINANCE:BTCUSDT.P continues to update lows within the global downtrend. The retest of 91K confirmed the dominance of bears...
The downtrend continues. The technical and fundamental situation for the crypto market is neutral to weak.
Bearish pressure held back the attempt to rise relative to 91
See all crypto ideas
Lingrid | GOLD Pullback Trading Opportunity from Support ZoneOANDA:XAUUSD is retracing into the 4,190–4,200 support band after an extended bullish run within the upward channel. The broader structure remains firmly bullish, with higher lows and higher highs forming along the rising trendline and each dip being absorbed by buyers. Price is now testing zone be

GOLD → Correction to support amid a bullish trend FX:XAUUSD retreated from the $4,245 level reached on Monday. A countertrend correction is forming ahead of the news. But buyers are not sleeping...
Weak US economic data has heightened expectations of an imminent Fed rate cut. The PMI index in the US manufacturing sector continued to contract.

Gold 30-Min — Volume Sell Reversal Triggered⚡Base : Hanzo Trading Alpha Algorithm
The algorithm calculates volatility displacement vs liquidity recovery, identifying where probability meets imbalance.
It trades only where precision, volume, and manipulation intersect —only logic.
✈️ Technical Reasons
/ Direction — SHORT / Reversal 4222 Area

XAU/USD | Another Bullish Leg Possible! (READ THE CAPTION)By analyzing the #Gold chart on the 4 hour timeframe, we can see that price made a strong bullish jump today, pushing all the way up to $4264 before showing signs of exhaustion and pulling back. This reaction is typical after such an aggressive move, especially when price taps into short-term liquid

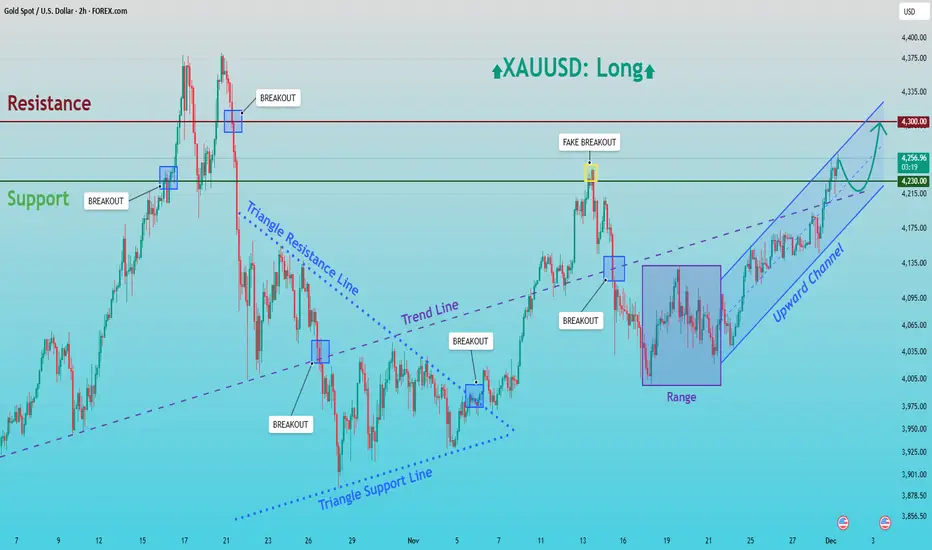
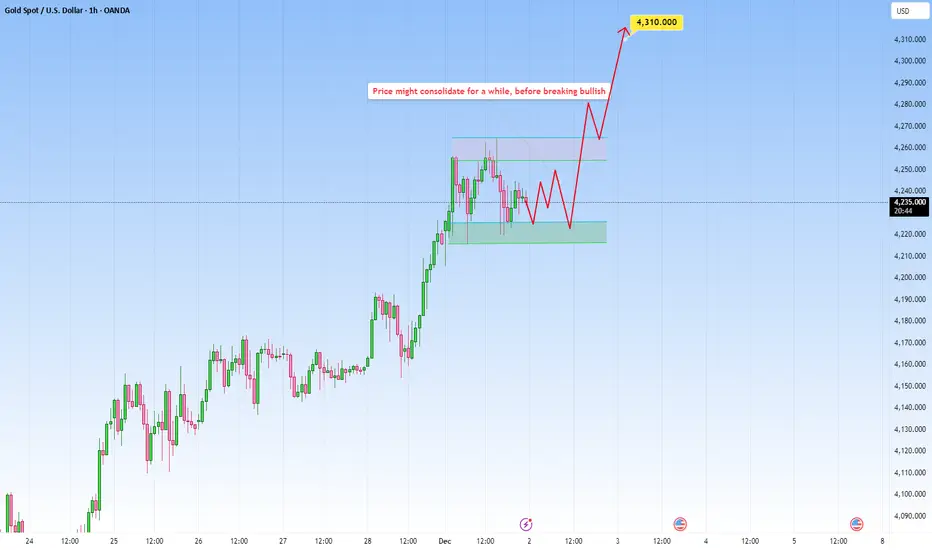
XAUUSD: Buyers Eye Retest of the $4,300 Resistance ZoneHello everyone, here is my breakdown of the current XAUUSD setup.
Market Analysis
Gold continues to trade within a well-structured bullish environment following a strong recovery from the lower Triangle Support Line earlier in the month. After a prolonged corrective phase inside a symmetrical tri
Gold H1 – Will 4278–4280 Trigger a Drop Into 4170 Today?🟡 XAUUSD – Intraday Smart Money Plan | by Ryan_TitanTrader (01/12)
📈 Market Context
Gold continues its impressive rally as markets price in a potential rate cut by the Federal Reserve (Fed) in December. Spot gold recently surged past $4,230/oz — hitting a multi-week high — as the US Dollar Index (D

GOLD Consolidation bullish run momenmtumGold moved into consolidation after a bullish run. The metal pulled back to $4110/oz on Tuesday as investors booked profits following Monday’s six-week high. The market is now focused on U.S. interest rate expectations, with growing anticipation of a rate cut next week. Traders are also awaiting rem
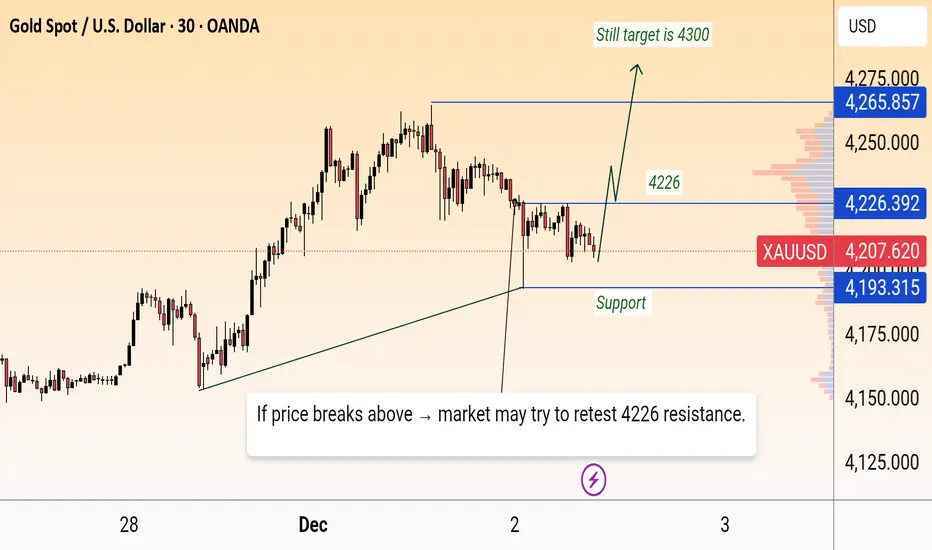
Gold updateGold is holding above the rising support trendline, showing early signs of strength after tapping the 4193 support zone. If buyers sustain momentum and break above 4226, price can move toward the higher resistance at 4265, with an extended upside target near 4300. However, staying below 4226 keeps t
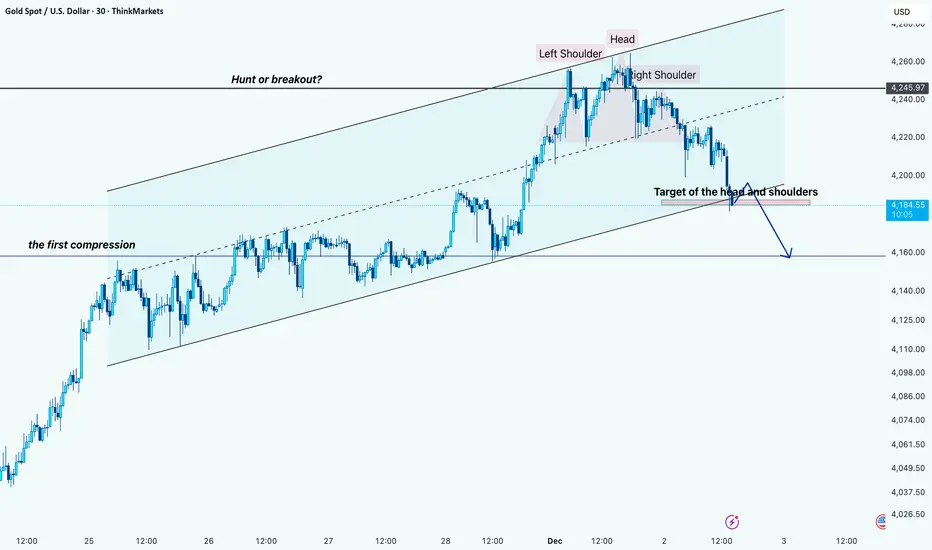
Gold Reversal in Motion: Head & Shoulders Breakdown Hi!
Market Structure
Gold has been moving inside a clean ascending channel, with price respecting both upper and lower boundaries for several days. Earlier in the trend, we saw the first compression phase along the dashed mid-line, which later fueled the strong push toward the channel top.
Liquidi
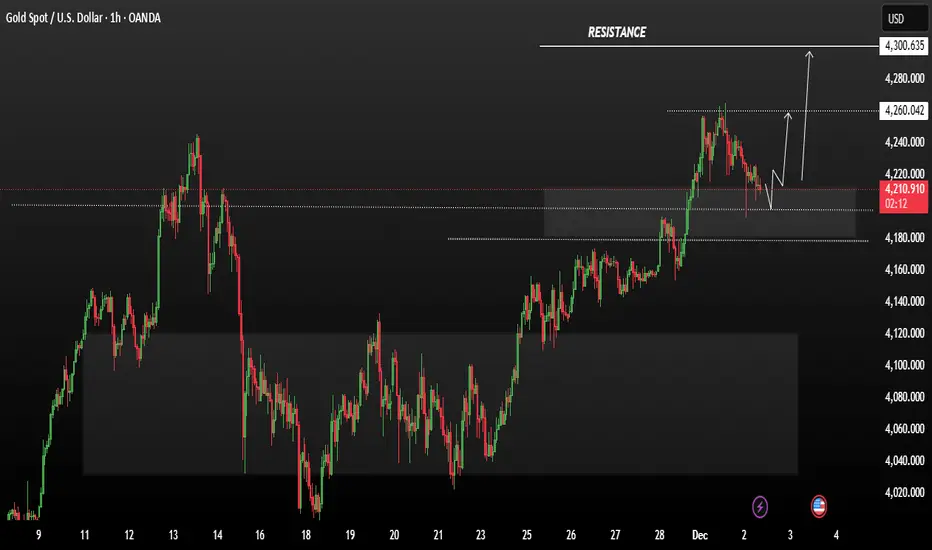
XAUUSD: Waiting for directionPrice recently pushed to the upside, but now the market is slowing down, moving sideways.
This is classic reaction after an impulsive move. Buyers are still in control overall, but taking a breather.
A clean break above the upper range would confirm that buyers are ready to continue the trend and p
See all futures ideas
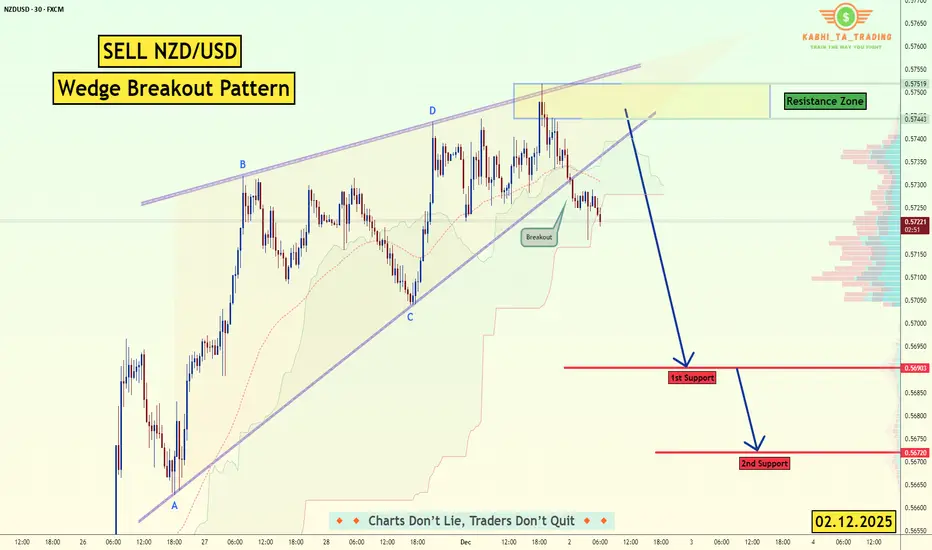
NZD/USD - Wedge Breakout (02.12.2025)📝 Description🔹 Setup Overview OANDA:NZDUSD
NZD/USD has broken below a Rising Wedge structure — a bearish continuation signal.
After retesting the lower trendline, price rejected sharply from the Resistance Zone, confirming seller strength.
Today’s fundamentals add further downside pressure, mak
EURUSD Uptrend Intact: Price Approaches Major 1.1650 ResistanceHello traders! Here’s my technical outlook on EUR/USD based on the current market structure. After breaking out of the Buyer Zone near 1.1600–1.1610, the price pushed higher and re-entered the ascending channel, continuing to form higher highs and higher lows along the channel’s Support Line. Buyers

EURUSD Potential UpsidesHey Traders, in today's trading session we are monitoring EURUSD for a buying opportunity around 1.15800 zone, EURUSD is trading in an uptrend and currently is in a correction phase in which it is approaching the trend at 1.15800 support and resistance area.
Trade safe, Joe.

Yen Flexes as Dollar Wobbles, Traders Ramp Up Rate-Hike BetsThe yen came into Monday looking calm… and then proceeded to bench-press the dollar.
The FX:USDJPY pair slid under ¥155, hitting a session low of ¥154.65, after BoJ Governor Kazuo Ueda dropped one of the most powerful phrases in global FX:
“We will weigh the pros and cons of tightening.”
In Tok
#NZDCAD: Bearish Move IS Likely To Continue! NZDCAD is in swing bearish move and likely to continue dropping hard. We have an potential selling opportunity in making, Please use accurate risk management while trading. If you like our ideas then please do like and comment and follow for more.
Good luck and trade safe as always.
Team Setups

CAD/CHF: One More Wave Ahead?!📈CADCHF is poised to continue its upward trajectory, reaching new highs.
A bullish breakout from the neckline of the ascending triangle pattern on the 4-hour timeframe indicates a strong trend-following bullish signal.
We anticipate with high probability that the price will soon reach the 0.5763 l

EURUSD: Rejection Signals Move Toward 1.15500 SupportHello everyone, here is my breakdown of the current EURUSD setup.
Market Analysis
EURUSD continues to trade inside a broader downward channel, where bearish structure remains dominant. After reaching the Resistance Zone around 1.16500, the pair formed another rejection near the descending trendli

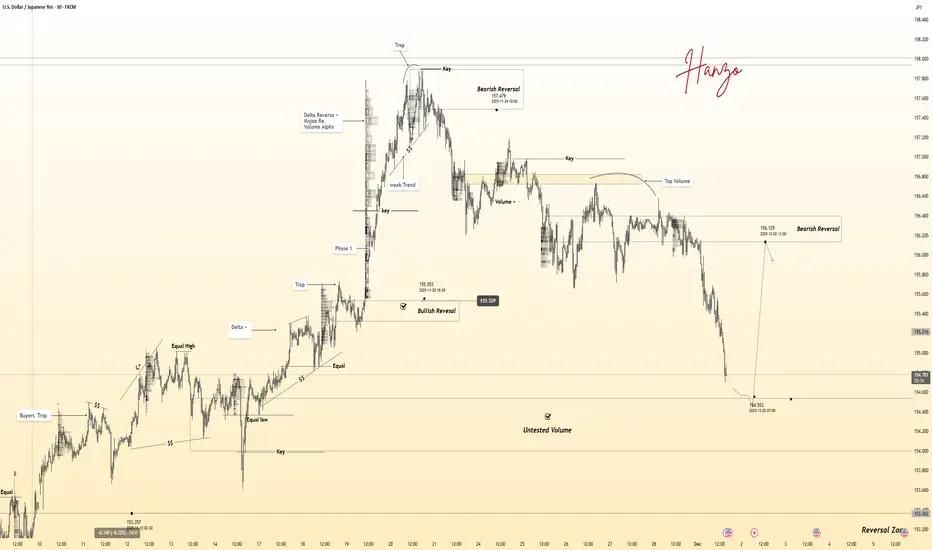
USDJPY 30-Min — Volume Buy & Sell Reversal Triggered⚡Base : Hanzo Trading Alpha Algorithm
The algorithm calculates volatility displacement vs liquidity recovery, identifying where probability meets imbalance.
It trades only where precision, volume, and manipulation intersect —only logic.
✈️ Technical Reasons
/ Direction — LONG / Reversal 154.550 Are
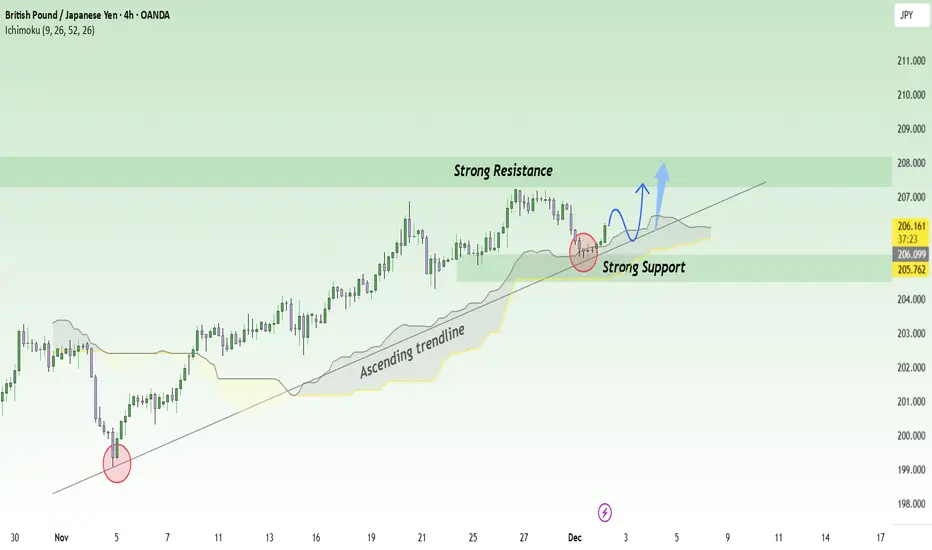
GBPJPY Next Buying Move Analysis Read The Captionchart for the GBP/JPY currency pair. It displays price movement between a marked support level at the bottom and a target level at the top. The chart includes Ichimoku cloud indicators and a projected forecast path showing a potential drop to the support level before rising back up to the target zon

GBPJPY Gearing Up for a New Bullish Wave?If we were to describe GBPJPY at this moment, it would be the picture of a market gathering momentum to climb higher . After a mild pullback, the macro backdrop still leans toward further upside: the JPY continues to weaken as risk-aversion eases, while the GBP remains supported by a stable econom
See all forex ideas
| - | - | - | - | - | - | - | ||
| - | - | - | - | - | - | - | ||
| - | - | - | - | - | - | - | ||
| - | - | - | - | - | - | - | ||
| - | - | - | - | - | - | - | ||
| - | - | - | - | - | - | - | ||
| - | - | - | - | - | - | - | ||
| - | - | - | - | - | - | - |
Trade directly on the supercharts through our supported, fully-verified and user-reviewed brokers.


