Stocks Stage Comeback in Time for Thanksgiving. What's Behind ItIt’s Thanksgiving, and you know what that means. “Hey, sweety, why don't you come here and let us know how your high-beta stocks are doing. Here’s our little investor.”
And for once, the answer isn’t followed by a sigh. Stock traders are heading into the holiday with something they haven’t had in

Cyber Monday
The greatest deal of the year is in its final orbit.Secure this offer before it's gone.

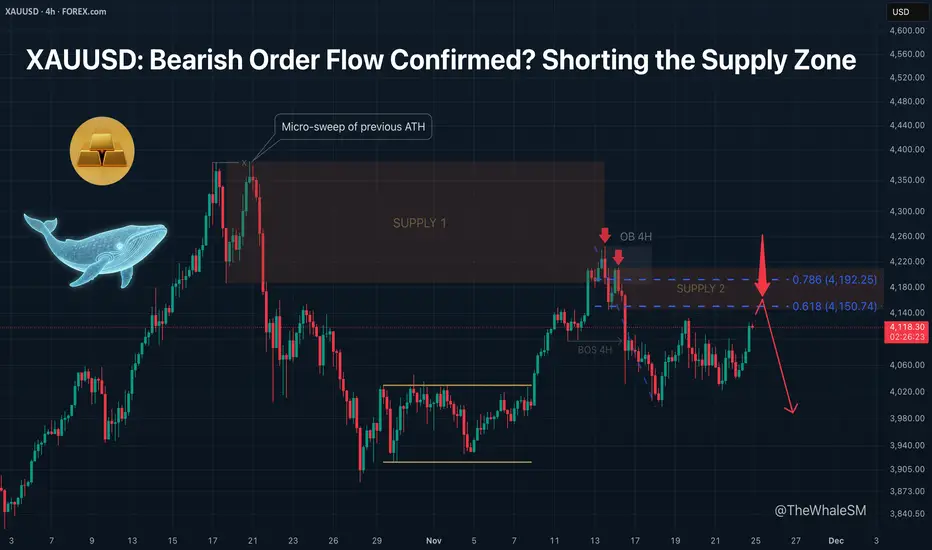
XAUUSD: Bearish Order Flow Confirmed? Shorting the Supply Zone.After updating the All-Time High (ATH), Gold performed a micro-sweep of liquidity from the previous ATH. This move was engineered via a Supply Zone . Following the sweep, this zone was mitigated, initiating a bearish order flow that broke the 4H structure to the downside (BOS 4H).
After the struc
ETHUSD H1 | Bullish Bounce Off Key SupportMomentum: Bullish
Price is currently above the ichimoku cloud.
Buy entry: 2,867.08
- Pullback support
- 61.8% Fib retracement
- 100% Fib projection
Stop Loss: 2,777.16
- Overlap support
Take Profit: 2,972.69
- Swing high resistance
High Risk Investment Warning
Stratos Markets Limited (tradu.com

NZDUSD downtrend continuation below falling resistanceThe NZDUSD currency pair continues to display a bearish outlook, in line with the prevailing downward trend. Recent price action suggests a corrective pullback, potentially setting up for another move lower if resistance holds.
Key Level: 0.5675
This zone, previously a consolidation area, now acts

PYPL USPayPal is a rare combination of value and growth.
The company demonstrates strong fundamentals, is strategically focused on the future, and trades at record-low multiples. The combination of financial discipline, capital return, and AI innovation makes it an attractive asset for long-term investor

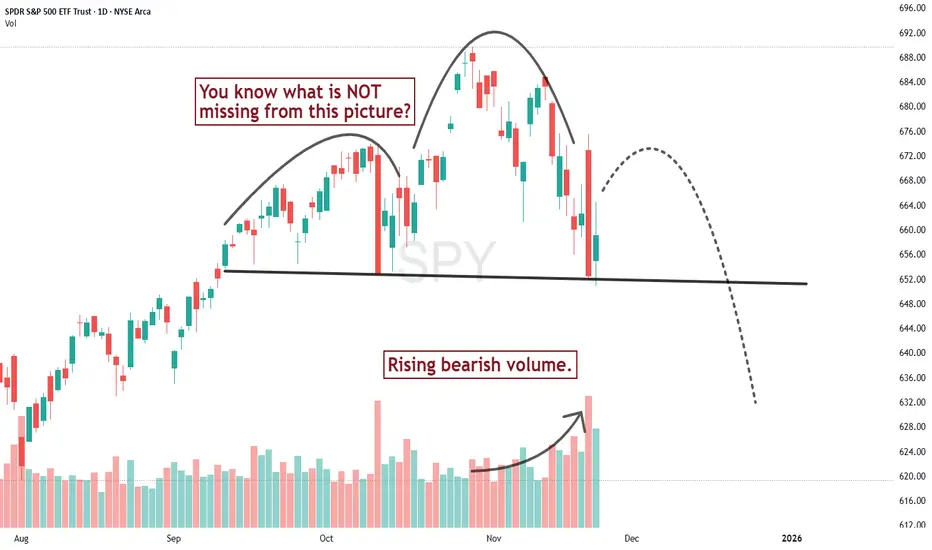
Oh what a difference a day makes!A couple days ago I thought there wasn't sufficient price pattern evidence to talk about a serious change in trend for the S&P 500, mostly because I didn't see the volume pattern confirming the downward slide of the recent high. But Thursday changed that. Redrawing the neckline, we get a chart that
Why This Time Is Not Different — BTC Could Still Drop >50%Bitcoin is moving into a phase where long-term cycles matter more than whatever the market narrative happens to be this week.
And if you look at those cycles, one thing becomes clear: BTC has never avoided a major drop after making a new ATH.
1. The timing keeps repeating — almost to the day
Every

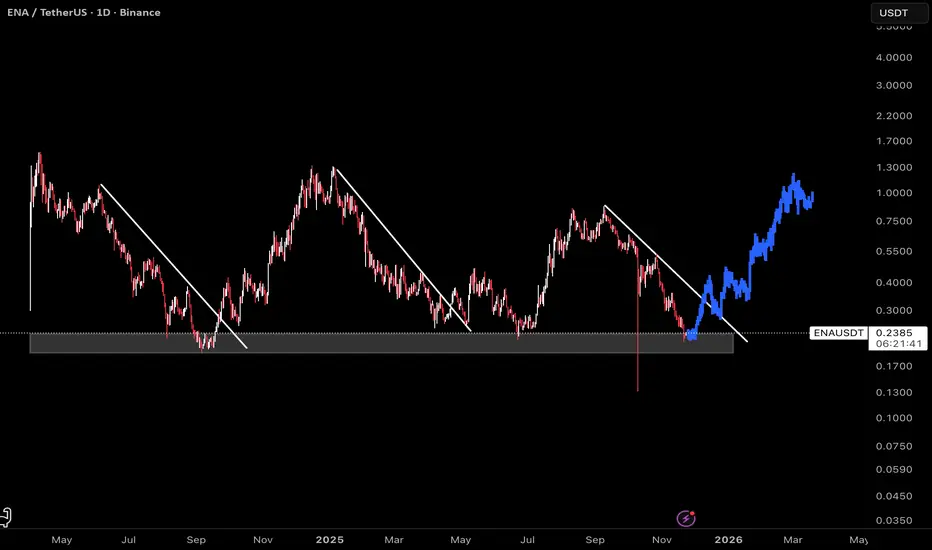
ENA: Bullish SetupThis chart displays ENA on a daily timeframe, with clear structure pointing to a favorable long entry. The current price action is trading within a major support zone, where previous trendline breaks have consistently marked the start of impulsive moves.
Historically, every time ENA breaks out abov
Analysis for What’s Coming - AI Bubble Sentiment The US markets have been described as “on a rally” for quite some time. I would not agree if it is meant to describe the overall US market, but would agree if it refers specifically to AI or tech stocks. Why?
Among the four major US indices, the Russell—representing a much broader base of US-listed

Nvidia Earnings Finally Ease Market Jitters. Are AI Bulls Back?It’s confirmed. This is Nvidia’s stock market and we all live in it.
Nvidia NASDAQ:NVDA reported yet another record-breaking quarter, instantly soothing market nerves after a week filled with talks of “AI bubble,” “valuation fever,” and “maybe Michael Burry is right again.” It was the cherry of t

See all editors' picks ideas
Match Finder [theUltimator5]Match Finder is the dating app of indicators. It takes your current ticker and finds the most compatible match over a recent time period. The match may not be Mr. right, but it is Mr. right now. It doesn't forecast future connection, but it tells you current compatibility for today.
Jokes aside,

Trend Line Methods (TLM)Trend Line Methods (TLM)
Overview
Trend Line Methods (TLM) is a visual study designed to help traders explore trend structure using two complementary, auto-drawn trend channels. The script focuses on how price interacts with rising or falling boundaries over time. It does not generate trade sign

Breakouts & Pullbacks [Trendoscope®]🎲 Breakouts & Pullbacks - All-Time High Breakout Analyzer
Probability-Based Post-Breakout Behavior Statistics | Real-Time Pullback & Runup Tracker
A professional-grade Pine Script v6 indicator designed specifically for analyzing the historical and real-time behavior of price after strong All-Ti

Count█ OVERVIEW
A library of functions for counting the number of times (frequency) that elements occur in an array or matrix.
█ USAGE
Import the Count library.
import joebaus/count/1 as c
Create an array or matrix that is a `float`, `int`, `string`, or `bool` type to count elements from, t

Holographic Market Microstructure | AlphaNattHolographic Market Microstructure | AlphaNatt
A multidimensional, holographically-rendered framework designed to expose the invisible forces shaping every candle — liquidity voids, smart money footprints, order flow imbalances, and structural evolution — in real time.
---
📘 Overview
The Hol

PriceFormatLibrary for automatically converting price values to formatted strings
matching the same format that TradingView uses to display open/high/low/close prices on the chart.
█ OVERVIEW
This library is intended for Pine Coders who are authors of scripts that display numbers onto a user's charts. T

LogNormalLibrary "LogNormal"
A collection of functions used to model skewed distributions as log-normal.
Prices are commonly modeled using log-normal distributions (ie. Black-Scholes) because they exhibit multiplicative changes with long tails; skewed exponential growth and high variance. This approach i

Range Oscillator (Zeiierman)█ Overview
Range Oscillator (Zeiierman) is a dynamic market oscillator designed to visualize how far the price is trading relative to its equilibrium range. Instead of relying on traditional overbought/oversold thresholds, it uses adaptive range detection and heatmap coloring to reveal where pri

Volume Surprise [LuxAlgo]The Volume Surprise tool displays the trading volume alongside the expected volume at that time, allowing users to spot unexpected trading activity on the chart easily.
The tool includes an extrapolation of the estimated volume for future periods, allowing forecasting future trading activity.
🔶 U

Smooth Theil-SenI wanted to build a Theil-Sen estimator that could run on more than one bar and produce smoother output than the standard implementation. Theil-Sen regression is a non-parametric method that calculates the median slope between all pairs of points in your dataset, which makes it extremely robust to o

See all indicators and strategies
Community trends
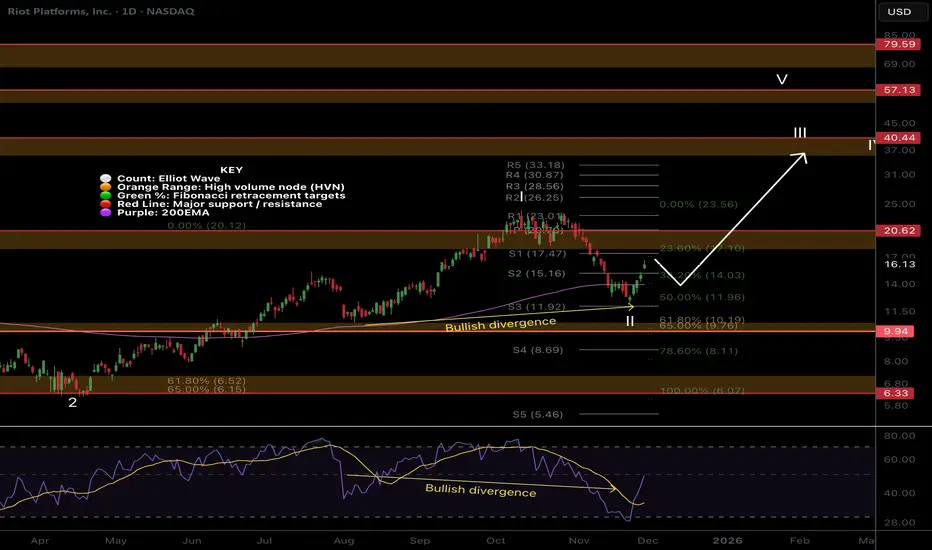
RIOT holding up stronger than the others..NASDAQ:RIOT Price remains in its uptrend and wave II of 3 appears complete with a 3 white knight bullish candle pattern.
Price recovered the daily 200EMA and looks rady for higher.
📈 Daily RSI hit oversold with bullish divergence
👉 Continued downside has a target of the High Volume Node, $10
Sa
GME setup is looking suspiciously similar to April 2024The GME chart currently has a very high pattern correlation with March/April 2024, leading into the run up to $80. The Auto Fractal with a 30 length segment period and 500 bar lookback finds the segment on it's own.
With Michael Burry starting to discuss GME, and macroeconomic stress starting to b

FUBO 1D is testing investor patienceFUBO is testing investor patience, yet it looks like a recovery candidate
FUBO is once again testing the major daily support zone between 2.90 and 3.00. This area is confirmed by rising volumes on pullbacks, consistent buyer reactions and a developing bullish divergence on oscillators. Recent

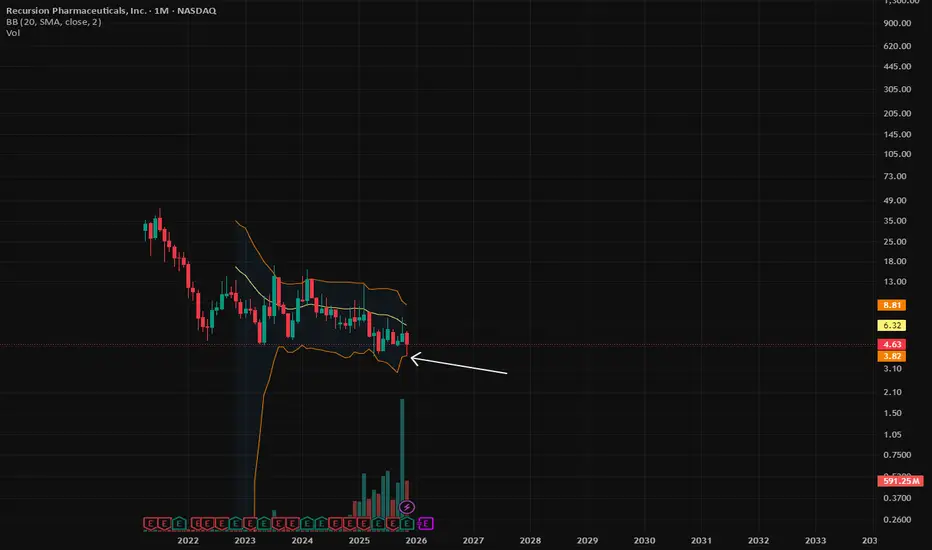
RXRX monthly close.www.tradingview.com
RXRX MC. Touched the lower BB, but got bought heavily. IMHO price is going to reclaim the 20ma MA in the upcoming month(s). Sell volume is dropping while buy volume is increasing. Institutions keep on buying as well. Shake out before breakout!
$DASH Director Lin Alfred buys $100 million worth of shares.The MACD is bottoming out with the lines crossing to the upside, and the RSI at 37.43 is holding and bouncing from its support level. Additionally, the 5-minute chart shows a solid price reaction off a well-defined trend line, while the 1-minute chart is forming strong consolidation—both reinforcing

AMD is an up for meBased on analyst ratings, Advanced Micro Devices's 12-month average price target is 284.67. Advanced Micro Devices has 32.37% upside potential, based on the analysts' average price target.

Sandisk Corporation ($SNDK) Jumps as Company Joins the S&P 500 Sandisk Corporation (NASDAQ: NASDAQ:SNDK ) delivered a strong performance as the stock closed at $223.28, gaining 3.83% on November 28. After-hours trading settled slightly lower at $222.99, yet the overall structure remains bullish. The momentum came as Sandisk officially entered the S&P 500, a ma

$HIMS BEARISH SENTIMENT If we can look into actions on volume and price. Institutional traders are luring retails to fomo with this surges which are basically traps to rekt em. Smart money are spoofing volume,$50 is a area that has acted as a supply zone multiple times not until it got broken downwards and the overall sent

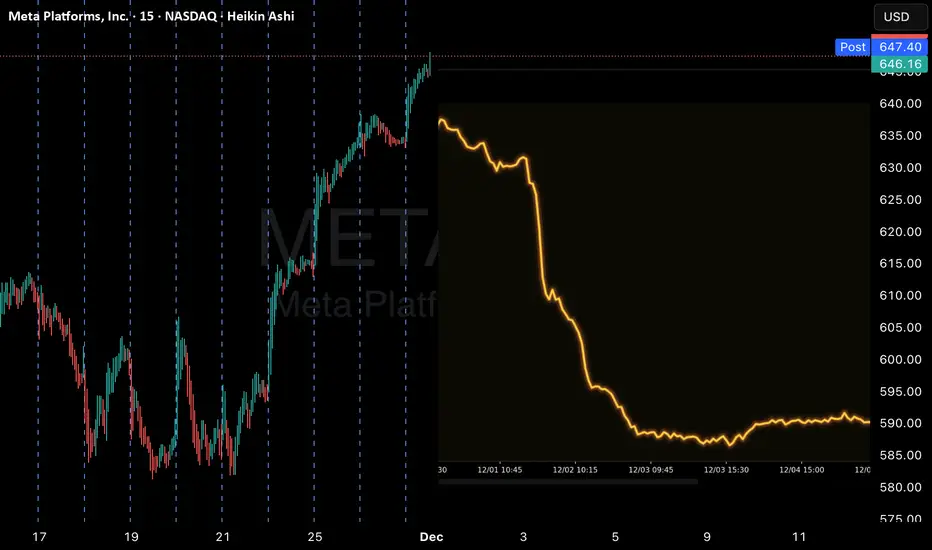
META QuantSignals V3 | Moderate Risk alretMETA Swing Signal — (2025-11-28)
Instrument: META
Direction: BUY CALLS 📈
Confidence: 60% (Medium)
Horizon / Expiry: 14 days → 2025-12-12
Strike Focus: $650.00
Entry Range: $12.50 – $13.50 (mid $13.00)
Target 1: $19.00 (+50%)
Target 2: $25.00 (+100%)
Stop Loss: $8.50 (-35%)
Position Size: 3% of port
Google at record highs but Wave 3 cluster/RSI screams pullback!Alphabet is leading the Magnificent Seven, hitting record highs near $330, while most AI and growth stocks, including Nvidia, have stalled. Since launching Gemini 3 in mid-November and with news of a $4.9 billion Berkshire stake, Alphabet has rallied more than 135% off its April low, outperforming a

See all stocks ideas
Tomorrow
VERUVeru Inc.
Actual
—
Estimate
−0.37
USD
Tomorrow
NTRBNutriband Inc.
Actual
—
Estimate
−2.13
USD
Tomorrow
DLTHDuluth Holdings Inc.
Actual
—
Estimate
−0.46
USD
Tomorrow
PLCEChildren's Place, Inc. (The)
Actual
—
Estimate
0.70
USD
Tomorrow
ASYSAmtech Systems, Inc.
Actual
—
Estimate
−0.03
USD
Tomorrow
TBHCThe Brand House Collective, Inc
Actual
—
Estimate
−0.42
USD
Tomorrow
USAUU.S. Gold Corp.
Actual
—
Estimate
−0.13
USD
Tomorrow
CANGCango Inc.
Actual
—
Estimate
−0.05
USD
See more events
Tomorrow
PPHCPublic Policy Holding Co. Inc.
Exchange
NASDAQ
Offer price
—
Tomorrow
DTDTDt House Ltd.
Exchange
NASDAQ
Offer price
4.00 - 5.00
USD
Tomorrow
HWEPHW ELECTRO Co. Ltd.
Exchange
NASDAQ
Offer price
—
Tomorrow
E
ELCGELC Group Holdings Ltd.
Exchange
NASDAQ
Offer price
4.00 - 6.00
USD
Tomorrow
AIGOAigo Holding Ltd.
Exchange
NASDAQ
Offer price
4.00 - 6.00
USD
Dec 5
R
RGNTRegentis Biomaterials Ltd.
Exchange
AMEX
Offer price
10.00 - 12.00
USD
See more events
Community trends
Bitcoin Only after breakout chanel resistance bull market again Soon we can expect price broke above channel resistance now it is near 93K$ and after that market will face huge gain only.
Step 1: Confirm the Breakout (The "Is It Real?" Check)
Don't buy the first tiny wick above the line. Wait for confirmation to avoid a false breakout:
Daily Close: W

Bitcoin Eyes Technical Pullback Before Next Upward MoveHello everyone,
Bitcoin is pausing after a rebound from the 86,000 USD area, but upward momentum faces resistance around 92,000 USD—where a red FVG, old supply zones, and heavy volume converge. Every approach to this area triggers downward pressure, producing red candles near supply zones, showing

Bitcoin Weakens After H&S Pattern: Next Stop, 89k?Hi!
It looks like price recently formed a pretty clean Head & Shoulders pattern on the 15m timeframe. The left shoulder, head, and right shoulder are all well-defined, and price has already broken beneath the neckline with a clear shift in structure. Momentum is leaning bearish.
The chart also sho

Bitcoin retracing SELL NOWthis is the safest way to enter a bitcvoin postion for the next couple of days , as we see seller doesn't want the price to push higher ; so it's going to reverse the movement for more liquidity or less market cap as money if running out of bitcoin

Bitcoin - The classic bullrun top creation!🗿Bitcoin ( CRYPTO:BTCUSD ) created the bullrun top:
🔎Analysis summary:
A couple of weeks ago, Bitcoin retested a major decade long resistance curve. Since Bitcoin then already created bearish confirmation, we are currently seeing an expected crackdown. Considering all the underlying trends, t

SOLUSDT Solana against the U.S. Dollar on the 1-hour timeframe, with several technical elements highlighted to visualize a potential bearish reversal setup
🔹 Overall Structure
The price recently climbed into a rising wedge pattern, indicated by two converging trendlines. These trendlines slope upward but

Hedera (HBAR): Good Buy Zone Forming Up | BullishHBAR reacted well from the same support zone that held multiple times in the past, showing that buyers are still defending this area. After the liquidity sweep, momentum slowly shifted and we’re now seeing early signs of a bullish push.
As long as buyers keep holding above this zone, the upside pla

ETHUSDT SELL POSITIONEthereum is currently under strong selling pressure, and with the price hovering around $3,000, it could easily drop back below $2,600. However, for a more reliable entry, the 4-hour timeframe gap around $3,250–$3,350 offers a much better zone to look for a sell position.
If price reaches this area

XRP Breakdown Risk: Triangle + Resistance = DropXRP( BINANCE:XRPUSDT ) is moving within a resistance zone($2.32-$2.19) and has shown notable reactions to the resistance line and the Potential Reversal Zone(PRZ) .
From a technical analysis perspective, it seems that XRP has formed a Symmetrical Triangle Pattern. If the lower line of this pattern

ETH - Bulls Waiting at the Intersection Zone!📈ETH remains overall bullish, moving steadily inside its rising channel. Every dip toward the lower bound has acted as a clean continuation point for the next push upward.
🏹As price pulls back , we will be looking for long setups once ETH retests the intersection of the lower trendline and the de

See all crypto ideas
Gold Ready for a Breakout – Watch This Zone!Gold is currently trading inside a well-defined symmetrical triangle, developing multiple BOS and CHoCH signals that indicate growing bullish momentum. After rejecting the lower trendline, price is now approaching a potential breakout zone.
A retest of the triangle’s upper boundary could trigger a

Gold: Safe-Haven Demand Surges After Venezuela TensionsHey Traders,
In the coming week we are monitoring XAUUSD for a potential buying opportunity around the 4,195 zone. Gold remains in a clear uptrend, and the current correction is guiding price back toward a major support-and-trendline confluence, where buyers have consistently defended the structure

Gold 4H – Can XAUUSD reject 4245 before diving into 4140?📈 Market Context
Gold rallied as the U.S. dollar closed softer on repriced Fed rate-cut expectations, with market headline flow confirming USD finishes lower and gold rallies on renewed cuts timing debates — a setup that encourages external liquidity raiding before weekly direction is revealed. Fore

XAUUSD: Strong Growth and Buying OpportunityWith the prospect of a Fed interest rate cut and the weakening of the USD, XAUUSD is showing signs of a strong growth phase. Based on macroeconomic news and technical charts, we can see that the price of gold continues to hold steady above the uptrend line .
XAUUSD is currently pulling back to in

XAU/USD | Gold hit $4200, Is It Time to Fall Again? (READ)By analyzing the #XAUUSD chart on the 4 hour timeframe, we can see that after the previous analysis, gold moved exactly as expected. Even with the low volatility during Thanksgiving, price still managed to hit both the $4190 and $4200 targets.
Once gold entered the supply zone at $4208 to $4244, it

XAUUSD: Bullish Push to 4380?As the previous analysis worked exactly as predicted, FX:XAUUSD is eyeing a bullish breakout on the 1-hour chart , with price rebounding from a key support near cumulative buy liquidation, converging with a potential entry zone that could ignite upside momentum if buyers hold against short-te

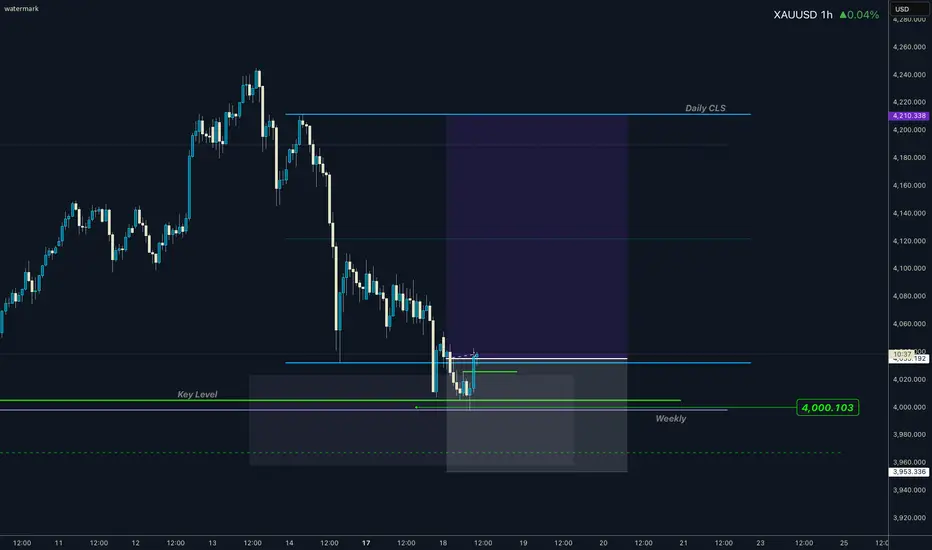
GOLD I Daily CLS I Model 1 nested in Weekly CLSHi friends, new range created. As always we are looking for the manipulation in to the key level around the range. Don't forget confirmation switch from manipulation phase to the distribution phase to make the setup valid. Stay patient and enter only after change in order flow. If price reaches 50%
XAUUSD – Weekly Scenario: Target Expands to 4,580 RegionXAUUSD – Weekly Scenario: Target Expands to 4,580 Region
Brian – Only prioritize buying if the price remains above 3,996
1. Market Overview – Breaks Triangle, Confirms Uptrend
On the D1 frame, gold has clearly broken out of the accumulation triangle that lasted for weeks.
The sixth candle closed ab

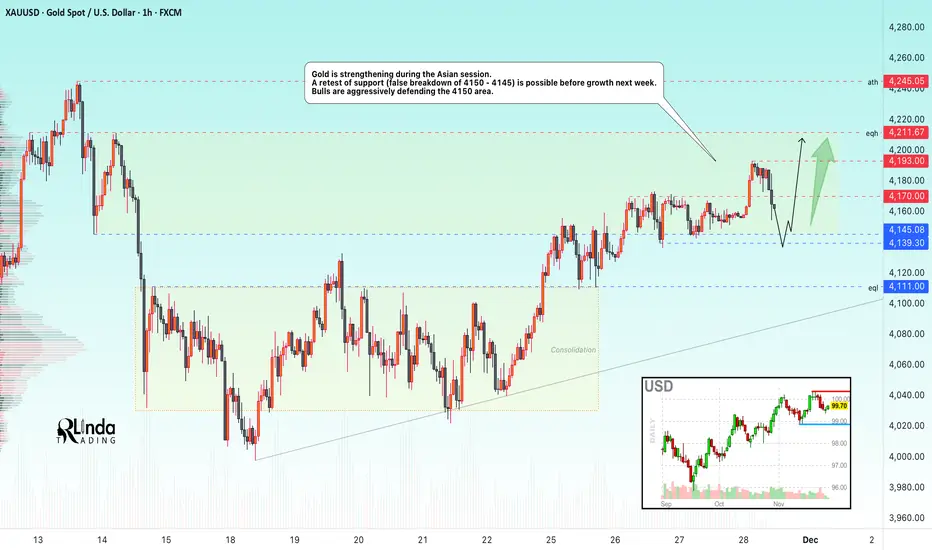
GOLD → Consolidation above 4150 amid a bullish market FX:XAUUSD breaks through 4170 and renews its high to 4193 during the Asian trading session. But further on, the market may consolidate before a possible continuation of growth...
The probability of a Fed rate cut in December remains at 82%. Geopolitical risks (Russia-Ukraine) continue to suppo
Gold's Final PushGold is clearly bullish, but the liquidity accumulation phase is not yet complete.
In my view, Gold is preparing to break the current Daily High Swing, but this high looks weak because of the recent sweep from the bottom.
The High-Probability Scenario:
Expect the price to sweep the high (a liquid

See all futures ideas
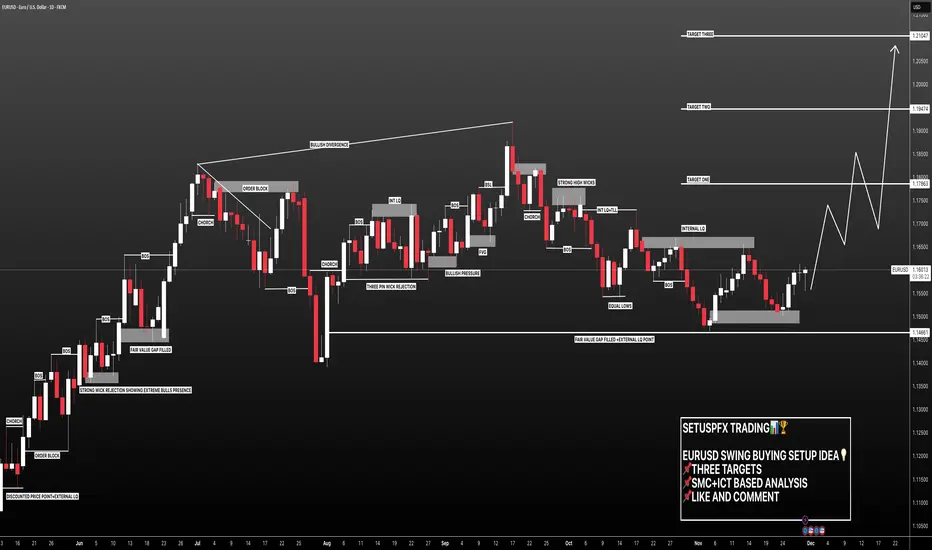
EURUSD: Reversal Almost Confirmed +1500 Pips In Making! FX:EURUSD
As outlined in our previous analysis, the price fell further than anticipated. Given this region, we believe the price has reversed from a crucial level. Consequently, we anticipate a significant price increase. A swing bullish move is possible, potentially gaining around +1500 pips if
GBPUSCHello Traders! 👋
What are your thoughts on GBPSUD?
GBP/USD has broken out of its descending channel and is now pulling back to retest the broken structure.
Once the pullback to the broken level is completed, the pair is expected to resume its upward movement toward the marked target level.
As long

EURUSD: Sellers Target Move Toward 1.15200 SupportHello everyone, here is my breakdown of the current EURUSD setup.
Market Analysis
EURUSD continues to trade within a corrective market structure after a strong bullish impulse that formed an Upward Channel earlier in the month. Once price broke below that channel, the pair shifted into a broader


USD/JPY - H4 - Breakdown Watch!(29.11.2025)📝 Technical Description FX:USDJPY
USD/JPY has been moving inside a clean ascending channel on the H4 timeframe.
Price is now sitting inside the Reversal Zone, struggling to break above the channel’s mid-line resistance. A bearish correction is possible if the market fails to reclaim the upper zo

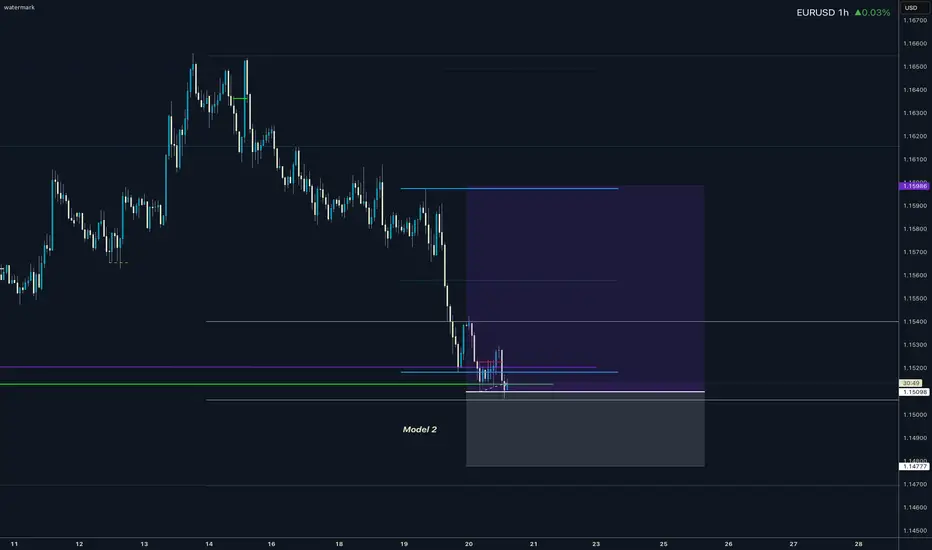
EURUSD I Daily CLS Model 1 I Monthly I Model 2Hi friends, new range created. As always we are looking for the manipulation in to the key level around the range. Don't forget confirmation switch from manipulation phase to the distribution phase to make the setup valid. Stay patient and enter only after change in order flow. If price reaches 50%
Elise | GBPUSD 8H —Weak High Target in Sight | Channel StructureFX:GBPUSD
Price behavior suggests institutional accumulation after a trend rejection and channel retest. As long as price remains above channel midline and reclaim structure, bullish continuation is favored toward the major liquidity grab zone. Retracement into the demand region around 1.3100–1.32

AUD/USD: Buying Opportunity with Continued UptrendCurrently, AUD/USD is continuing its strong uptrend, and with macroeconomic factors supporting this move, the price is likely to continue rising in the short term. After breaking the 0.65 level, this pair is heading towards higher resistance levels, with the nearest target being 0.6570.
With high


AUDUSD Breakout and Potential RetraceHey Traders, in the coming week we are monitoring AUDUSD for a buying opportunity around 0.65400 zone, AUDUSD was trading in a downtrend and successfully managed to break it out. Currently is in a correction phase in which it is approaching the retrace area at 0.65400 support and resistance area.
Tr

See all forex ideas
| - | - | - | - | - | - | - | ||
| - | - | - | - | - | - | - | ||
| - | - | - | - | - | - | - | ||
| - | - | - | - | - | - | - | ||
| - | - | - | - | - | - | - | ||
| - | - | - | - | - | - | - | ||
| - | - | - | - | - | - | - | ||
| - | - | - | - | - | - | - |
Trade directly on the supercharts through our supported, fully-verified and user-reviewed brokers.


