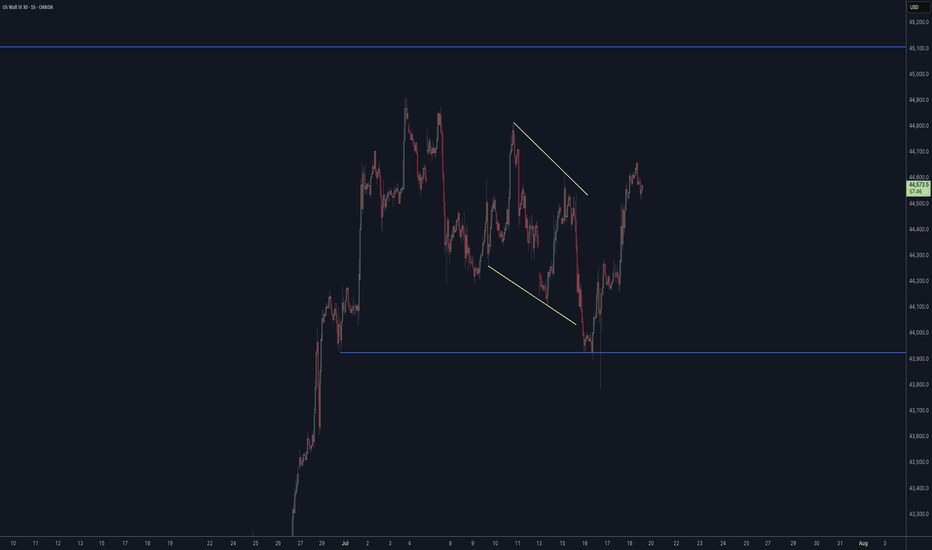
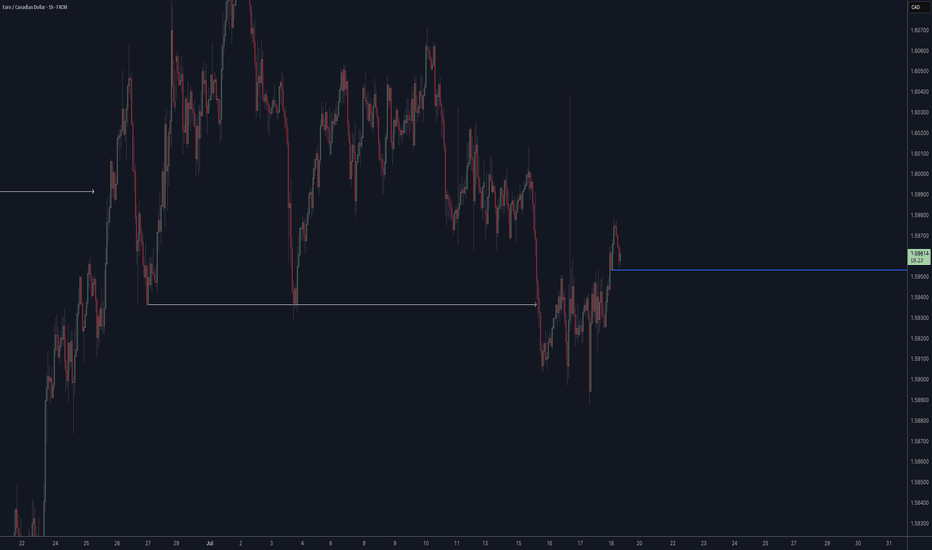
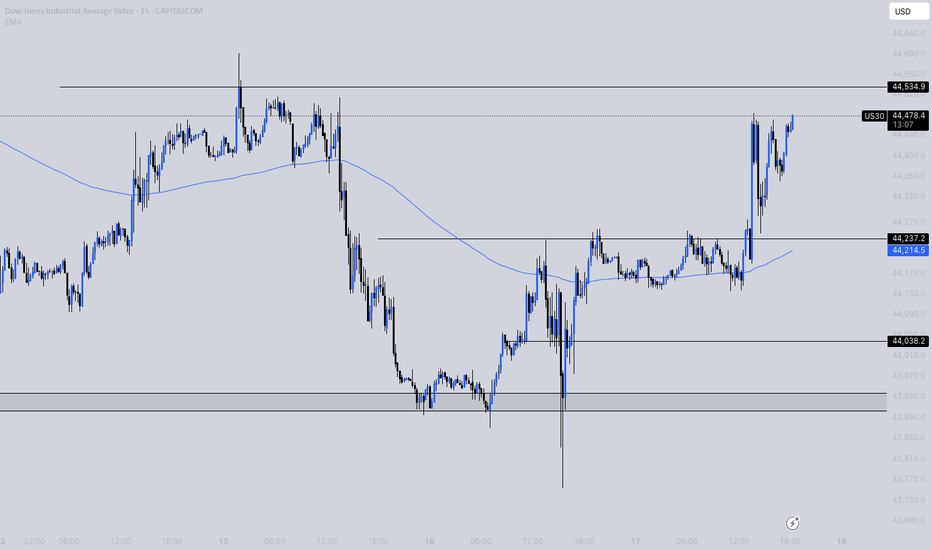
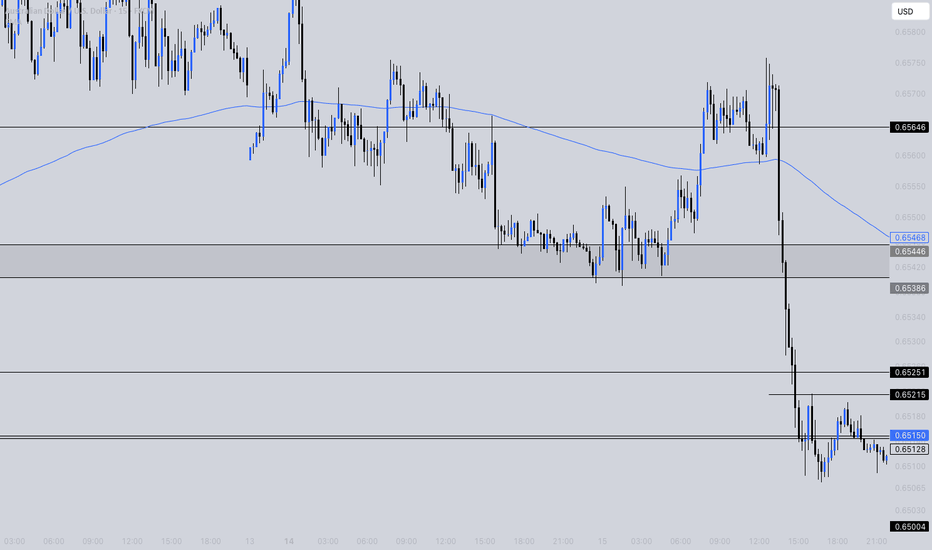
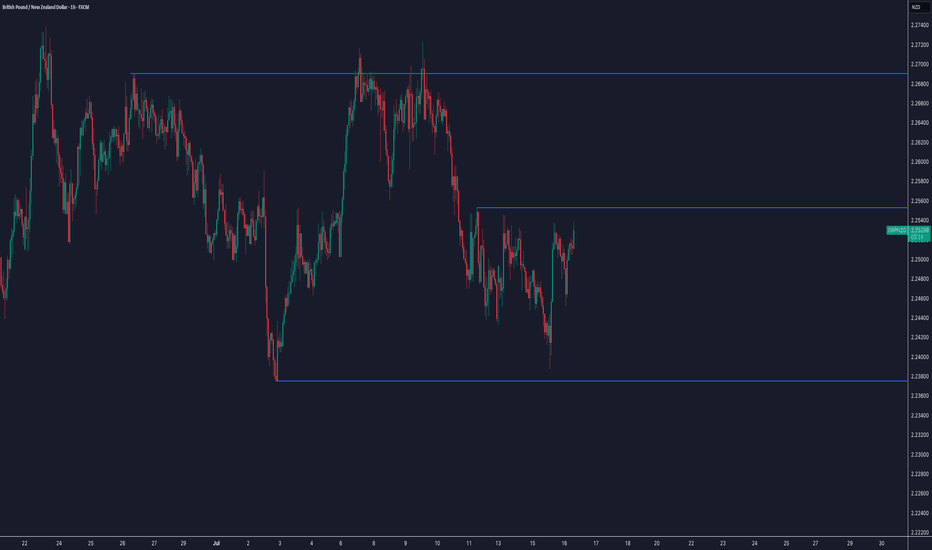
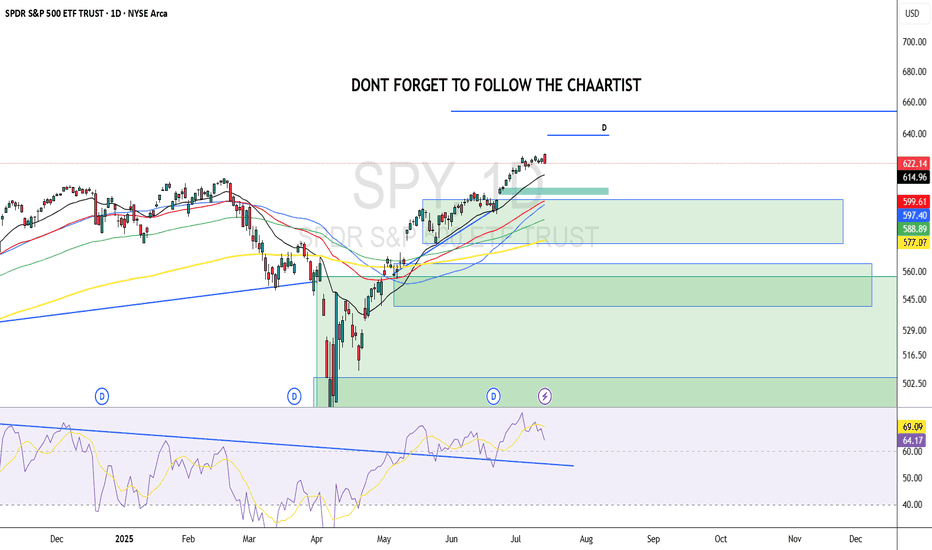
EURUSD & US30 Trade Recaps 18.07.25A long position taken on FX:EURUSD for a breakeven, slightly higher in risk due to the reasons explained in the breakdown. Followed by a long on OANDA:US30USD that resulted in a loss due to the volatility spike that came in from Trump.
Full explanation as to why I executed on these positions and the management plan with both.
Any questions you have just drop them below 👇
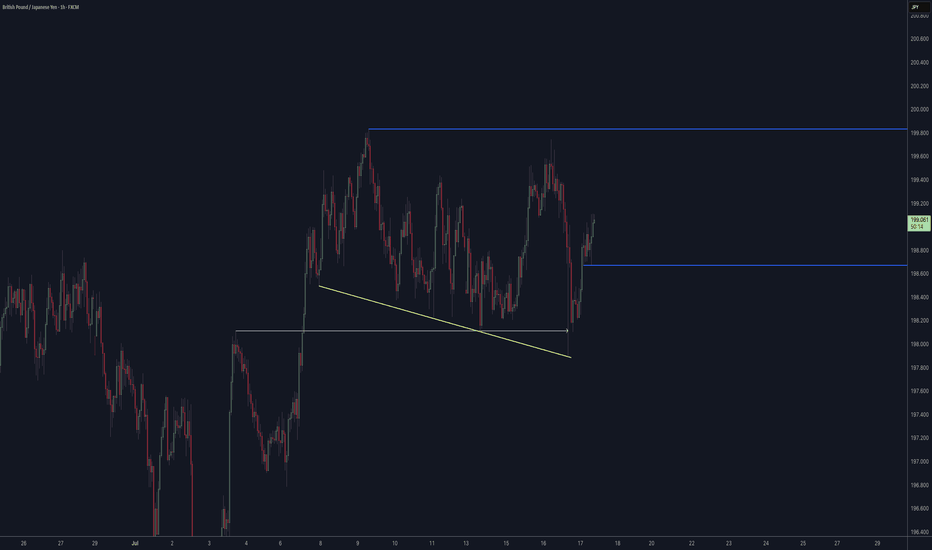
Harmonic Patterns
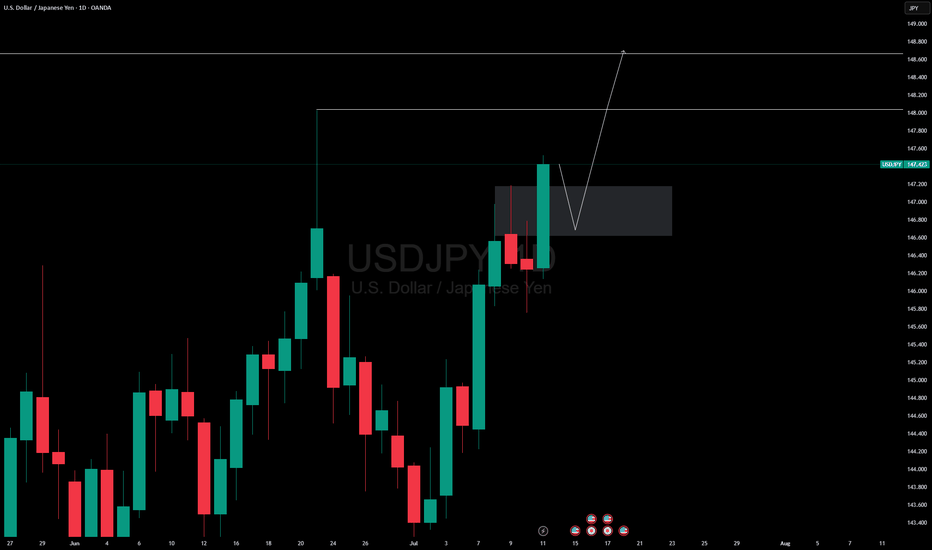
USDJPY INTRADY OPPORTUNITY Hello traders , here is the full multi time frame analysis for this pair, let me know in the comment section below if you have any questions , the entry will be taken only if all rules of the strategies will be satisfied. wait for more price action to develop before taking any position. I suggest you keep this pair on your watchlist and see if the rules of your strategy are satisfied.
🧠💡 Share your unique analysis, thoughts, and ideas in the comments section below. I'm excited to hear your perspective on this pair .
💭🔍 Don't hesitate to comment if you have any questions or queries regarding this analysis.
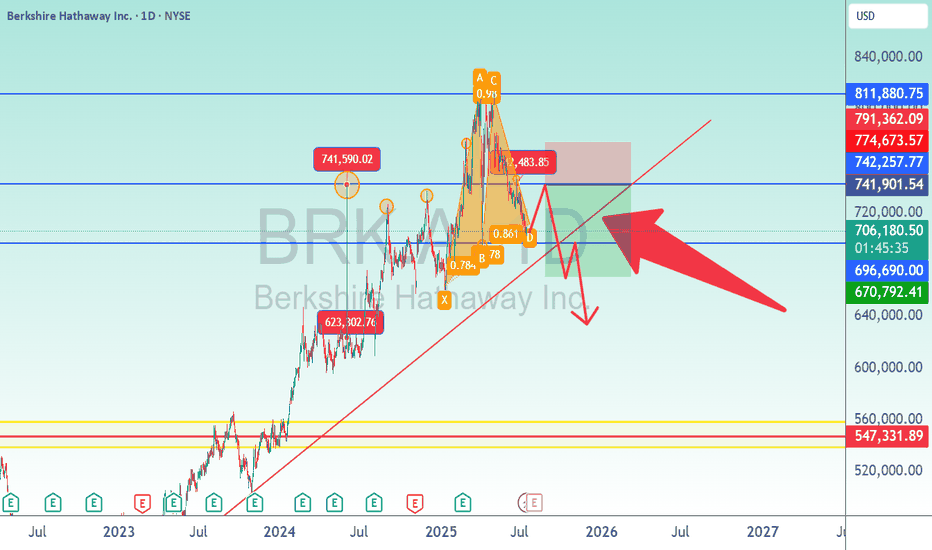
Bershire Hathaway Stock Analysis/BRK.AI looked at this particular stock because of insane activity from $623,302 to $741,590 in one day. That rejection told me to pay attention Money was coming to the door. So if the market is approaching this area again, rejection is the likely response. Looking at a short is temporary. This market is bullish in nature.
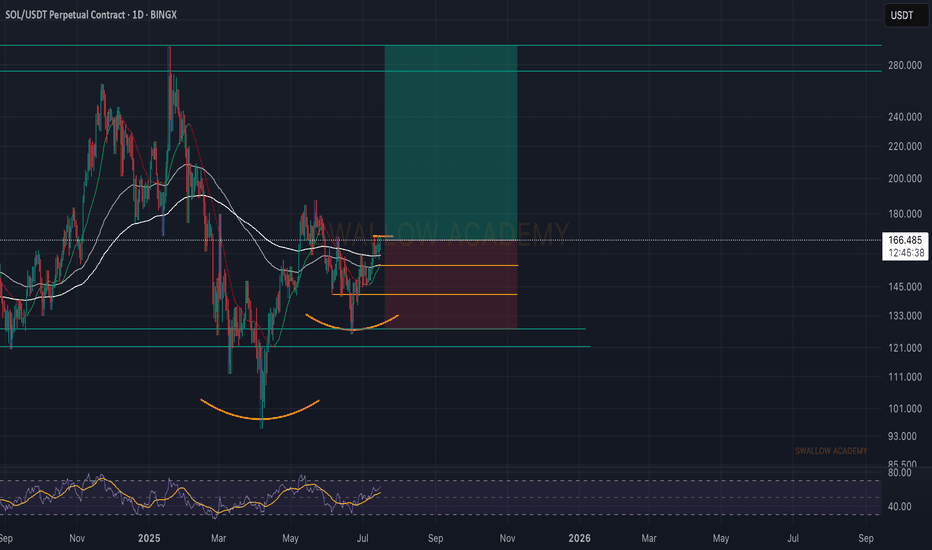
Bitcoin -> The bullrun is not over!📣Bitcoin ( CRYPTO:BTCUSD ) is still totally bullish:
🔎Analysis summary:
A couple of months ago Bitcoin broke above the previous all time high. This was basically just the expected creation of new highs, perfectly following the underlying cycles. With respect to the long term rising channel formation, this bullrun on Bitcoin is just starting.
📝Levels to watch:
$100.000
🙏🏻#LONGTERMVISION
Philip - Swing Trader
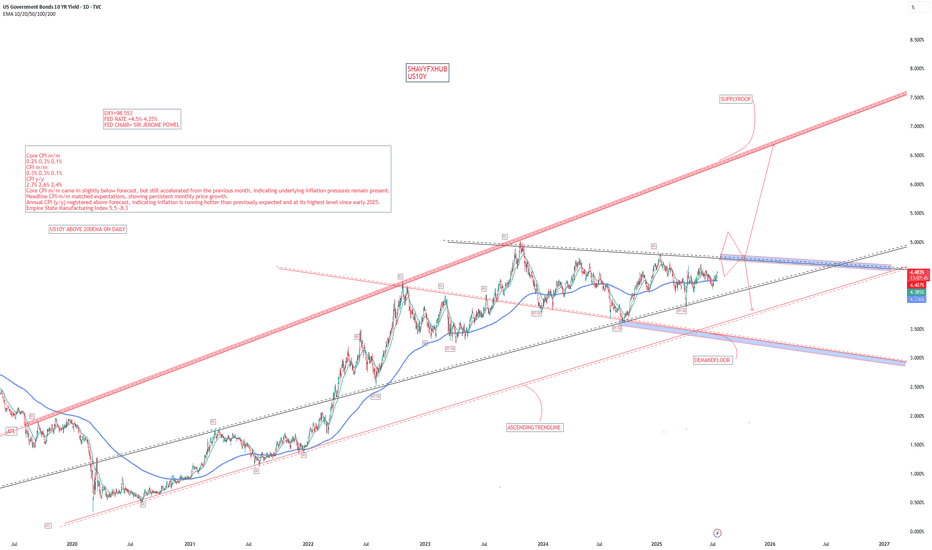
US10Y UNITED STATES GOVERNMENT 10 YEAR BOND YIELD .US 10-Year Treasury Yield Reaction to July 15, 2025 Economic Data
Key Economic Data (July 15, 2025)
Indicator Actual Forecast Previous
Core CPI m/m 0.2% 0.3% 0.1%
CPI m/m 0.3% 0.3% 0.1%
CPI y/y 2.7% 2.6% 2.4%
Empire State Mfg Index 5.5 — -8.3
Market Reaction: US 10-Year Treasury Yield
Yield Movement:
The US 10-year Treasury yield rose sharply to 4.495% on July 15, 2025, up from 4.43% the previous market day—a gain of 7 basis points.
Immediate Cause:
This jump occurred as the inflation data, while showing softer core CPI than forecast, delivered a higher-than-expected annual CPI (2.7% y/y vs. 2.6% forecast) and robust CPI m/m. Additionally, the Empire State Manufacturing Index rebounded strongly, further supporting concerns over persistent price pressures and economic momentum.
Market Interpretation:
Investors increasingly scaled back expectations for near-term Federal Reserve rate cuts, causing a sell-off in Treasuries and pushing yields higher.
Persistent inflation—especially with annual CPI running above consensus—suggests the Fed may need to keep rates higher for longer, amplifying bond market volatility.
The improved manufacturing sentiment also fueled the belief that the US economy remains resilient, reinforcing the hawkish read on interest rates.
Summary Table: US 10-Year Yield
Date Yield Daily Change
July 15, 2025 4.495% +0.07%
July 14, 2025 4.43% —
Key Takeaways
US10Y jumped by 7 bps to its highest level in five weeks after the mixed inflation report and strong manufacturing data.
Investor sentiment shifted toward fewer and later Fed rate cuts as inflation proved more stubborn than forecast.
The yield reaction underscores ongoing sensitivity to inflation surprises and economic resilience in 2025.
The bond market’s move highlights that even minor upsets to the inflation outlook can quickly ripple through rates, especially when compounded by positive growth signals.
#US10Y
XAUUSD MULTI TIME FRAME ANALYSISHello traders , here is the full multi time frame analysis for this pair, let me know in the comment section below if you have any questions , the entry will be taken only if all rules of the strategies will be satisfied. wait for more price action to develop before taking any position. I suggest you keep this pair on your watchlist and see if the rules of your strategy are satisfied.
🧠💡 Share your unique analysis, thoughts, and ideas in the comments section below. I'm excited to hear your perspective on this pair .
💭🔍 Don't hesitate to comment if you have any questions or queries regarding this analysis.
GBPUSD MULTI TIME FRAME ANALYSISHello traders , here is the full multi time frame analysis for this pair, let me know in the comment section below if you have any questions , the entry will be taken only if all rules of the strategies will be satisfied. wait for more price action to develop before taking any position. I suggest you keep this pair on your watchlist and see if the rules of your strategy are satisfied.
🧠💡 Share your unique analysis, thoughts, and ideas in the comments section below. I'm excited to hear your perspective on this pair .
💭🔍 Don't hesitate to comment if you have any questions or queries regarding this analysis.
USDJPY MULTI TIME FRAME ANALYSISHello traders , here is the full multi time frame analysis for this pair, let me know in the comment section below if you have any questions , the entry will be taken only if all rules of the strategies will be satisfied. wait for more price action to develop before taking any position. I suggest you keep this pair on your watchlist and see if the rules of your strategy are satisfied.
🧠💡 Share your unique analysis, thoughts, and ideas in the comments section below. I'm excited to hear your perspective on this pair .
💭🔍 Don't hesitate to comment if you have any questions or queries regarding this analysis.
WTI USOIL WTI oil ,watch oil inventory and opec data report for clear directional bias . if the monthly candle closes above the supply roof,it will be a long confirmation if demand holds .the probability of rejection is high, because the current candle is coming as a retest candle to broken demand floor that served as bench mark oil price level 65$-68$ zone for long time .
#oil #opec #usoil #wti
WTI US OIL US Oil (WTI Crude) Price Context
Price: WTI crude oil futures settled at approximately $68.66 per barrel close of friday.
Prices rebounded after a prior decline, supported by strong summer travel demand, high refinery utilization, and supply management efforts by major producers like Russia and Saudi Arabia.
Outlook: Despite near-term supply tightness, the International Energy Agency (IEA) and OPEC forecast a potential surplus later in 2025 and slower demand growth through 2026–2029, especially due to slower Chinese economic growth.
The DXY measures the USD strength against a basket of major currencies and often moves inversely to commodities priced in USD like oil.
When the DXY strengthens, oil prices can face downward pressure due to higher USD value making oil more expensive in other currencies.
Conversely, a weaker DXY tends to support higher oil prices.
Current Dynamics:
If geopolitical risks or supply constraints push oil prices up, the USD may weaken as markets price in inflationary pressures.
Conversely, if the USD strengthens due to safe-haven demand or monetary policy, oil prices may soften.
#usoil
MSTR MICROSTRATEGY As of July 11, 2025, MicroStrategy Incorporated (MSTR) is trading at approximately $434.58 per share on the NASDAQ, showing a strong daily gain of about 3.04% (+$12.84). The stock has experienced significant growth recently, with a 3-month return of around 45% and a 1-year return exceeding 220%.
Key Highlights about MicroStrategy (MSTR):
Industry: Software - Application
Market Cap: Approximately $118.8 billion
Shares Outstanding: About 273 million
Trading Range (Year): Low near $102.40 and high around $543.00
Volume: Active trading with daily volumes around 18 million shares
CEO: Phong Q. Le
Headquarters: Tysons Corner, Virginia, USA
Business: MicroStrategy provides enterprise analytics software and services, including a platform for data visualization, reporting, and analytics. It serves a broad range of industries including finance, retail, technology, and healthcare.
Recent Price Trend
The stock has steadily appreciated from about $255 in February 2025 to over $430 in July 2025.
Recent trading range for July 11 was between $423.70 and $438.70.
After-hours trading shows a slight dip to around $433.25.
Outlook
The next earnings announcement is scheduled for July 31, 2025.
Analysts forecast the stock price could range between $434.58 and $798.13 in 2025, reflecting optimism about the company’s growth prospects and market position.
MicroStrategy’s strong correlation with Bitcoin price movements (due to its large BTC holdings) often influences its stock volatility and performance.
In summary: MicroStrategy is a major player in enterprise analytics software with a highly volatile stock influenced by its Bitcoin exposure and market sentiment. Its stock price has surged strongly in 2025, reflecting both business fundamentals and crypto market dynamics.
GB10Y UK GOVERNMENT 10 YEAR BOND YIELD
The current Governor of the Bank of England is Andrew Bailey.
Appointment: Andrew Bailey has served as Governor since March 16, 2020, and his term runs until March 15, 2028.
Role: As Governor, he chairs the Monetary Policy Committee, Financial Policy Committee, and Prudential Regulation Committee.
Background: Prior to his appointment as Governor, Bailey was Chief Executive Officer of the Financial Conduct Authority (FCA) and has held several senior roles within the Bank of England, including Deputy Governor for Prudential Regulation.
Recent Activity: He remains active in shaping UK monetary policy and financial stability, and was recently nominated as the next Chair of the Financial Stability Board, beginning July 2025.
Andrew Bailey continues to lead the Bank of England through significant economic and financial developments.
Upcoming UK Economic Reports (July 13–17, 2025)
Below is a schedule of major UK economic releases and events for the coming week, with local times (BST):
Date Time (BST) Event
July 13, Sun 06:00 AM Core Inflation Rate MoM
July 13, Sun 06:00 AM Retail Price Index MoM
July 13, Sun 06:00 AM Retail Price Index YoY
July 14, Mon 12:00 PM NIESR Monthly GDP Tracker
July 14, Mon 11:01 PM BRC Retail Sales Monitor YoY
July 15, Tue 09:00 AM Treasury Stock 2032 Auction
July 15, Tue 08:00 PM BoE Governor Andrew Bailey Speech
July 16, Wed 06:00 AM Inflation Rate YoY
July 16, Wed 06:00 AM Core Inflation Rate YoY
July 16, Wed 06:00 AM Inflation Rate MoM
July 16, Wed 06:00 AM Core Inflation Rate MoM
July 16, Wed 06:00 AM Retail Price Index MoM
July 16, Wed 06:00 AM Retail Price Index YoY
July 16, Wed 09:00 AM Treasury Gilt 2034 Auction
July 17, Thu 06:00 AM Unemployment Rate
July 17, Thu 06:00 AM Average Earnings incl. Bonus (3Mo/Yr)
July 17, Thu 06:00 AM Employment Change
July 17, Thu 06:00 AM Average Earnings excl. Bonus (3Mo/Yr)
July 17, Thu 06:00 AM HMRC Payrolls Change
July 17, Thu 06:00 AM Claimant Count Change
July 17, Thu 09:00 AM Treasury Gilt 2030 Auction
Note: All times are in British Summer Time (BST). These events are subject to change based on official updates.
Key releases include inflation data, labor market statistics, retail sales, and several government bond auctions. The Bank of England Governor's speech is also a major event for markets with price volatility .
the UK 10-year gilt yield (UK10Y) is approximately 4.63%, having edged up 0.03 percentage points from the previous session. Over the past month, it has risen about 0.15 points and is 0.52 points higher than a year ago, reflecting persistent inflation concerns and expectations about Bank of England (BoE) monetary policy.
Correlation Between UK10Y, UK10, and GBP Strength
UK10Y Yield and GBP:
The 10-year gilt yield is a key indicator of UK long-term borrowing costs and investor sentiment. Higher yields typically attract foreign capital seeking better returns, which tends to strengthen the British pound (GBP). Conversely, expectations of BoE rate cuts or economic weakness can pressure yields lower and weaken GBP.
Recent Dynamics:
Despite inflation remaining above 3%, the UK economy has shown signs of contraction (GDP shrinking 0.1% in May), prompting markets to price in an 80% chance of a BoE rate cut in August. This has led to some volatility in yields and GBP strength.
The BoE’s policy rate has already been reduced from 5.25% to 4.25% over the past year, and further easing is anticipated, which can weigh on the GBP.
UK10 (Shorter-Term Yields) vs. UK10Y:
Shorter-term gilt yields (e.g., 2-year or 5-year) tend to be more sensitive to immediate BoE policy moves, while the 10-year yield reflects longer-term inflation and growth expectations. A steepening yield curve (rising long-term yields relative to short-term) can indicate confidence in economic recovery and support GBP. A flattening or inverted curve may signal caution and pressure GBP.
GBP Strength Mixed; supported by higher yields but pressured by economic slowdown and easing expectations
Yield Curve Moderately steep, reflecting growth/inflation expectations
In essence: The UK 10-year gilt yield at 4.63% supports GBP strength by attracting yield-seeking capital, but the expected BoE rate cut and economic weakness introduce downside risks. The interplay between short- and long-term yields and BoE policy guidance will continue to influence GBP’s trade directional bias .
UK GOVERNMENT 10 YEAR BOND PRICE GB10Relationship Between GB10 Price and GBP Strength
Inverse Relationship:
Bond prices and yields move inversely. When gilt yields rise (due to inflation concerns or expectations of tighter monetary policy), gilt prices fall. Conversely, if yields fall, prices rise.
Impact on GBP:
Higher UK gilt yields, reflecting higher interest rates or inflation expectations, tend to attract foreign capital seeking better returns. This supports demand for the British pound (GBP), strengthening the currency.
However, if yields rise due to inflation fears without confidence in economic growth, or if rate cuts are expected, GBP strength may be limited.
Current Market Context:
The UK economy has shown signs of contraction, and markets are pricing in an 80% chance of a Bank of England rate cut in August 2025. This dynamic creates some volatility:
Yields remain elevated (4.63%), supporting GBP.
Expectations of easing may cap GBP gains and pressure gilt prices higher (yields lower).
GBP Strength Supported by higher yields but tempered by expected BoE easing
Market Drivers Inflation, economic contraction, BoE rate expectations
Conclusion
The current UK 10-year gilt price near 99.0 and yield around 4.63% reflect a market balancing inflation risks and economic slowdown. Elevated yields help support GBP strength by attracting yield-seeking investors, but the prospect of Bank of England rate cuts and economic weakness limit upside for the pound.
#GBP #GB10 #GB10Y
