The Christmas Silver Finally Breaks FreeFor decades, Silver has celebrated the holidays the same way 🎄
Strong rallies.
Rising excitement.
And a familiar ceiling.
🎄 Christmas 1980
Silver climbed like a Christmas tree, fast, vertical, and emotional.
The star was reached at the $50 level.
And just like that, the lights went out ✨
The
Your 2025 space mission is here
Suit up and get ready to explore every highlight of your trading galaxy.


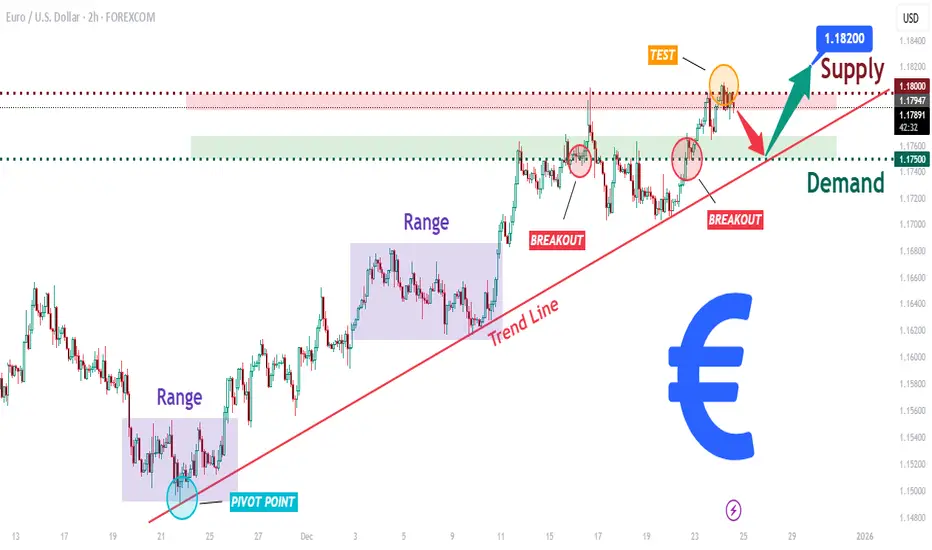
EURUSD Long: Trend Line Support Keeps Buyers, Move to 1.8200Hello traders! Here’s a clear technical breakdown of EURUSD (2H) based on the current chart structure. EURUSD is trading in a well-defined bullish trend, supported by a rising trend line that has guided price action from the recent pivot low. After an initial consolidation phase, price broke out of
US30 H1 | Bullish ContinuationMomentum: Bullish
Price is currently above the ichimoku cloud.
Buy entry: 48,426.11
- Overlap support
- 38.2% Fib retracement
Stop Loss: 48,229.27
- Overlap support
Take Profit: 48,687.99
- Swing high resistance
- 100% Fib projection
High Risk Investment Warning
Stratos Markets Limited (tradu.c

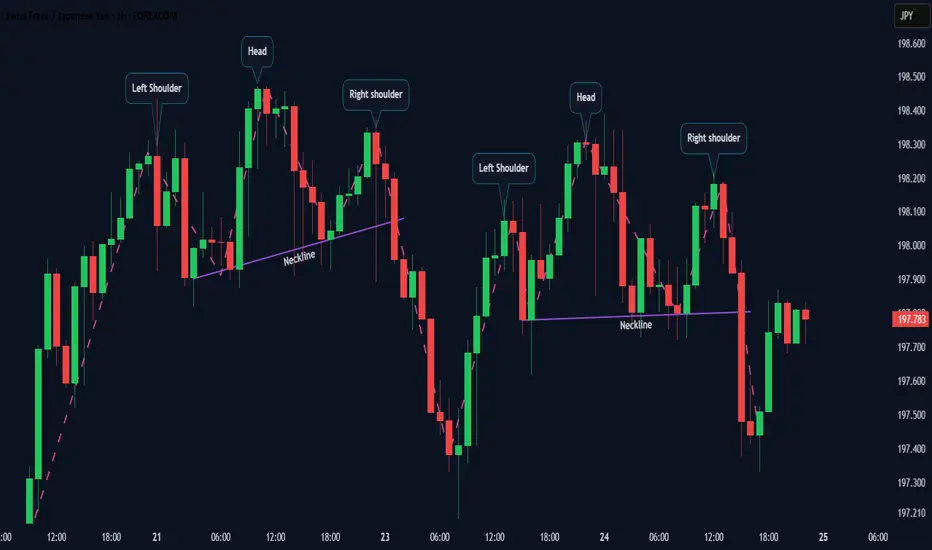
Rare Double Head & Shoulders After an Uptrend Market Context
After a sustained uptrend, price started to lose momentum and formed a classic Head & Shoulders pattern. What makes this structure interesting is that the market did not reverse impulsively — instead, it developed a second Head & Shoulders formation shortly after the first one.
Silver Price Hits a Record High Near $72Silver Price Hits a Record High Near $72
On 12 December, we noted that silver had climbed above $60. It took the market less than two weeks to advance further and clear the next psychological milestone at $70.
Today, XAG/USD reached $72, extending the sharp rally that began in the autumn. Gold pr

TRU Retesting Broken Falling Wedge SupportTRU previously formed a falling wedge during a prolonged bearish phase. That structure has now resolved to the downside, with price breaking below the wedge support and accepting lower levels.
After the breakdown, price is currently retesting the former wedge support, which has now flipped into res

Nvidia (NVDA) Shares Rise On Potential Chip Shipments to ChinaNvidia (NVDA) Shares Rise On Potential Chip Shipments to China
According to Reuters sources, Nvidia has informed Chinese clients of plans to begin shipments of its H200 chips by mid-February 2026. This has been made possible by a recent change in US export policy, which allows the sale of advanced

NZDUSD H4 | Bullish Bounce Off PullbackMomentum: Bullish
Price has bounced off the buy entry, which is acting as a pullback support. This level aligns with the 38.2% Fibonacci retracement, adding significant confluence and strength to the zone.
Buy Entry: 0.5743
Overlap support
Slightly above the 38.2% Fibonacci retracement
Stop Loss:

XAUUSD (H1) – Trading by LiquidityXAUUSD (H1) – Trading by Liquidity
Price breaks the channel but buying power is weakening, wait for a pullback to the trendline to enter a trade
Summary of today's strategy
Gold has broken the price channel, but the key point is that buying power is weakening after the breakout. As the market is a

Price Is Rising Fast, but the Key Move Lies in the Pullback to 4Hello, I'm Domic.
Looking closely at the H4 chart, gold is currently in a very strong acceleration phase. A steep sequence of bullish candles has pushed price into the 4.48xx area, while both trendlines on the chart are clearly sloping upward. This confirms that the uptrend remains dominant, but i

See all editors' picks ideas
Multi-Distribution Volume Profile (Zeiierman)█ Overview
Multi-Distribution Volume Profile (Zeiierman) is a flexible, structure-first volume profile tool that lets you reshape how volume is distributed across price, from classic uniform profiles to advanced statistical curves like Gaussian, Lognormal, Student-t, and more.
Instead of forcin

Multi-Ticker Anchored CandlesMulti-Ticker Anchored Candles (MTAC) is a simple tool for overlaying up to 3 tickers onto the same chart. This is achieved by interpreting each symbol's OHLC data as percentages, then plotting their candle points relative to the main chart's open. This allows for a simple comparison of tickers to tr

Vdubus Divergence Wave Pattern Generator V1The Vdubus Divergence Wave Theory
10 years in the making & now finally thanks to AI I have attempted to put my Trading strategy & logic into a visual representation of how I analyse and project market using Core price action & MacD. Enjoy :)
A Proprietary Structural & Momentum Confluence System

Per Bak Self-Organized CriticalityTL;DR: This indicator measures market fragility. It measures the system's vulnerability to cascade failures and phase transitions. I've added four independent stress vectors: tail risk, volatility regime, credit stress, and positioning extremes. This allows us to quantify how susceptible markets are

Volatility Risk PremiumTHE INSURANCE PREMIUM OF THE STOCK MARKET
Every day, millions of investors face a fundamental question that has puzzled economists for decades: how much should protection against market crashes cost? The answer lies in a phenomenon called the Volatility Risk Premium, and understanding it may fundam

Volume Gaps & Imbalances (Zeiierman)█ Overview
Volume Gaps & Imbalances (Zeiierman) is an advanced market-structure and order-flow visualizer that maps where the market traded, where it did not, and how buyer-vs-seller pressure accumulated across the entire price range.
The core of the indicator is a price-by-price volume prof

Match Finder [theUltimator5]Match Finder is the dating app of indicators. It takes your current ticker and finds the most compatible match over a recent time period. The match may not be Mr. right, but it is Mr. right now. It doesn't forecast future connection, but it tells you current compatibility for today.
Jokes aside,

Trend Line Methods (TLM)Trend Line Methods (TLM)
Overview
Trend Line Methods (TLM) is a visual study designed to help traders explore trend structure using two complementary, auto-drawn trend channels. The script focuses on how price interacts with rising or falling boundaries over time. It does not generate trade sign

Breakouts & Pullbacks [Trendoscope®]🎲 Breakouts & Pullbacks - All-Time High Breakout Analyzer
Probability-Based Post-Breakout Behavior Statistics | Real-Time Pullback & Runup Tracker
A professional-grade Pine Script v6 indicator designed specifically for analyzing the historical and real-time behavior of price after strong All-Ti

Count█ OVERVIEW
A library of functions for counting the number of times (frequency) that elements occur in an array or matrix.
█ USAGE
Import the Count library.
import joebaus/count/1 as c
Create an array or matrix that is a `float`, `int`, `string`, or `bool` type to count elements from, t

See all indicators and strategies
Community trends
Novo Nordisk (NVO) 1WI’m looking at the weekly NVO chart as of late December 2025, and this is no longer about fear or headlines. It’s about structure and valuation. After a powerful multi year rally from 2022 to 2024, the stock went through a deep and healthy correction. In 2025, price built a strong weekly demand base

$ORCL | The Island Reversal Signal Watching NYSE:ORCL closely. Despite the sharp initial drop, the formation of an Island Reversal 🏝️ suggests that the selling pressure has exhausted itself. We are now seeing a constructive effort to fill the gap 📈. With the price stabilizing and showing signs of a trend reversal, the bulls might b

More Bearish Opining on TeslaTesla in a very competitive landscape and valuations need to come down.

Decent RR in a Range PlayI'm scale-in position sizing of course, since there's plenty of room to go down and still be valid, but shaping up for a nice range play. All AVWAPS overhead. There's some news of AI re-structuring, layoffs, yada yada. We'll see.
Educational purposes only.

$NVO is 2026 top trade idea. Offers risk adjusted 50-100%- NYSE:NVO has most likely bottom and offer 50-100% upside from ~$50ish level.
- Weight loss technical addressable market is exploding. People are getting weight & fat conscious.
- Weight loss pill will make it accessible for lot of people. It's quite easy to consume than injectables.

WATCH FOR MSTR HIGH PROBABILITY LONG SETUP SOON!!!🚨 MSTR HIGH PROBABILITY BUY SETUP 🚨
* Here We Can See Clearly The Next Potential Moves For MSTR Coming Hours/Days.
* Keep Your Eyes Close On Your Trading Positions.
* Happy PIP Hunting Traders.
FXKILLA.

$NVO Quality GIGA-LONNNNNNNGGGGG!!!This is a weekly of NVO, a global leader in pharmaceuticals addressing issues like obesity, diabetes, among other things. Ever hear of Ozempic? This company makes it. They also have other products in their pipeline which intend to capitalize on these growing epidemics, such as the recently approve

TSLA Weekly Liquidity zonesSmart money got retail traders to short below the sideways channel, me included, then they push it to new highs to get retail traders to buy so they can get their liquidity to sell into. They are using the round number 500 to trap traders as they break above and then below it. I'm expecting an ex

ORCL - Long IdeaPrice has pulled back into higher-timeframe demand and is now compressing under resistance. What matters here isn’t the candles — it’s the liquidity.
The trendline labeled "$$$$$" shows there is stacked liquidity (proven with volume profile).
Expected path:
Minor chop to build pressure
Liquidity s

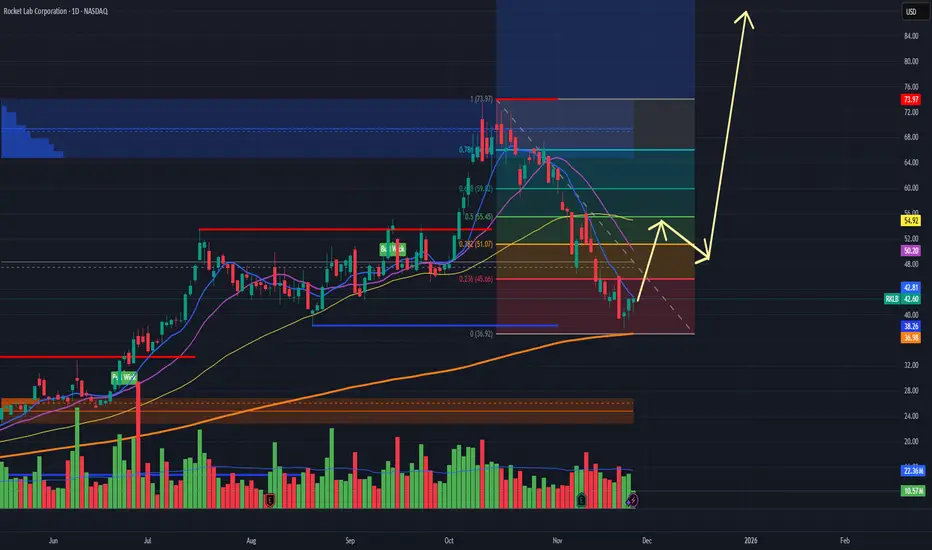
Rocket Lab to 80$Rocket Lab
NASDAQ:RKLB is showing a high-probability setup for a major run, supported by a bullish technical structure and strong underlying fundamentals.
Technical Perspective
The daily chart reveals Rocket Lab has bounced off its recent lows near $36.90 on 200SMA, forming a potential bottom
See all stocks ideas
Today
IMMRImmersion Corporation
Actual
—
Estimate
0.10
USD
Today
RICKRCI Hospitality Holdings, Inc.
Actual
—
Estimate
1.81
USD
Today
BNEDBarnes & Noble Education, Inc
Actual
—
Estimate
—
Today
CETXCemtrex Inc.
Actual
—
Estimate
—
Dec 31
JVACoffee Holding Co., Inc.
Actual
—
Estimate
—
Jan 1
PKEPark Aerospace Corp.
Actual
—
Estimate
—
Jan 1
LFCRLifecore Biomedical, Inc.
Actual
—
Estimate
−0.14
USD
Jan 2
TAYDTaylor Devices, Inc.
Actual
—
Estimate
0.53
USD
See more events
Community trends
Bitcoin - Channel no one talks about! (new Year's crash!)Bitcoin's price and development (code) are completely controlled by banks and government. They already have a roadmap on Bitcoin price, so they know what the price will be in 2030. Bitcoin technology is great for total control because all transactions are public. How to profit from that? First of al

SOLUSDT may continue its trend after correctionSOL is falling. Downward trend. A cascade of resistance is forming. At the moment, the price is testing the 121 level from D1. I expect a pullback due to a local change in the imbalance of forces after a false breakout of support and a subsequent fall from the 123-124 zone to 116.
Any upward pullba

SOL at a Critical Decision Zone – Double Bottom vs ResistanceHi!
Market Context
Solana is trading near a key decision zone after a corrective move from recent highs. Price action suggests short-term bullish attempts, but the broader structure remains mixed.
Technical Structure
Broken Trendline: The descending trendline from the recent high has been

Bitcoin Price Update – Clean & Clear ExplanationBitcoin is currently showing weak price behavior after failing to hold above key resistance levels. Earlier, the market was in an uptrend, supported by a rising trendline. However, price has now broken below this trendline, which is an early sign that bullish momentum is fading.
The price faced str

BTCUSDT: Buyers Defend 86K Support, Upside in FocusHello everyone, here is my breakdown of the current BTCUSDT setup.
Market Analysis
BTCUSDT has shifted its structure after breaking out of a prolonged Downward Channel, signaling a loss of bearish control and the start of a stabilization phase. Following the breakout, price entered a broad range,

Bitcoin - Can we hit the target at $91.000 This BTC technical analysis shows that Bitcoin is currently in a waiting phase. Price is trading around $87,500 and continues to move within a clearly defined range. Although a recent bounce has occurred, there is still a lack of a convincing impulse to define the next larger move. As a result, liqu

Elise | BTCUSD | 30M – Distribution → BOS → Liquidity SweepBITSTAMP:BTCUSD
The sell-side liquidity sweep produced a technical bounce; however, price has failed to reclaim key structure or break descending resistance. This indicates a corrective retracement, not accumulation. Until a bullish structure shift occurs, downside continuation remains the higher-

BTC/USDT | More Downside Ahead? Let's Discuss in the Comments!Bitcoin climbed back to $90,500, tapped resistance, and is now trading around $87,800. This bounce looks more like a classic liquidity grab than a trend reversal. I’m still leaning bearish. As long as $90,000 doesn’t flip into solid support, we’re likely heading lower. My next downside targets: $85,

BITCOIN Merry Christmas with symmetry at its very best!First of all allow me to wish everyone Merry Christmas with Tradingshot's best wishes to everyone for great health and prosperity!
Now as far as Bitcoin (BTCUSD) is concerned, this chart on the 1W time-frame displays once more its symmetry among Cycles at its very best.
They key component here is

2026 - The best year ever!🙏 2026 will be the best year ever :
-> Focus on financial health
-> Focus on physical health
-> Focus on social health
and always remember to keep your #LONGTERMVISION
SwingTraderPhil
SwingTrading.Simplified. | Investing.Simplified. | #LONGTERMVISION

See all crypto ideas
GOLD - Hunting for liquidity ahead of growth. Focus on 4475FX:XAUUSD reached a new historic high of around $4,525. However, profit-taking is causing a correction, with the 4,475-4,470 range being the area of interest in the bull market.
The dollar is weakening, with the market anticipating two rate cuts in 2026. Geopolitical risks are supporting deman

XAUUSD Maintains Support – Buyers Eye $4,560Hello traders! Here’s my technical outlook on XAUUSD (Gold, 2H) based on the current chart structure. Gold continues to trade within a well-defined ascending channel, confirming a sustained bullish market structure. After a prolonged consolidation phase (range) on the left side of the chart, price s

Gold Hits ATH Before Christmas — Is a Correction Coming?🎄🎄🎄 Merry Christmas, Traders! 🎄🎄🎄
Wishing you a joyful Christmas filled with good vibes, calm markets, tight stop-losses, and charts that respect your levels😄.
May you spend this season with your family, loved ones, and everyone who truly matters — away from stress, noise, and overtrading.
Enjoy

Lingrid | GOLD Compression Then Acceleration in Bull MoveOANDA:XAUUSD remains firmly inside a rising channel after breaking above the previous all-time high, with the former resistance now acting as dynamic support. Price recently paused near 4520, but the structure still shows higher highs and higher lows, suggesting continuation rather than distributio

XAUUSD: Bullish Trend Holds FirmLooking at the XAUUSD H3 chart at the current moment, I can clearly see that the bullish trend remains well intact. The previous upward moves were not random but supported by active buying flow, as reflected in the market’s ability to consistently maintain higher highs and higher lows. After each pu

XAUUSD: Buyers Defend Structure – Retest 4,520 Resistance AheadHello everyone, here is my breakdown of the current XAUUSD setup.
Market Analysis
Gold is trading within a strong bullish structure after successfully breaking out of a descending triangle and confirming a shift in market control from sellers to buyers. The initial breakout was followed by a cons

XAUUSD 15M – Support Rejection & Bullish Continuation Toward 4,5Market Structure
Overall bias: Short-term bullish continuation, medium-term range-bound.
Price previously moved inside a rising channel, broke down, then retested demand and bounced.
Current price is making higher lows after a sharp rejection from support → bullish reaction confirmed.
🔴 Support Z

XAU/USD)Bullish trend analysis Read The captionSMC Trading point update
Technical analysis of XAUUSD (Gold) – 1H chart using SMC + Fibonacci + trend continuation.
⸻
Market Context
• Overall bias: Bullish
• Price is respecting an ascending trend structure
• Higher highs & higher lows remain intact
• Recent move down is a controlled pull

Gold Continues to Maintain Its Bullish Streak Into Year-EndHello everyone,
Today, OANDA:XAUUSD is taking a pause during the Christmas holiday period, currently trading around 4,479 USD. Although slightly lower than the previous session, gold continues to hold a strong high-price base after a powerful rally, driven by rising safe-haven flows, escalating

Elise | XAUUSD | 30M – Bullish Channel ContinuationOANDA:XAUUSD
Gold rallied strongly from the accumulation base and continues to trade within a well-defined bullish channel. Multiple pullbacks into channel support have been defended, indicating strong buyer presence. Current consolidation near mid-channel suggests a corrective pause rather than d

See all futures ideas
EURUSD Long: Trend Line Support Keeps Buyers, Move to 1.8200Hello traders! Here’s a clear technical breakdown of EURUSD (2H) based on the current chart structure. EURUSD is trading in a well-defined bullish trend, supported by a rising trend line that has guided price action from the recent pivot low. After an initial consolidation phase, price broke out of
Rare Double Head & Shoulders After an Uptrend Market Context
After a sustained uptrend, price started to lose momentum and formed a classic Head & Shoulders pattern. What makes this structure interesting is that the market did not reverse impulsively — instead, it developed a second Head & Shoulders formation shortly after the first one.
EURUSD H1 OutlookEURUSD H1 Outlook – Bullish Continuation While Holding 1.177 Support (Key Levels + Trade Plans)
EURUSD on the H1 chart is trading in a bullish continuation phase after a clean impulse leg from the 1.170 base. Price has transitioned into a tight consolidation under the recent highs, and the market is

EURUSD: Bullish Structure Holds Inside Upward ChannelHello everyone, here is my breakdown of the current EURUSD setup.
Market Analysis
EURUSD has confirmed a bullish structure after breaking out of the previous Downward Channel. This breakout shifted market control to buyers and initiated a steady move higher. Price is now trading within a well-def

EURUSD: The Uptrend Remains Intact – BUY Still Holds the AdvantaHello everyone, below is my view on today’s EURUSD outlook.
From a fundamental perspective, the overall backdrop continues to support the euro. The U.S. dollar remains under pressure as expectations for U.S. interest rates weaken, despite occasional short-term technical rebounds. The key point is t

Lingrid | AUDCAD Bullish Entry in Sideways MarketFX:AUDCAD perfectly played out my previous trading idea . Price has completed a corrective drop from the 0.9245 supply zone, unwinding bullish momentum and sliding back into the 0.9130 demand area. The decline stalled near the rising trendline, where price printed a higher low, hinting that sellin

USDJPY Approaches Key Sell Zone at 156.60!!Hey Traders,
In today’s trading session, we’re closely watching USDJPY for a potential selling opportunity around the 156.600 zone.
From a technical perspective, the pair remains in a clear downtrend. Price is currently in a corrective rebound, retracing toward a key trendline and support/resistan

CADJPY→ Trade Analysis | BUY SetupCADJPY is moving in an UP trend channel.
The chart broke through the dynamic Resistance line, which now acts as support.
We expect a decline in the channel after testing the current level which suggests that the price will continue to rise
Hello Traders, here is the full analysis.
I think we can s

DeGRAM | EURUSD reached the lower boundary of the channel📊 Technical Analysis
● EUR/USD pulled back into a well-defined support zone near 1.1770–1.1765 after a bearish correction from the resistance area. Price is holding the lower boundary of the ascending channel, where buying pressure previously emerged.
● The rejection from support and compression b

GBPUSD – HTF Structure Alignment & Exhaustion ContextGBPUSD – HTF Structure Alignment & Exhaustion Context
This chart is the higher-timeframe continuation and structural context of the previously shared counter-trend SHORT on GBPUSD.
It provides the broader framework that explains why the lower-timeframe exhaustion fade was statistically valid, whil

See all forex ideas
| - | - | - | - | - | - | - | ||
| - | - | - | - | - | - | - | ||
| - | - | - | - | - | - | - | ||
| - | - | - | - | - | - | - | ||
| - | - | - | - | - | - | - | ||
| - | - | - | - | - | - | - | ||
| - | - | - | - | - | - | - | ||
| - | - | - | - | - | - | - |
Trade directly on Supercharts through our supported, fully-verified, and user-reviewed brokers.


