Gold – Potential Choppy Price Action AheadThe market got what it wanted from the Federal Reserve last night when a widely anticipated interest rate cut of 25bps (0.25%) was announced, a move which as a rule is positive for Gold prices as it is an asset that doesn’t bear any interest itself. Initially this was the case, with the popular meta

The best trades require research, then commitment.
Get started for free$0 forever, no credit card needed

Scott "Kidd" PoteetThe unlikely astronaut

Where the world does markets
Join 100 million traders and investors taking the future into their own hands.

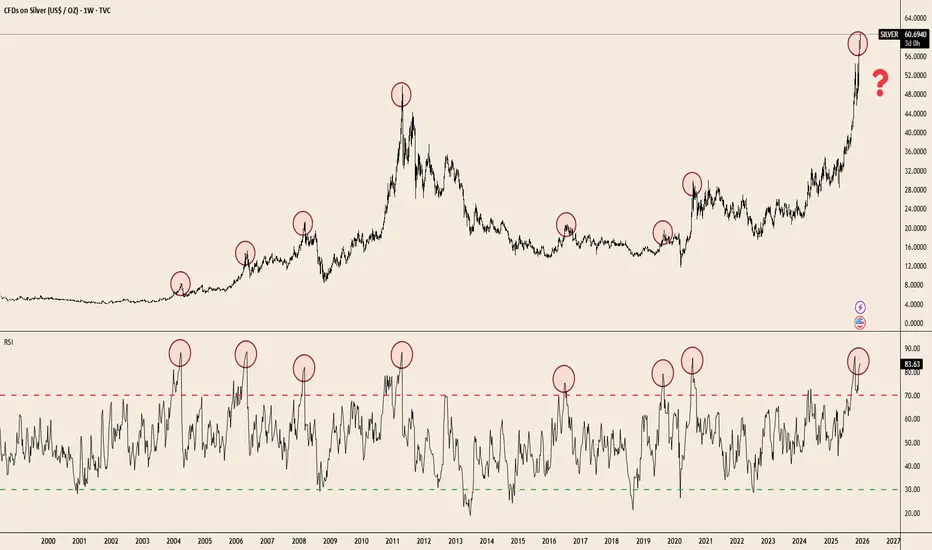
Silver at Extremes: RSI Signals Haven’t Missed in 20 YearsTVC:SILVER has delivered a massive breakout — up +109.9% YTD — but the weekly RSI is now pushing into one of the most extreme zones seen in two decades. Historically, every major spike into the 80–85 RSI band has preceded cooling periods, consolidations, or full reversals.
The chart makes the pat
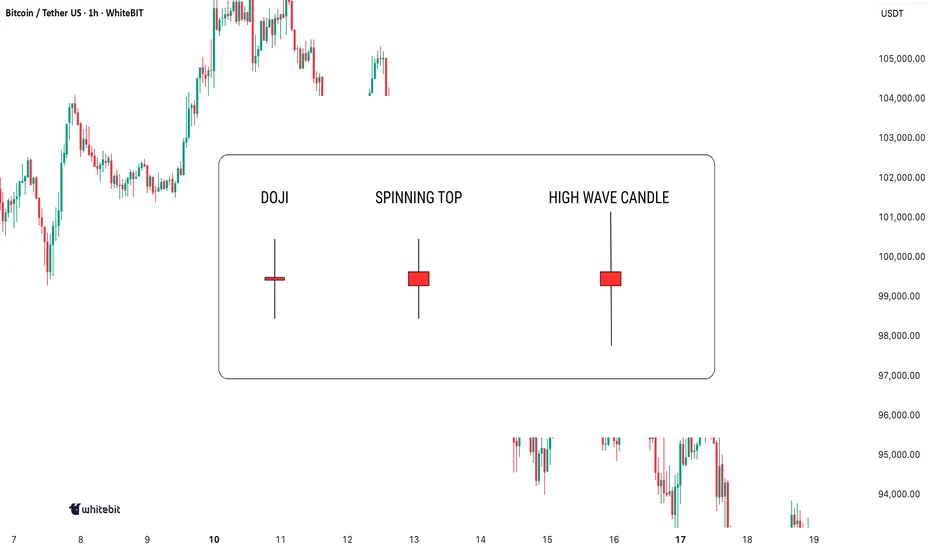
Indecision on the Chart: What These Candles Really MeanIndecision in the market? You're not alone. Every trader has faced those moments when the charts seem to scream confusion. But here's the thing: indecision candlestick patterns aren't just noise. They hold secrets that, when decoded, can give you the upper hand. Let's dive in and learn how to spot t
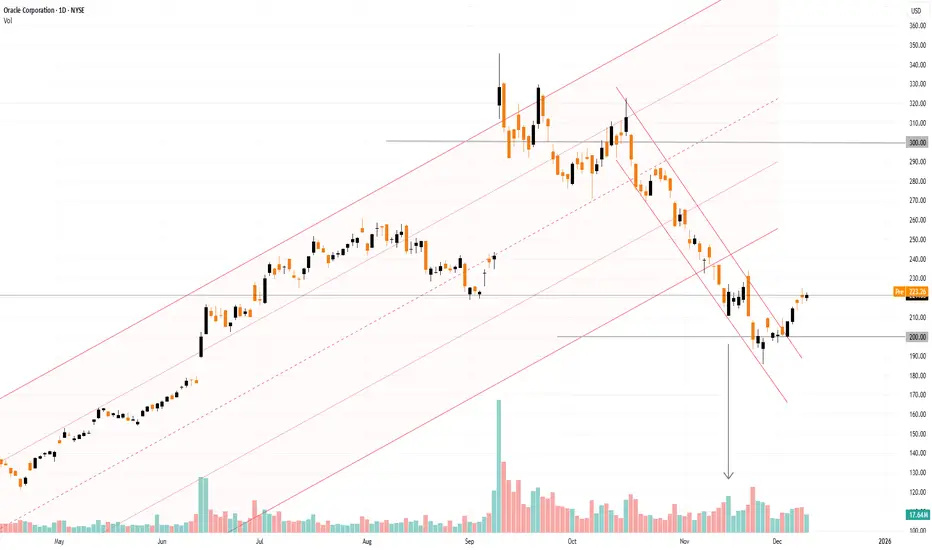
Oracle (ORCL) Share Price Rebounds Ahead of Earnings ReleaseOracle (ORCL) Share Price Rebounds Ahead of Earnings Release
Oracle is due to publish its quarterly results today after the close of the main trading session. Analysts are expecting solid year-on-year growth compared with the same period last year:
→ Revenue: forecast to rise by around 15% to $16
USDJPY breakout supported at 155.60The USDJPY remains in a bullish trend, with recent price action showing signs of a corrective pullback within the broader uptrend.
Support Zone: 155.60 – a key level from previous consolidation. Price is currently testing or approaching this level.
A bullish rebound from 155.60 would confirm ongoi

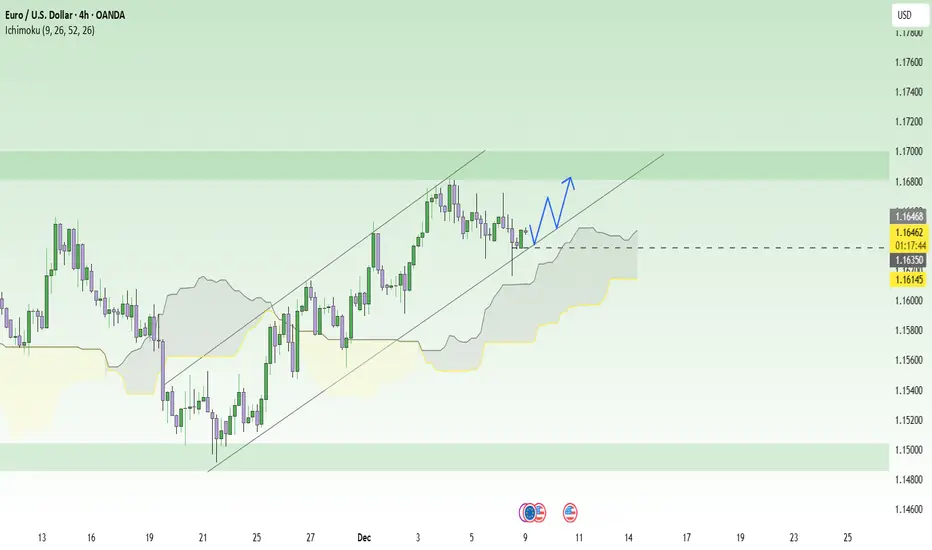
Waiting for the Fed: EURUSD set to explode!When the entire market is focused on the upcoming Fed meeting , EURUSD looks like an athlete that has fully warmed up and is just waiting for the starting whistle. The current context slightly favors the euro, as the Fed is expected to cut rates soon after a series of weakening labor data, while
UNH: 50% Inception"All I want to buy in 2025 is Healthcare" has been what I've told people that ask me about this tech stock or that AI company. It is my nature to look for what sector is the most downtrodden and find opportunity there... NOT in what "everyone" is talking about. I still feel that way as 2025 comes

Solana ~ TRADE The CHOP: 3 Ways to Make ATLEAST +15%Choppy markets are identified by low volume and sideways trading / range trading. It seems uninteresting in most cases, but you don't have to sit around and wait for the next big impulse wave!
Here are three plays YOU can take during choppy markets:
1) 4H : Short Resistance
Chop trading can be a

Tesla Stock Lifts 2025 Gains to 20% as Traders Eye Santa RallyA megacap squeezing in one more rally before year-end? Yes, please.
🚗 A Holiday Glide Higher for Tesla Shares
Tesla NASDAQ:TSLA is heading into December with solid momentum. Coming into Monday, the stock has risen 20% since January, putting it on track for a third straight annual gain .
Inv

GBPUSD: Rallies Are Getting Sold, & Dollar Still Has Upper HandEvery time GBPUSD tries to lift its head, it seems to run straight into supply. Zooming out, this chart feels like a classic distribution phase after a strong first-half rally. Fundamentally, that makes sense. Sterling has lost its earlier policy edge, while the dollar continues to benefit from re

See all editors' picks ideas
Volume Gaps & Imbalances (Zeiierman)█ Overview
Volume Gaps & Imbalances (Zeiierman) is an advanced market-structure and order-flow visualizer that maps where the market traded, where it did not, and how buyer-vs-seller pressure accumulated across the entire price range.
The core of the indicator is a price-by-price volume prof

Match Finder [theUltimator5]Match Finder is the dating app of indicators. It takes your current ticker and finds the most compatible match over a recent time period. The match may not be Mr. right, but it is Mr. right now. It doesn't forecast future connection, but it tells you current compatibility for today.
Jokes aside,

Trend Line Methods (TLM)Trend Line Methods (TLM)
Overview
Trend Line Methods (TLM) is a visual study designed to help traders explore trend structure using two complementary, auto-drawn trend channels. The script focuses on how price interacts with rising or falling boundaries over time. It does not generate trade sign

Breakouts & Pullbacks [Trendoscope®]🎲 Breakouts & Pullbacks - All-Time High Breakout Analyzer
Probability-Based Post-Breakout Behavior Statistics | Real-Time Pullback & Runup Tracker
A professional-grade Pine Script v6 indicator designed specifically for analyzing the historical and real-time behavior of price after strong All-Ti

Count█ OVERVIEW
A library of functions for counting the number of times (frequency) that elements occur in an array or matrix.
█ USAGE
Import the Count library.
import joebaus/count/1 as c
Create an array or matrix that is a `float`, `int`, `string`, or `bool` type to count elements from, t

Holographic Market Microstructure | AlphaNattHolographic Market Microstructure | AlphaNatt
A multidimensional, holographically-rendered framework designed to expose the invisible forces shaping every candle — liquidity voids, smart money footprints, order flow imbalances, and structural evolution — in real time.
---
📘 Overview
The Hol

PriceFormatLibrary for automatically converting price values to formatted strings
matching the same format that TradingView uses to display open/high/low/close prices on the chart.
█ OVERVIEW
This library is intended for Pine Coders who are authors of scripts that display numbers onto a user's charts. T

LogNormalLibrary "LogNormal"
A collection of functions used to model skewed distributions as log-normal.
Prices are commonly modeled using log-normal distributions (ie. Black-Scholes) because they exhibit multiplicative changes with long tails; skewed exponential growth and high variance. This approach i

Range Oscillator (Zeiierman)█ Overview
Range Oscillator (Zeiierman) is a dynamic market oscillator designed to visualize how far the price is trading relative to its equilibrium range. Instead of relying on traditional overbought/oversold thresholds, it uses adaptive range detection and heatmap coloring to reveal where pri

Volume Surprise [LuxAlgo]The Volume Surprise tool displays the trading volume alongside the expected volume at that time, allowing users to spot unexpected trading activity on the chart easily.
The tool includes an extrapolation of the estimated volume for future periods, allowing forecasting future trading activity.
🔶 U

See all indicators and strategies
Community trends
UNH: 50% Inception"All I want to buy in 2025 is Healthcare" has been what I've told people that ask me about this tech stock or that AI company. It is my nature to look for what sector is the most downtrodden and find opportunity there... NOT in what "everyone" is talking about. I still feel that way as 2025 comes
Oracle (ORCL) Share Price Rebounds Ahead of Earnings ReleaseOracle (ORCL) Share Price Rebounds Ahead of Earnings Release
Oracle is due to publish its quarterly results today after the close of the main trading session. Analysts are expecting solid year-on-year growth compared with the same period last year:
→ Revenue: forecast to rise by around 15% to $16
Netflix - This stock will drop another -30%!📽️Netflix ( NASDAQ:NFLX ) is still totally bearish:
🔎Analysis summary:
A couple of months ago, Netflix retested a major resistance trendline. This was a clear sign for us to take profits and Netflix has already been dropping about -30%. Looking at structure, the next support is the previous a

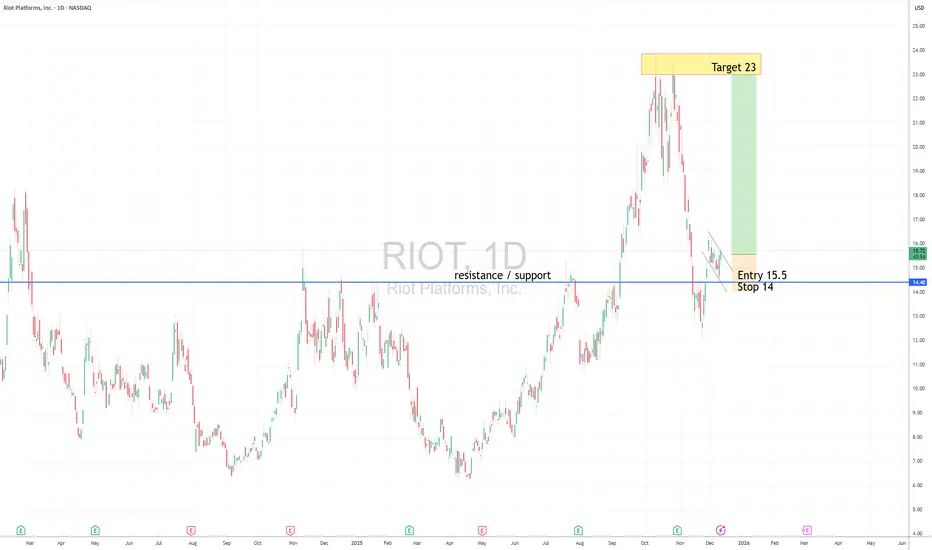
RIOT LongFlag pattern in Uptrend, Near support line
Long entry 15.5
Stop 14
Target 23
Risk management is much more important than a good entry point.
I am not a PRO trader.
In my trading plan, the Max Risk of each short term trade should be less than 1% of an account.
TESLA Is December seasonality about to hit it hard?Tesla (TSLA) has been trading within a 3-year Channel Up and has been on a Bullish Leg since the April 07 market low. Not everything on its long-term outlook is positive though as December in the past 5 years, holds a bearish seasonality for the stock as it has aggressively declined.
A 1W MACD Bear

QuantSignalsV3 BE Bullish Reversal Call: Quick Swing OpportunityInstrument: BE
Trade Type: Weekly Call (BUY)
Strike Price: $94.00
Entry Range: $11.20 – $12.70 (current example: $11.95)
Target 1: $16.80 (≈50% gain)
Target 2: $19.60 (≈75% gain)
Stop Loss: $8.40 (≈25% risk)
Expiry / Horizon: 2 days (to 2025-12-12)
Confidence: 56%
Conviction Level: Low
Risk Level: H

Looking for a position to buy ORCLIt's coming off a fairly long bearish correction, and I'm seeing a pullback forming... I'd like to buy at $200.

Canaan Inc. CAN Macd based forcasting Target prices shown, up wave coming to near 3.00$
A pattern of Double Bottom was formed, expecting up wave will start very soon 💥
Breaking up Resistance level 1.11$ will trigger the Stock's price to the Target price 3.00$
Highly recommended for Buying.

Nike Is -50% Over Five Years. Here's Its Chart Ahead of EarningsNike NYSE:NKE has languished in the doldrums for years, down some 12% year to date and more than 50% over five years vs. a nearly 90% gain for the S&P 500 SP:SPX during the same period. Let's see what the sneaker giant's chart and fundamental analysis can tell us ahead of its earnings report nex

$IREN daily ChartNASDAQ:IREN is heading back down toward the key support at $39.92, a level that has already been tested three times.
This will show whether it’s a true rock-bottom support…
or if price finally gives in and breaks through it.
Watching this level closely — fourth tests don’t always hold.
#IREN #Bi

See all stocks ideas
Today
HOFTHooker Furnishings Corporation
Actual
−1.18
USD
Estimate
−0.14
USD
Today
LOVEThe Lovesac Company
Actual
−0.72
USD
Estimate
−0.69
USD
Today
CIENCiena Corporation
Actual
0.91
USD
Estimate
0.78
USD
Today
MANUManchester
Actual
−0.02
USD
Estimate
−0.04
USD
Today
GTIMGood Times Restaurants Inc.
Actual
—
Estimate
—
Today
NMTCNeuroOne Medical Technologies Corporation
Actual
—
Estimate
−0.04
USD
Today
M
MLECMoolec Science SA
Actual
—
Estimate
—
Today
NTRBNutriband Inc.
Actual
—
Estimate
−2.13
USD
See more events
Today
LMRILUMEXA IMAGING HOLDINGS INC
Exchange
NASDAQ
Offer price
18.500
USD
Tomorrow
S
SFDXSFIDA X Inc.
Exchange
NASDAQ
Offer price
5.00 - 6.00
USD
Tomorrow
W
WLTHWealthfront Corp.
Exchange
NASDAQ
Offer price
12.00 - 14.00
USD
Dec 15
DTDTDt House Ltd.
Exchange
NASDAQ
Offer price
4.00 - 5.00
USD
Dec 15
ELCGELC Group Holdings Ltd.
Exchange
NASDAQ
Offer price
4.00 - 6.00
USD
Dec 15
R
RIKURiku Dining Group Ltd.
Exchange
NASDAQ
Offer price
4.00 - 6.00
USD
Dec 16
U
UPXUptrend Holdings Ltd.
Exchange
NASDAQ
Offer price
4.00 - 5.00
USD
Dec 17
MDLNMedline Inc.
Exchange
NASDAQ
Offer price
—
Dec 17
A
ANDGAndersen Group Inc.
Exchange
NYSE
Offer price
14.00 - 16.00
USD
See more events
Community trends
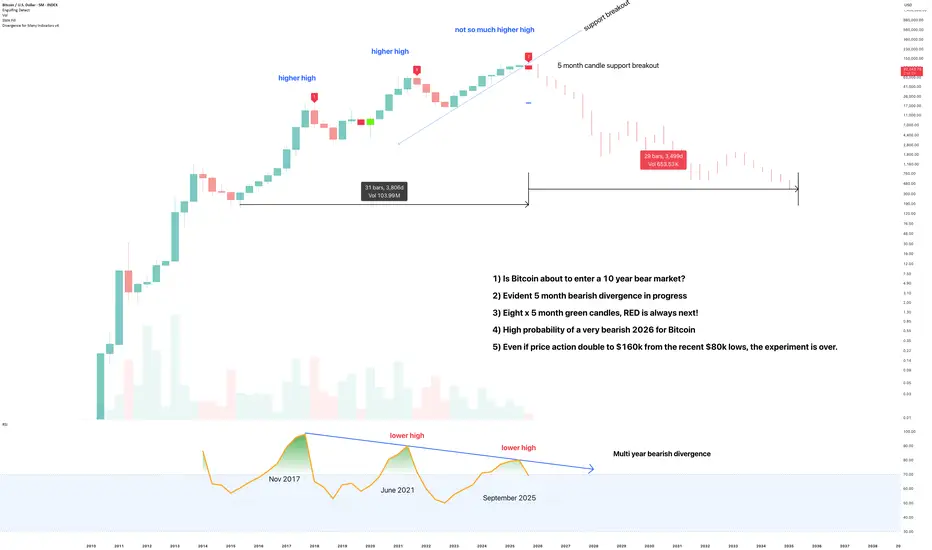
Bitcoin in multi year collapse back to $1k - December 2025Perhaps you've noticed as have I, Media studies and Art collage students now turned financial experts flock to Youtube to inform peers of investment opportunities with the great Boomer wealth rotation that is set to land on their laps. Who would not be in disbelief at the possibility of wealth gener
BTC/USDT - Major Rejection from Supply Zone📝 Description 🔹 Setup Overview WHITEBIT:BTCUSDT
BTC/USDT has faced a strong rejection from the upper resistance / supply zone near the recent highs. Price has broken below the rising trendline, signaling a shift in short-term market structure from bullish to bearish. Failure to reclaim the trendl

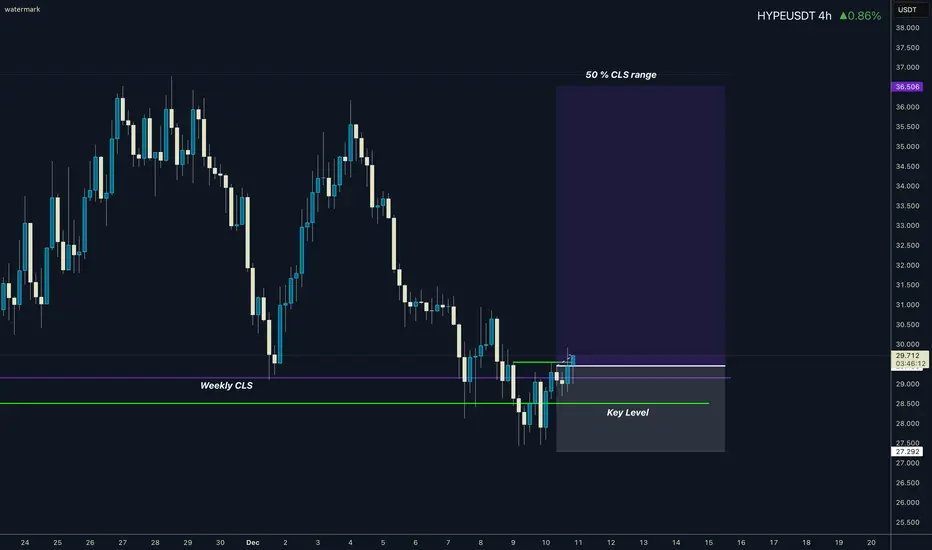
HYPE I Weekly CLS Range I Model 1Hi friends, new range created. As always we are looking for the manipulation in to the key level around the range. Don't forget confirmation switch from manipulation phase to the distribution phase to make the setup valid. Stay patient and enter only after change in order flow. If price reaches Its
ETH Faces Deep Pullback After Liquidity SweepETH has undergone a sharp correction, dropping from the 3,380–3,400 zone directly into the 3,180–3,200 FVG, where price reacted firmly. This move signals a clear liquidity sweep — a deep probe to collect orders before bouncing at a key demand pocket, reinforcing this FVG as short-term support.
To t

SOL: Selling Pressure Rises After Fed SignalsHi everyone, Domic here.
The Fed’s decision to cut rates by 0.25% raised hopes for renewed capital inflows into the crypto market, but the Fed’s statement that no further cuts are expected in 2026 keeps sentiment cautious . This caused sharp volatility in Bitcoin and Ethereum, spilling over as s

BTCUSDT: Buyers Regain Control — $96,000 in FocusHello everyone, here is my breakdown of the current BTCUSDT setup.
Market Analysis
Bitcoin is transitioning from a broader bearish phase into a developing bullish structure. After a prolonged decline inside a well-defined downward channel, BTC formed a base near the $89,600 support zone, where st
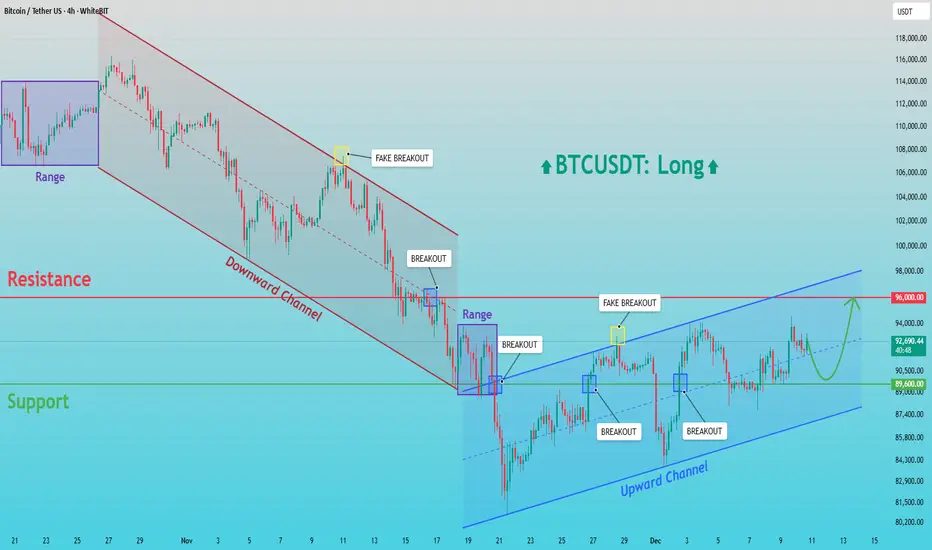
BTC/USD 4H CHART PATTERNThis BTC/USD chart shows a clean breakout above a long-term downward trendline that has been holding the price lower for several weeks. Each previous touch of this trendline resulted in rejection, but Bitcoin has now broken through with bullish momentum, supported by price action moving above the Ic

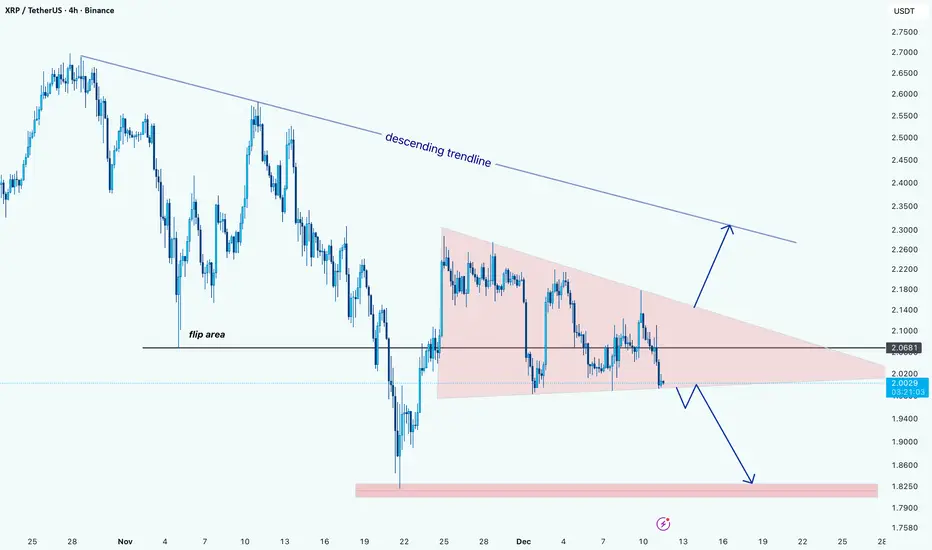
XRPusdt (Ripple): Triangle Breakout/Breakdown OutlookHi!
Price is currently sitting right at the lower boundary of the triangle, showing compression and weakening momentum.
Price is compressing at the bottom of the triangle. A breakout above the top line would likely send the price up to retest the main descending trendline, where stronger resistanc
Bitcoin - Sell this upcoming pump! New Bear Flag - Target 74k!I am currently bullish on Bitcoin in the short term, and I believe Bitcoin will hit 96k, probably this week. The current price is around 91k, so this is definitely a good opportunity to sell or open a short position at 96k on futures because later this month/in January Bitcoin will most likely conti

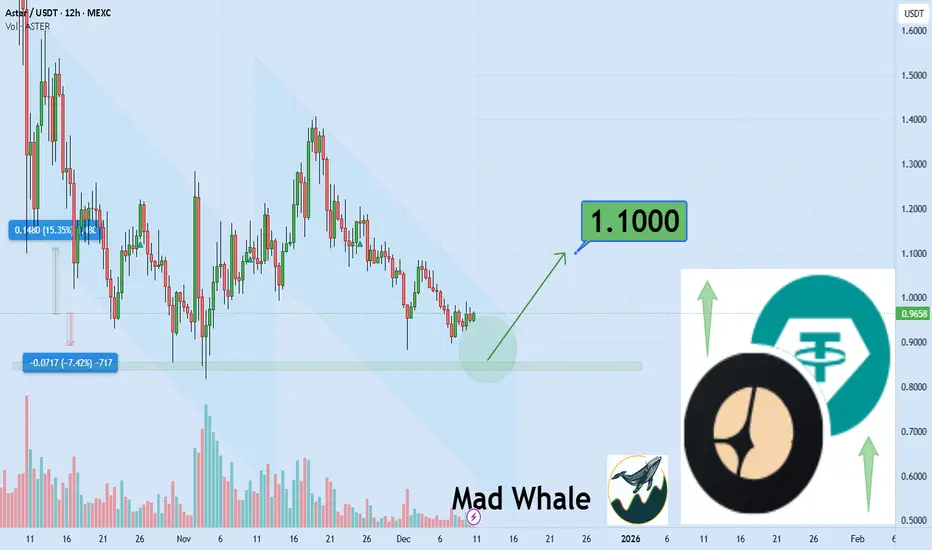
ASTER can touch upper targets 15%gain toward 1.10$Hi the support and resistances on the chart are based on the previous data and weekly candlesticks if BINANCE:ASTERUSDT holds this last support the potential of 15% gain is logical toward 1.10$
See all crypto ideas
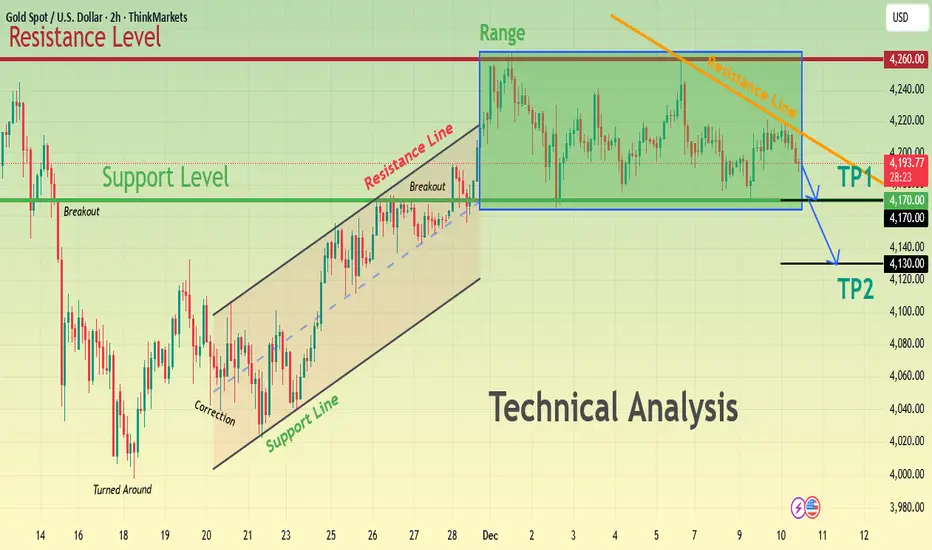
XAUUSD Range Resistance Holds — Pullback Toward $4,170 in FocusHello, traders! Here’s my technical outlook on GOLD (XAUUSD) based on the current market structure visible on the chart. After a strong rebound from the previous lower demand area, price moved into a steady ascending structure, respecting the rising Support Line and forming higher highs and higher l
Gold 30-Min — Volume Buy Reversal Triggered⚡Base : Hanzo Trading Alpha Algorithm
The algorithm calculates volatility displacement vs liquidity recovery, identifying where probability meets imbalance.
It trades only where precision, volume, and manipulation intersect —only logic.
✈️ Technical Reasons
/ Direction — LONG / Reversal 4185 Area

Lingrid | GOLD Sideways Movement Ahead of FOMC DecisionOANDA:XAUUSD perfectly played out my previous trading idea . Price is holding inside a well-defined consolidation after its prior surge, with price rotating above the rising channel base. The trend remains constructive, but momentum has cooled, suggesting participants are waiting for a catalyst ra

XAU/USD | Gold Awaits FOMC and Powell to Set the Next Big Move!By analyzing the #Gold chart on the 4 hour timeframe, we can see that price is still moving sideways inside the same range and has not chosen a clear direction yet. Even so, the previous analysis played out and gold dropped about 350 pips before bouncing back to the 4220 supply zone, where it got re

GOLD → Consolidation ahead of the Fed's interest rate decision FX:XAUUSD is rebounding from resistance at the local range of 4220 and heading towards support at the liquidity zone of 4175. Ahead is the Fed meeting on interest rates, where rates are likely to be lowered. What to expect?
The probability of a 25 bp rate cut today is ≈90%. JOLTS job vacancy d

GOLD (XAU/USD): Day Trading Setup for Today📈GOLD is currently consolidating within a horizontal intraday range.
Following a test of the channel's support, the price may continue to ascend towards its resistance.
As a confirmation, I observe a head and shoulders pattern formation.
Target - 4255

Price Compressing Below Trendline, Waiting for a Liquidity SweepGold continues to consolidate inside a narrow range as markets wait for fresh USD flows and upcoming Fed expectations. Sellers are losing momentum, but buyers still haven’t secured a clean breakout as price remains capped beneath the short-term descending trendline.
Current structure suggests a cla

Gold buy TARGET Gold (XAU/USD) shows consolidation above strong support at 4,170 with bullish momentum forming. A breakout is expected toward the 4,258 target zone.

XAUUSDHello Traders! 👋
What are your thoughts on GOLD?
As seen on the chart, Gold (XAUUSD) has been trading within a defined range for the past two weeks, showing choppy price action without a clear trend direction.
Short-Term Strategy (Range Bound):
As long as the price remains within this box, the opti

Clear Break & Retest: Gold Now Eyes a Push Toward $4,405Hello everyone, Helene here!
Right now, XAUUSD is a textbook example of a market trading inside a well-defined ascending channel, with price consistently respecting both the upper and lower boundaries of the structure.
We’ve just seen price break above a clear resistance zone and successfully ret

See all futures ideas
EURUSD Short: Correction Deepens — Market Targets at 1.1590Hello, traders! The current EURUSD price action shows a well-structured reaction between the Supply and Demand zones, with price respecting key levels and channel formations. Earlier, the market traded inside a Range phase, signaling indecision before breaking the range to the upside and forming a c

EURUSD: Price Holds Channel Support, Aiming for 1.1680Hello everyone, here is my breakdown of the current EURUSD setup.
Market Analysis
EURUSD remains in a broader bullish structure, with recent price action developing inside a well-defined ascending channel. After a strong impulsive rally, the pair broke above the previous consolidation zone and co

EUR/USD: Sloping Inverse Head & Shoulders Breakout Toward 1.178Hi!
Let's analyze EURUSD
EUR/USD has completed a sloping Inverse Head & Shoulders formation, a pattern typically signaling trend reversal after a prolonged decline. The left shoulder, head, and right shoulder are well-defined, and price has decisively broken above the descending neckline, confirmi

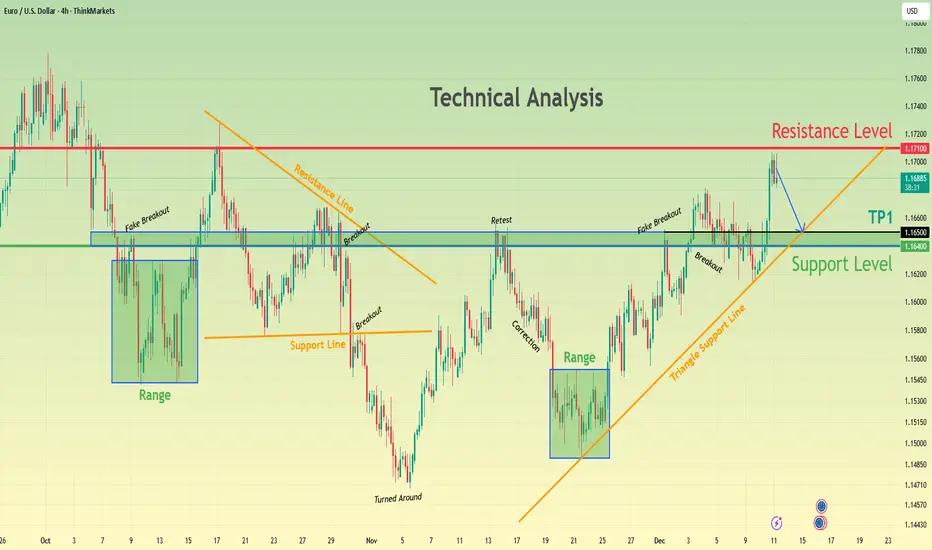
EURUSD Consolidates Below Resistance — Bears Aim for 1.1650Hello traders! Here’s my outlook on the current EURUSD setup. After a prolonged consolidation phase, the pair repeatedly respected the Support Level around 1.1640–1.1650, where buyers have consistently stepped in to defend the zone. This area has acted as a strong demand region, forming multiple ran
EURUSD Bearish Outlook After Trendline BreakQuick Summary
After breaking the ascending trendline, EURUSD is expected to continue moving lower. The market may target the previous two lows to collect liquidity, and there is currently no clear buy signal.
Full Analysis
The recent break of the ascending trendline on EURUSD changes the short te

EUR/USD Rejects Resistance: Bears Setting Up the Next Move📊 EUR/USD Chart Analysis
1. Strong Resistance Hit at ~1.1700
The price made a sharp impulsive rally into the 1.1700 zone, which is marked as a major horizontal resistance.
Wicks at the top suggest rejection pressure, meaning buyers struggled to break higher.
---
2. Possible Pullback Structure F

#CHFJPY: 900+ PIPS Buying Setup, JPY Weakening! The OANDA:CHFJPY pair is in a sustained bullish trend. The current price is 195 and we anticipate further upward movement towards our take-profit levels. These are set at 198, 200 and 205.
Please use accurate risk management while trading. ❤️🚀
Team Setupsfx_

USDJPY breakout supported at 155.60The USDJPY remains in a bullish trend, with recent price action showing signs of a corrective pullback within the broader uptrend.
Support Zone: 155.60 – a key level from previous consolidation. Price is currently testing or approaching this level.
A bullish rebound from 155.60 would confirm ongoi
Fed Just Opened the Door — USDJPY Could Bleed Hard!!Hey Traders, in today’s session we are monitoring USDJPY for a selling opportunity around the 156.300 zone. The pair continues to trade within a broader downtrend, and price is now retracing toward a key trend + S/R confluence at 156.300 — an area that has consistently acted as a supply zone for sel

NZDUSD - Bears Brewing at a Critical Intersection!!!📉NZDUSD has been moving inside a clear bearish structure , with lower highs forming along the orange descending trendline.
⚔️Price is now approaching a major confluence area where the upper orange trendline meets the green resistance zone, a level that has repeatedly acted as a ceiling.
As price

See all forex ideas
| - | - | - | - | - | - | - | ||
| - | - | - | - | - | - | - | ||
| - | - | - | - | - | - | - | ||
| - | - | - | - | - | - | - | ||
| - | - | - | - | - | - | - | ||
| - | - | - | - | - | - | - | ||
| - | - | - | - | - | - | - | ||
| - | - | - | - | - | - | - |
Trade directly on Supercharts through our supported, fully-verified, and user-reviewed brokers.


