GOOG: Is a 10% Surge Imminent? The Setup for $340 Explained🚀 NASDAQ:GOOG : Is a 10% Surge Imminent? The Setup for $340 Explained
In the noisy world of trading, clarity is power.
Today, we are looking at Alphabet Inc. (GOOGL). We are not predicting the future, we are simply preparing for a high-probability outcome.
We have identified a textbook Bull Fla

The best trades require research, then commitment.
Get started for free$0 forever, no credit card needed

Scott "Kidd" PoteetThe unlikely astronaut

Where the world does markets
Join 100 million traders and investors taking the future into their own hands.

DOGE pulls back before major decline DOGECOIN is in a range formed against the backdrop of a downtrend. The market is under pressure from above at 0.155 - 0.153 - 0.150. The structure is bearish. The rebound from 0.134 is directed towards 0.1415. A false breakout could trigger a decline.
There is no volume from the bulls, and the mark

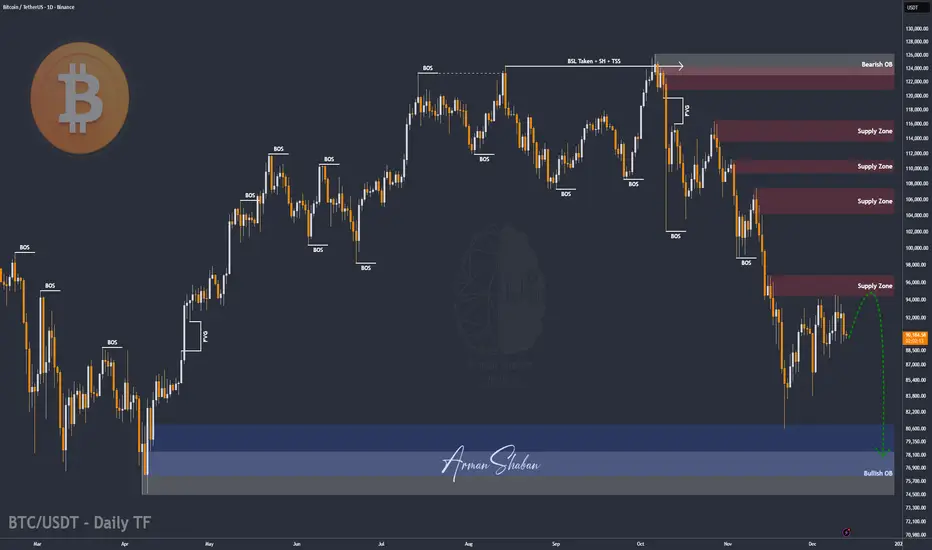
BTC Corrections Don’t Kill Bull Market. They Power Them1. Primary Trend Structure
Macro trend: Clearly bullish. Price has respected a rising diagonal trendline since the 2022–2023 cycle low. Market structure shows higher highs and higher lows, confirming an intact uptrend.
This is a classic bull market staircase: impulsive advances (green boxes) follo

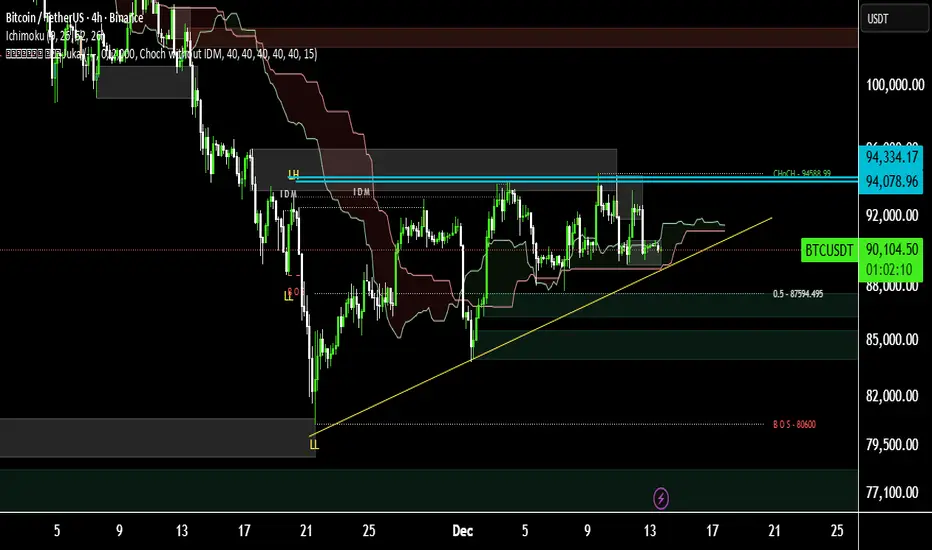
2025 BITCOIN TARGETS: Reality Check
Forecasting is easy. Being right is hard.
1. When Targets Turn Into Illusions
Look at this chart.
Bitcoin at $90,000. Sixteen days left in 2025.
And every “expert” target — JPMorgan, VanEck, Standard Chartered, Tom Lee, Kiyosaki, BlackRock, Cathie Wood —
all of them missed. Every single one.

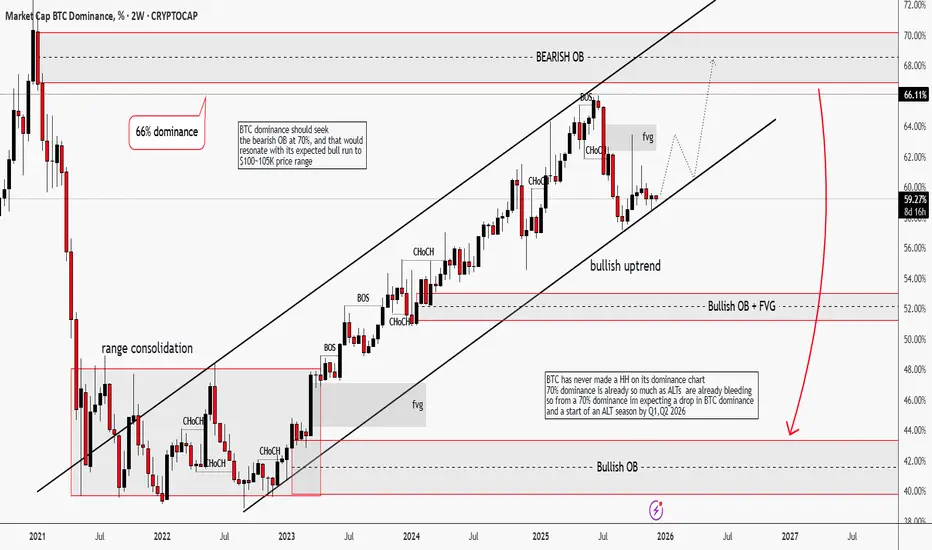
BTC Dominance | Winter is "Almost" ComingHello traders,
Its been a minute since I last checked my wallet, cause I don't love seeing red. Who loves to?
BTC dominance on the 2W timeframe has been in an impulsive bullish uptrend. Structure-wise, it has printed multiple BOS + CHoCH, which tells me that capital are still rotating into Bitcoin
Gold – Potential Choppy Price Action AheadThe market got what it wanted from the Federal Reserve last night when a widely anticipated interest rate cut of 25bps (0.25%) was announced, a move which as a rule is positive for Gold prices as it is an asset that doesn’t bear any interest itself. Initially this was the case, with the popular meta

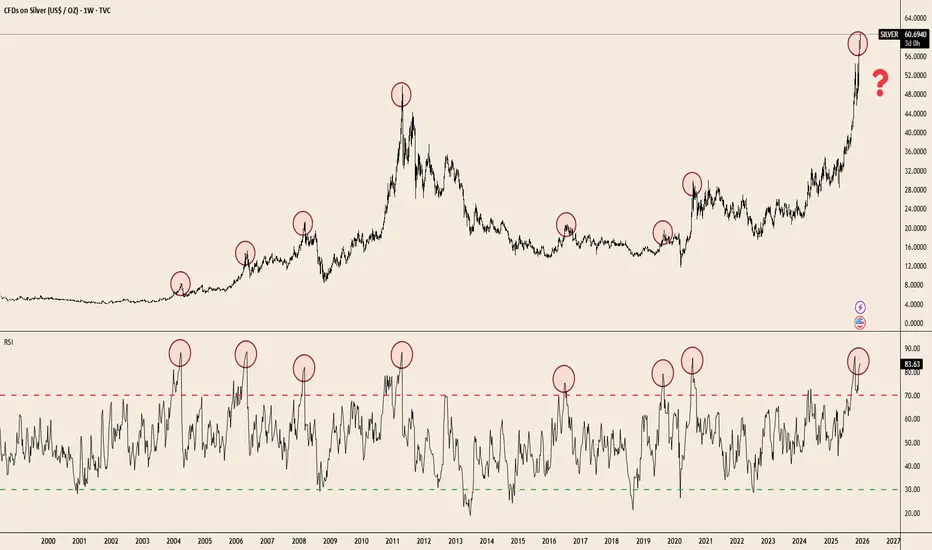
Silver at Extremes: RSI Signals Haven’t Missed in 20 YearsTVC:SILVER has delivered a massive breakout — up +109.9% YTD — but the weekly RSI is now pushing into one of the most extreme zones seen in two decades. Historically, every major spike into the 80–85 RSI band has preceded cooling periods, consolidations, or full reversals.
The chart makes the pat
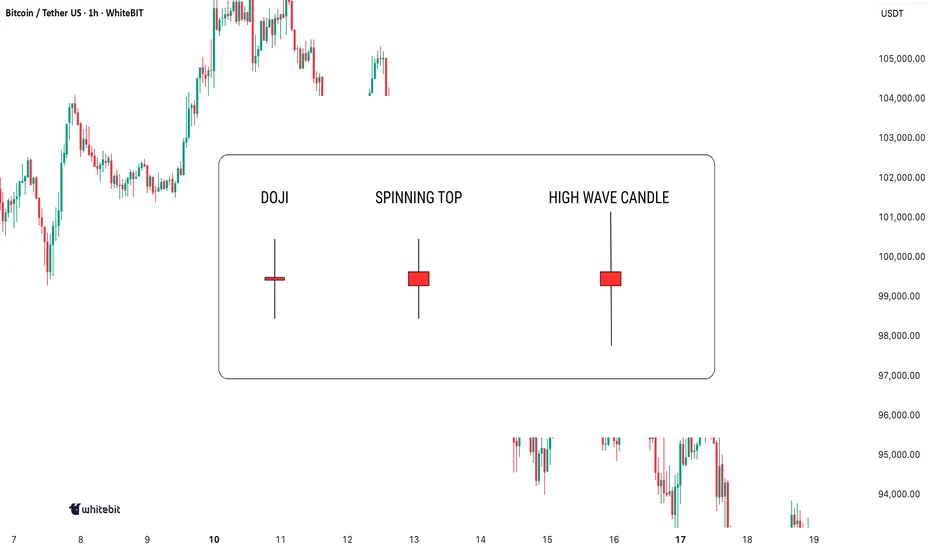
Indecision on the Chart: What These Candles Really MeanIndecision in the market? You're not alone. Every trader has faced those moments when the charts seem to scream confusion. But here's the thing: indecision candlestick patterns aren't just noise. They hold secrets that, when decoded, can give you the upper hand. Let's dive in and learn how to spot t
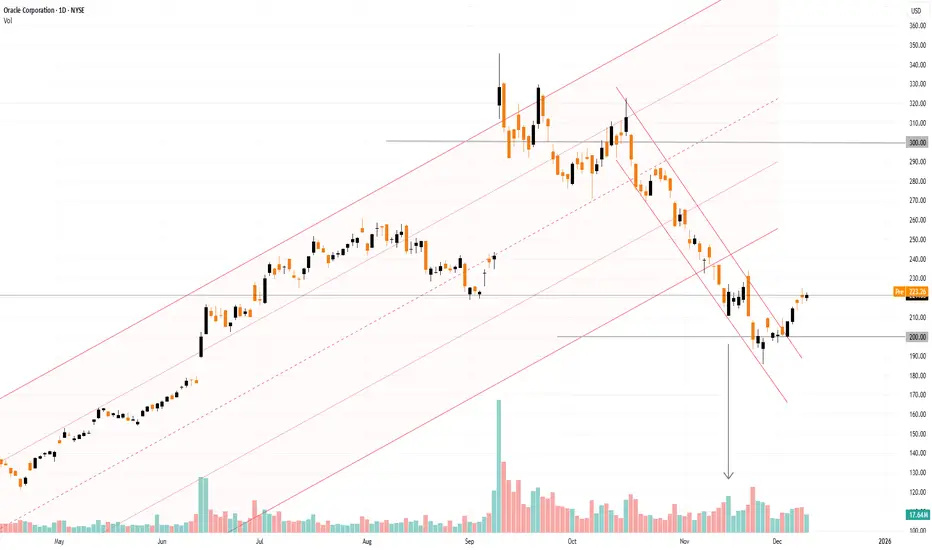
Oracle (ORCL) Share Price Rebounds Ahead of Earnings ReleaseOracle (ORCL) Share Price Rebounds Ahead of Earnings Release
Oracle is due to publish its quarterly results today after the close of the main trading session. Analysts are expecting solid year-on-year growth compared with the same period last year:
→ Revenue: forecast to rise by around 15% to $16
USDJPY breakout supported at 155.60The USDJPY remains in a bullish trend, with recent price action showing signs of a corrective pullback within the broader uptrend.
Support Zone: 155.60 – a key level from previous consolidation. Price is currently testing or approaching this level.
A bullish rebound from 155.60 would confirm ongoi

See all editors' picks ideas
Volume Gaps & Imbalances (Zeiierman)█ Overview
Volume Gaps & Imbalances (Zeiierman) is an advanced market-structure and order-flow visualizer that maps where the market traded, where it did not, and how buyer-vs-seller pressure accumulated across the entire price range.
The core of the indicator is a price-by-price volume prof

Match Finder [theUltimator5]Match Finder is the dating app of indicators. It takes your current ticker and finds the most compatible match over a recent time period. The match may not be Mr. right, but it is Mr. right now. It doesn't forecast future connection, but it tells you current compatibility for today.
Jokes aside,

Trend Line Methods (TLM)Trend Line Methods (TLM)
Overview
Trend Line Methods (TLM) is a visual study designed to help traders explore trend structure using two complementary, auto-drawn trend channels. The script focuses on how price interacts with rising or falling boundaries over time. It does not generate trade sign

Breakouts & Pullbacks [Trendoscope®]🎲 Breakouts & Pullbacks - All-Time High Breakout Analyzer
Probability-Based Post-Breakout Behavior Statistics | Real-Time Pullback & Runup Tracker
A professional-grade Pine Script v6 indicator designed specifically for analyzing the historical and real-time behavior of price after strong All-Ti

Count█ OVERVIEW
A library of functions for counting the number of times (frequency) that elements occur in an array or matrix.
█ USAGE
Import the Count library.
import joebaus/count/1 as c
Create an array or matrix that is a `float`, `int`, `string`, or `bool` type to count elements from, t

Holographic Market Microstructure | AlphaNattHolographic Market Microstructure | AlphaNatt
A multidimensional, holographically-rendered framework designed to expose the invisible forces shaping every candle — liquidity voids, smart money footprints, order flow imbalances, and structural evolution — in real time.
---
📘 Overview
The Hol

PriceFormatLibrary for automatically converting price values to formatted strings
matching the same format that TradingView uses to display open/high/low/close prices on the chart.
█ OVERVIEW
This library is intended for Pine Coders who are authors of scripts that display numbers onto a user's charts. T

LogNormalLibrary "LogNormal"
A collection of functions used to model skewed distributions as log-normal.
Prices are commonly modeled using log-normal distributions (ie. Black-Scholes) because they exhibit multiplicative changes with long tails; skewed exponential growth and high variance. This approach i

Range Oscillator (Zeiierman)█ Overview
Range Oscillator (Zeiierman) is a dynamic market oscillator designed to visualize how far the price is trading relative to its equilibrium range. Instead of relying on traditional overbought/oversold thresholds, it uses adaptive range detection and heatmap coloring to reveal where pri

Volume Surprise [LuxAlgo]The Volume Surprise tool displays the trading volume alongside the expected volume at that time, allowing users to spot unexpected trading activity on the chart easily.
The tool includes an extrapolation of the estimated volume for future periods, allowing forecasting future trading activity.
🔶 U

See all indicators and strategies
Community trends
Massive Upside Ahead: Top 5 Stocks With Big 2026 Potential📌 Top 5 Stocks for 2026 (Monthly Chart Setups)
I just published a new breakdown focused on multi-month / multi-year moves — not short-term noise. Using the monthly timeframe, I walk through structure + momentum to find the next potential 2x–10x runners.
Names covered:
• NYSE:ZETA – cup & handle

GOOG: Is a 10% Surge Imminent? The Setup for $340 Explained🚀 NASDAQ:GOOG : Is a 10% Surge Imminent? The Setup for $340 Explained
In the noisy world of trading, clarity is power.
Today, we are looking at Alphabet Inc. (GOOGL). We are not predicting the future, we are simply preparing for a high-probability outcome.
We have identified a textbook Bull Fla
Is that reverse Head & Shoulders?Is that reverse Head & Shoulders? Potential bilullish scenario for next weeks. Only question is, is it gonna start now? Or we still in bear mood over the Christmass - mid January?

$ptonyieahhh we are back
economy is sketchy right now. But a lot of small caps are looking good.
Volume shelf, potential head and shoulder, volume seems to be slightly higher than usual and seeing it breaking a down trend?
will see

UNH: 50% Inception"All I want to buy in 2025 is Healthcare" has been what I've told people that ask me about this tech stock or that AI company. It is my nature to look for what sector is the most downtrodden and find opportunity there... NOT in what "everyone" is talking about. I still feel that way as 2025 comes

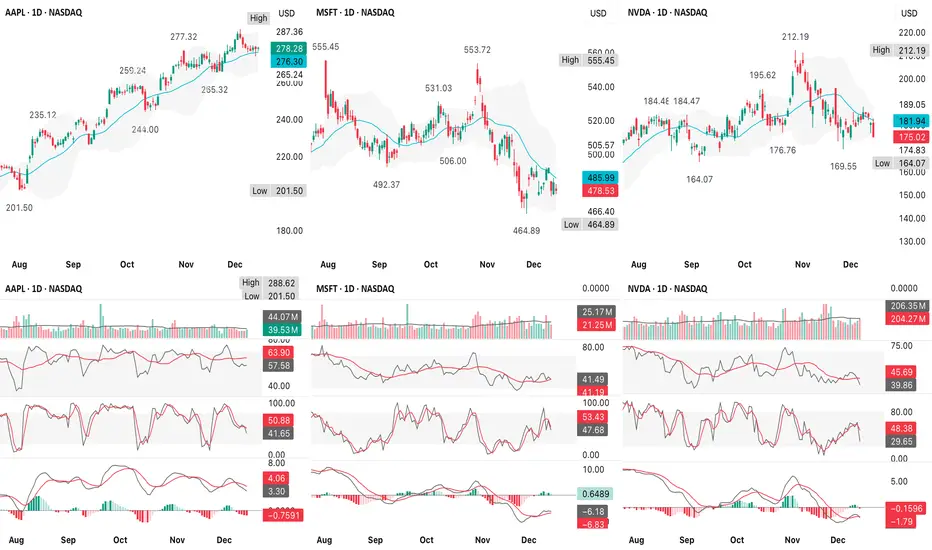
QQQ Santa Rotation?A look at the component charts lines up very cleanly with the broader QQQ direction into 2026
I am deliberately skeptical & weighting what usually leads, not what feels bullish/bearish emotionally
1. Clear leadership split or still acting well/potential leaders
AAPL
Above rising short-term M
$CGC: Monster upside possibleGM gents,
I know the stock moved 50% in one day. Since it's related to Trump, people will likely fade this because they hate him. But hear me out:
Every time there was a monthly uptrend signal on the chart, we saw an average rally of 341.75% (or 12.97 times the ATR value at the time of the signal)

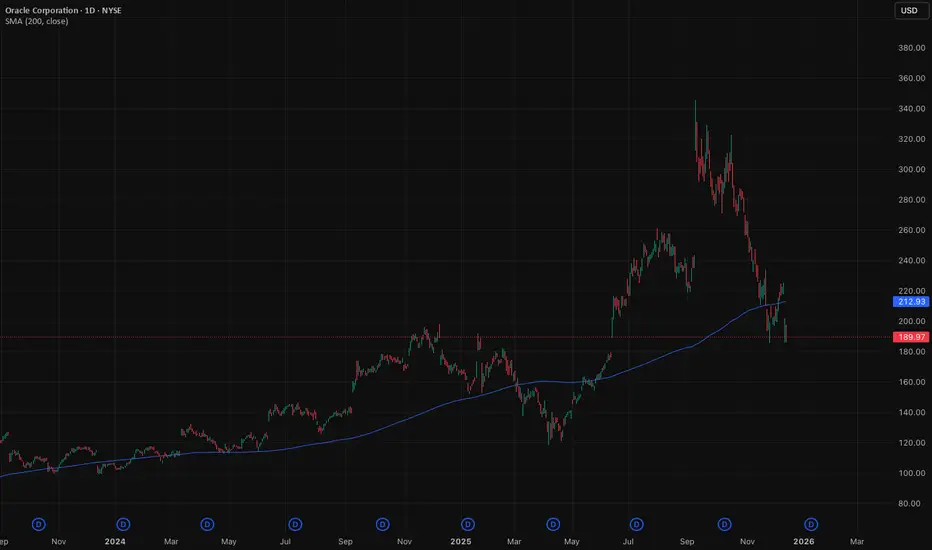
Oracle down, more to comeWe're upgrading our Oracle recommendation and maintaining our Short call. The stock is down around 30% since our initial note in September , and we think there is more downside now that the price is trading sub $200 per share.
If the stock doesn't bounce back above the 200-day moving average, we
TSLA - Three Potential Paths Within Broad ChannelThis 4H TSLA layout maps out three main scenarios as price trades inside a larger descending channel. The left panel shows a bullish recovery path: after the recent pullback, price holds the mid‑channel area and grinds higher, eventually breaking toward the upper boundary and targeting the 500–540 z

close above 7.35 will be bullish and i will be long. close above 7.35 will be bullish and i will be long.

See all stocks ideas
Today
PLCEChildren's Place, Inc. (The)
Actual
—
Estimate
0.70
USD
Today
RICKRCI Hospitality Holdings, Inc.
Actual
—
Estimate
1.81
USD
Today
BNEDBarnes & Noble Education, Inc
Actual
—
Estimate
—
Today
GTIMGood Times Restaurants Inc.
Actual
—
Estimate
—
Today
IMMRImmersion Corporation
Actual
—
Estimate
0.10
USD
Today
BNBXBNB Plus Corp.
Actual
—
Estimate
−22.50
USD
Today
CTXRCitius Pharmaceuticals, Inc.
Actual
—
Estimate
−0.43
USD
Today
NMTCNeuroOne Medical Technologies Corporation
Actual
—
Estimate
−0.04
USD
See more events
Today
DTDTDt House Ltd.
Exchange
NASDAQ
Offer price
4.00 - 5.00
USD
Today
R
RIKURiku Dining Group Ltd.
Exchange
NASDAQ
Offer price
4.00 - 6.00
USD
Today
ELCGELC Group Holdings Ltd.
Exchange
NASDAQ
Offer price
4.00 - 6.00
USD
Tomorrow
U
UPXUptrend Holdings Ltd.
Exchange
NASDAQ
Offer price
4.00 - 5.00
USD
Dec 17
A
ANDGAndersen Group Inc.
Exchange
NYSE
Offer price
14.00 - 16.00
USD
Dec 17
MDLNMedline Inc.
Exchange
NASDAQ
Offer price
—
See more events
Community trends
2025 BITCOIN TARGETS: Reality Check
Forecasting is easy. Being right is hard.
1. When Targets Turn Into Illusions
Look at this chart.
Bitcoin at $90,000. Sixteen days left in 2025.
And every “expert” target — JPMorgan, VanEck, Standard Chartered, Tom Lee, Kiyosaki, BlackRock, Cathie Wood —
all of them missed. Every single one.
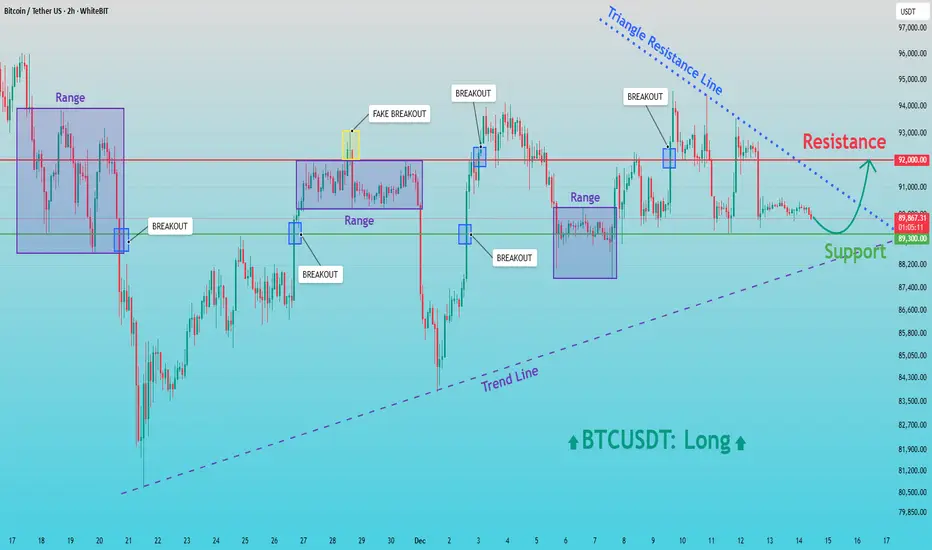
BTCUSDTHello Traders! 👋
What are your thoughts on BITCOIN?
Bitcoin is currently consolidating within a well-defined range between $88,000 and $95,000, while continuing to trade inside an ascending channel.
The lower boundary of this ascending channel aligns closely with the $88,000 support zone, adding

BTC Corrections Don’t Kill Bull Market. They Power Them1. Primary Trend Structure
Macro trend: Clearly bullish. Price has respected a rising diagonal trendline since the 2022–2023 cycle low. Market structure shows higher highs and higher lows, confirming an intact uptrend.
This is a classic bull market staircase: impulsive advances (green boxes) follo
How long will market manipulation continue?If this daily candle confirms the triangle breakout, the bearish trend will be validated and the price could drop to $83,000. A price reversal is unlikely before the New Year.
And if this market cannot free itself from manipulation, it is doomed to collapse.

BTC/USDT | Hold 90K or Prepare for a Heavy Flush? Let's See!CRYPTOCAP:BTC pushed into $94,700, tapped the target perfectly, and then slipped into a sharp correction. Right now Bitcoin is trading around $90,000, and the entire market is focused on a single decision level. If BTC can stabilize above $90,000 within the next 24 hours, the bullish structure stay
BTCUSD: Buyers in Control - Resistance Retest AheadHello everyone, here is my breakdown of the current BTCUSDT setup.
Market Analysis
BTCUSDT is currently trading within a broadly bullish structure, supported by a rising trend line that has been respected after the major sell-off and subsequent recovery. Following the strong decline, price formed
BTCUSD Holds Buyer Zone - Push Toward 96,700 LikelyHello traders! Here’s my technical outlook on BTC/USD based on the current market structure. After a prolonged decline, Bitcoin reversed from the Support Level and broke out of the downward channel, shifting momentum in favor of buyers. The price then moved into a consolidation Range, where accumula

Bitcoin Testing Dynamic Support on 4H TimeframeOn the 4 hour timeframe Bitcoin is facing a key resistance at 94334 USD and is currently moving along a dynamic support line.
If this support is broken the next strong support is located around 84000 USD which could be suitable for swing trading and potential long setups.
Bitcoin: Weakness Is Where Opportunity Lurks.Bitcoin is coming off a double top lower high within what appears to be a bearish triangle formation. While this pattern is going to elicit bearish reactions from the herd (experts), it is important to ANTICIPATE potential turning points that can catch everyone off guard. While Bitcoin can break low

major divergence for BTCBitcoin is seeking a liquidity zone to rebound towards $300,000 before 2030.

See all crypto ideas
GOLD 1H CHART ROUTE MAP UPDATE & TRADING PLAN FOR THE WEEKHey Everyone,
Please see our 1h chart levels and targets for the coming week.
We are seeing price play between two weighted levels with a gap above at 4306 and a gap below at 4270, as support. We will need to see ema5 cross and lock on either weighted level to determine the next range.
We will se

XAUUSDHello Traders! 👋
What are your thoughts on GOLD?
Gold is currently moving within an ascending channel and is approaching the channel ceiling.
This area coincides with the previous high and the All-Time High (ATH), making it highly significant.
A bearish reaction is expected in this zone.
Probable

2 Scenarios - GOLDHello traders,
the gold price has reached the resistance zone (4338 – 4355).
We now have two possible scenarios:
🟢 BULLISH SCENARIO:
If the market breaks and closes above the resistance,
we can expect a bullish continuation 📈
🎯 TARGET: 4400.000
🔴 BEARISH SCENARIO:
If the price breaks a

Lingrid | GOLD Weekly Analysis: Bull Market Back in CommandOANDA:XAUUSD perfectly played out my previous weekly idea . Price capped off another powerful week, decisively breaking above the November high and confirming its bullish trajectory toward fresh all-time highs beyond $4,400. This isn’t just momentum—it’s structural. The market has transitioned fro

12.15-19 Gold Trading Analysis for Next Week BFORE Xmas 1. Year-End Liquidity Profile
As we head into the pre-Christmas week, market liquidity will thin: fewer participants will amplify short-term volatility, though long-term allocating capital (central banks/ETFs) will limit deep pullbacks.
2. Key Weekly Chart Levels (Aligned with the Chart)
1. Supp
THE KOG REPORT THE KOG REPORT:
In last week’s KOG Report, we wanted to see the immediate resistance fail and give us the short trade into defence which worked well. Due to there being now break of defence and our indicators suggesting a long, we managed to get a long into the higher defence box which ultimately

XAUUSD Defends Support – Upside Move Toward 4,380 ExpectedHello traders! Here’s my technical outlook on XAUUSD based on the current market structure. Gold continues to trade within a well-established bullish trend, supported by a clear ascending Trend Line that has been respected after multiple pullbacks. After an earlier rejection from the upper Resistanc

GOLD - Distribution phase. Target - ATH (4380), 4400...FX:XAUUSD is rallying after breaking through consolidation resistance. The fundamental background is positive, with the train heading for an all-time high.
Expectations of a soft Fed policy remain, with the market pricing in two rate cuts in 2026. India's pension fund regulator has allowed in

XAUUSD – Monday Liquidity Model | Order Block + Trend BiasGold opens the week with a clear directional bias.
Price is trading within the dominant trend while resting near a higher-timeframe order block.
Expect early-week liquidity sweep followed by a reaction from the OB and continuation along the trend line.
Key focus:
• Liquidity grab below/above Asia r

GOLD Consolidation bullish regain chance for upward momentumGOLD is currently in a healthy bullish consolidation within a trading range. The fundamental backdrop remains supportive, with a soft monetary policy stance and a weakening dollar continuing to favour upside potential.
From a technical perspective, price is searching for renewed bullish momentum. A

See all futures ideas
USDCAD at Critical Trend ResistanceHey Traders,
In tomorrow’s trading session, we are monitoring USDCAD for a potential selling opportunity around the 1.38000 zone.
Technical structure:
USDCAD remains in a clear downtrend and is currently in a corrective phase, with price retracing toward the 1.38000 area — a key zone of trend resi

NZDCHF Potential Long Setup #3 (High Probability Reaction)MAIN TIME FRAME: 20H (Directional Bias)
Bullish Bias Confirmed
1.) Long-term trendline break
2.) SuperTrend flipped to green
3.) EMA 14 crossed above EMA 50 after prolonged consolidation
4.) Ichimoku Cloud breakout after extended ranging
5.) Back-to-back Wide Divergences confirmed after res

USDGBP road map (4h) !The price has followed the descending channel up to now, and this bearish trend will continue until the descending channel is broken by bullish candles.

EURUSD: Sellers Drive Pullback - 1.1670 Support in FocusHello everyone, here is my breakdown of the current EURUSD setup.
Market Analysis
EURUSD remains in a broader bearish structure, and the recent price action is unfolding within a clear downward context. After moving through a prolonged range phase, the pair broke lower and continued to respect th

EURAUD Idea: Buying the Dip at FVG Support
I am monitoring a potential long opportunity.
Key Technicals:
Trend: Short-term bullish structure.
Area of Interest: Overlap of Demand Zone + FVG.
Setup: Waiting for a retrace to fill the imbalance.
The Setup:
Entry: Limit orders around the FVG fill (Green Zone).
Stop Loss: Below the structural

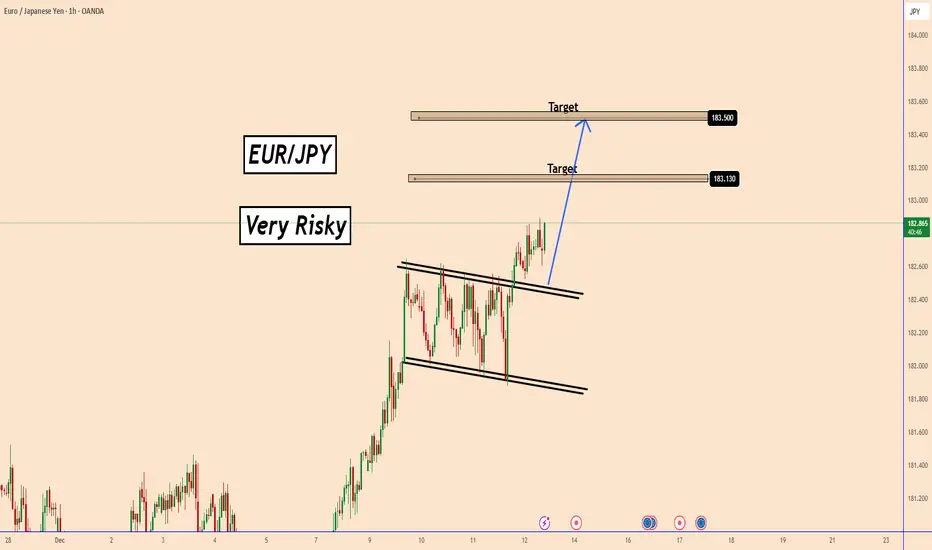
EURJPY Breaks the Flag! Bullish Continuation in PlayEURJPY Breaks the Flag! Bullish Continuation in Play
EURJPY continues its bullish momentum after breaking out of the Flag channel.
The breakout shows strong buyer pressure, and as long as the price holds above the channel’s upper boundary, the bullish structure remains intact.
With momentum buil
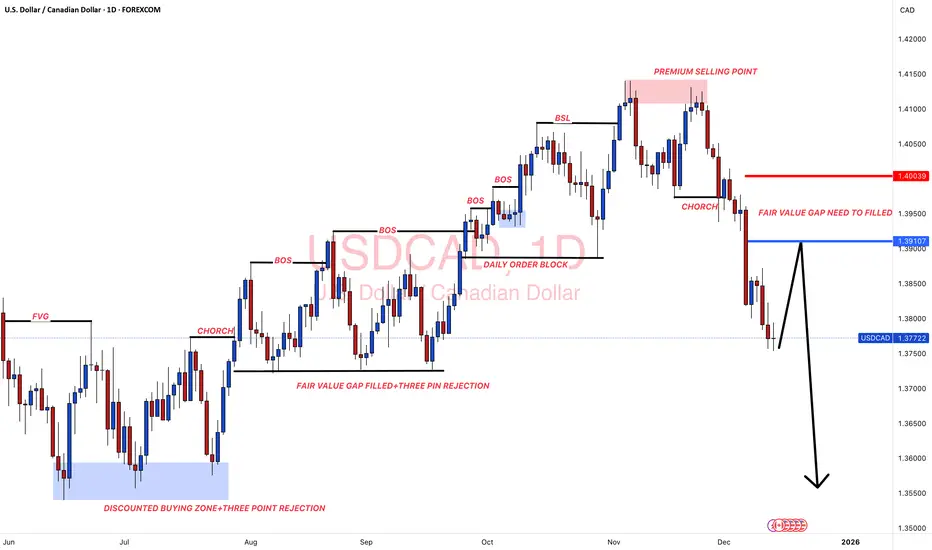
#USDCAD: A Perfect Selling Zone For The Week 15/12/2025Dear Traders,
Overview On USDCAD📈
🔺Price has left a great area of selling zone which need to be filled; we already have given an entry point and an exit point for you to identify the selling zone easily. USD is likely to show some minor bullish behaviour which will push the price of USDCAD to our
EURUSD: Bullish! Buy The DIp!Welcome back to the Weekly Forex Forecast for the week of Dec 15 - 19th.
The EUR is stronger against a weakened USD, due to the interest rate cut by the Fed. I expect the bullishness to continue into next week.
Look for a pullback into the +FVG, and if there is a valid buy setup there on the LTFs,

EURO/USD 4 hour bearish analysis setupThere is of 4 hour EURO/USD trade chart setup major points are shows in bellow
Market Structure
Overall trend: Short-term bullish, but price is now showing weakness at resistance
Price moved strongly up inside an ascending channel
Now we see rejection + lower high, suggesting a pullback or short

USDCAD Tapped Support. A bounce seems likely nextUSDCAD price dropped lower with strong bearish momentum. That selloff broke previous structure and showed a clear shift in control.
However price now tapped into a well-defined demand zone. And notice the reaction. Selling pressure is starting to slow down.
This is a big clue.
If price holds this

See all forex ideas
| - | - | - | - | - | - | - | ||
| - | - | - | - | - | - | - | ||
| - | - | - | - | - | - | - | ||
| - | - | - | - | - | - | - | ||
| - | - | - | - | - | - | - | ||
| - | - | - | - | - | - | - | ||
| - | - | - | - | - | - | - | ||
| - | - | - | - | - | - | - |
Trade directly on Supercharts through our supported, fully-verified, and user-reviewed brokers.


