Where Is Oil Heading To ? - /CL Analysis 1) Technical Perspective: Support & Resistance
~$65 was a support zone earlier (2021–2024). In 2025–26, that $65 area now often acts as resistance. Prices have come down toward $55
2) Fundamental Drivers Behind the Downtrend
Oil has been in a multi-year decline from the highs seen in 2022 afte

The best trades require research, then commitment.
Get started for free$0 forever, no credit card needed

Scott "Kidd" PoteetThe unlikely astronaut

Where the world does markets
Join 100 million traders and investors taking the future into their own hands.

Dollar Off to Weak Start After Worst Year Since 2017. Now What?The US dollar rang in 2026 without much enthusiasm. No fireworks. No flex. Just a quiet shuffle out of the gate that felt eerily familiar to anyone who shoved cash in FX markets last year.
After logging its worst annual performance since 2017, the greenback has started the new year on the back foot

Gold - Control vs Patience… Who Wins Next?Gold hasn’t done anything crazy lately, and that’s exactly the point.
Zooming out, the structure is still bullish. Every dip so far has been met with buyers, and the market keeps printing higher highs and higher lows.
Right now, price is sitting inside what I like to call a decision zone. This is

SUI is on the verge of another rally (4H)From the point where we marked the green arrow on the chart, a bullish phase has started on SUI. This area acted as a key reaction zone where buyers stepped in decisively, shifting market sentiment from corrective to bullish.
Based on the current price structure, it appears that we are developing a

XAUUSD (H4) – Monday SetupGeopolitical shock risk, gold may spike | Trade liquidity and reaction zones only
Quick summary
News around Trump’s claim that Maduro has been detained, plus Venezuela’s response (they don’t know his and his wife’s whereabouts and are demanding proof of life), raises geopolitical uncertainty sharpl
ETHBTC W Pattern Makes the Case for a Macro Bull MarketIt seems pretty clear to me that ETHBTC is in a multi year W pattern. The higher low on the W, with hidden bullish divergence helps confirm the pattern, as does the recent price action.
From April to May of 2025 price consolidated in a low and then surged to a local high in August when it the oran

BTC/Gold A Simple Signal That Has Worked Only 4 Times in HistoryThe BTC/XAU (monthly) chart has produced only four clear local bottom signals throughout its entire history.
This is a deliberately simple, noise-free setup. No indicators overload, no short-term speculation—just relative strength between Bitcoin and gold.
Each of these historical bottom zones mar

Gold Bullish Outlook | Dollar Weakness & Geopolitical Risks!Hey Traders,
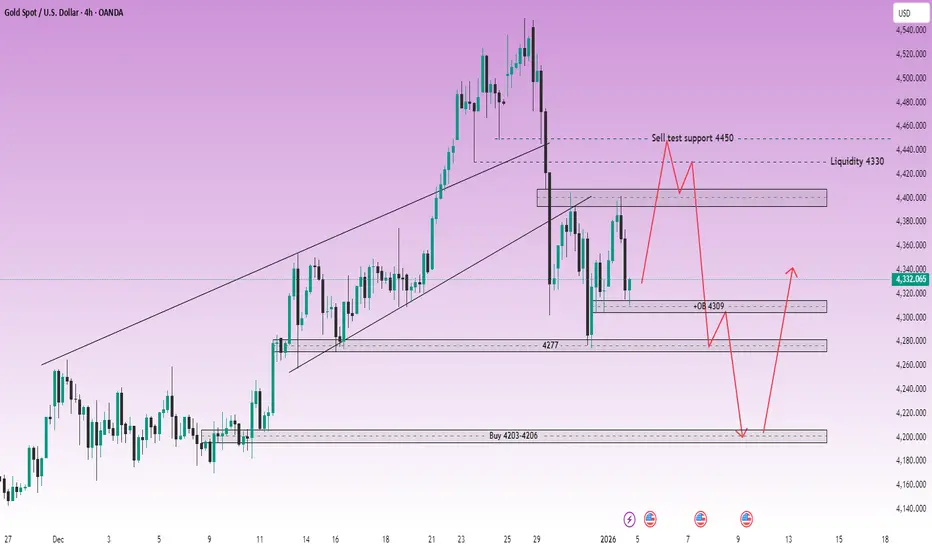
In the coming week, we are closely monitoring XAUUSD (Gold) for a potential buying opportunity around the 4,280 zone. Gold remains in a strong bullish trend and is currently undergoing a healthy corrective pullback, approaching a key trendline confluence and 4,280 support & resistance

2025 Ends With a Breakout?Year Ends With a Breakout, yes!🚀📈
Bitcoin just delivered what the market was waiting for — a clean breakout back into the channel 🎯
This is how we close the year… with intent.
Key Technicals:
• Major support holding at 88,273 – 88,535
• ATA 200 support confirmed
• Price reclaimed the channel

Gold Costs 175 Hours Of Work To BuyI like to price everything I buy in hours of work.
That’s the only price that actually matters.
Money can be replaced. Time can’t. When I look at a purchase in terms of how much of my life it costs, it becomes instantly clear whether it’s worth it.
My kids hate me for it because their view is that

See all editors' picks ideas
Arbitrage Detector [LuxAlgo]The Arbitrage Detector unveils hidden spreads in the crypto and forex markets. It compares the same asset on the main crypto exchanges and forex brokers and displays both prices and volumes on a dashboard, as well as the maximum spread detected on a histogram divided by four user-selected percenti

Multi-Distribution Volume Profile (Zeiierman)█ Overview
Multi-Distribution Volume Profile (Zeiierman) is a flexible, structure-first volume profile tool that lets you reshape how volume is distributed across price, from classic uniform profiles to advanced statistical curves like Gaussian, Lognormal, Student-t, and more.
Instead of forcin

Multi-Ticker Anchored CandlesMulti-Ticker Anchored Candles (MTAC) is a simple tool for overlaying up to 3 tickers onto the same chart. This is achieved by interpreting each symbol's OHLC data as percentages, then plotting their candle points relative to the main chart's open. This allows for a simple comparison of tickers to tr

Vdubus Divergence Wave Pattern Generator V1The Vdubus Divergence Wave Theory
10 years in the making & now finally thanks to AI I have attempted to put my Trading strategy & logic into a visual representation of how I analyse and project market using Core price action & MacD. Enjoy :)
A Proprietary Structural & Momentum Confluence System

Per Bak Self-Organized CriticalityTL;DR: This indicator measures market fragility. It measures the system's vulnerability to cascade failures and phase transitions. I've added four independent stress vectors: tail risk, volatility regime, credit stress, and positioning extremes. This allows us to quantify how susceptible markets are

Volatility Risk PremiumTHE INSURANCE PREMIUM OF THE STOCK MARKET
Every day, millions of investors face a fundamental question that has puzzled economists for decades: how much should protection against market crashes cost? The answer lies in a phenomenon called the Volatility Risk Premium, and understanding it may fundam

Volume Gaps & Imbalances (Zeiierman)█ Overview
Volume Gaps & Imbalances (Zeiierman) is an advanced market-structure and order-flow visualizer that maps where the market traded, where it did not, and how buyer-vs-seller pressure accumulated across the entire price range.
The core of the indicator is a price-by-price volume prof

Match Finder [theUltimator5]Match Finder is the dating app of indicators. It takes your current ticker and finds the most compatible match over a recent time period. The match may not be Mr. right, but it is Mr. right now. It doesn't forecast future connection, but it tells you current compatibility for today.
Jokes aside,

Trend Line Methods (TLM)Trend Line Methods (TLM)
Overview
Trend Line Methods (TLM) is a visual study designed to help traders explore trend structure using two complementary, auto-drawn trend channels. The script focuses on how price interacts with rising or falling boundaries over time. It does not generate trade sign

Breakouts & Pullbacks [Trendoscope®]🎲 Breakouts & Pullbacks - All-Time High Breakout Analyzer
Probability-Based Post-Breakout Behavior Statistics | Real-Time Pullback & Runup Tracker
A professional-grade Pine Script v6 indicator designed specifically for analyzing the historical and real-time behavior of price after strong All-Ti

See all indicators and strategies
Community trends
AAPL: The 30% Rule — Why Apple’s Next True Low Likely at 200 USD🍎 AAPL WEEKLY SNAPSHOT — EXECUTIVE SUMMARY
✨ Apple Inc. is entering the late phase of a multi-year corrective cycle
📉 Primary thesis: A ~30% correction is still unfolding, consistent with prior Apple macro drawdowns
🏛️ Macro backdrop: Dow Jones Industrial Average extended near psychological 50,000

NFLX: Massive Head-Shoulder-Formation!Hello There,
welcome to my new analysis about the Netflix stock (NFLX). Recently, I spotted major underlying factors that will be highly determining for the whole upcoming price action. The stock already dumped heavily bearishly towards the downside, almost declining over $150 B in market cap. Such

Nvidia - The -25% correction starts now!✂️Nvidia ( NASDAQ:NVDA ) is about to create a correction:
🔎Analysis summary:
After Nvidia retested major support in mid 2025, we saw another rally of about +125%. But now, Nvidia is rejecting a major resistance trendline and is about to create bearish confirmation. Quite likely that Nvidia wi

APLD Levels New heights with support and mild resistance . I believe APLD reaches the 40s this week,if market conditions allow. Shorts get squeezed!

ZETA – Breakout Confirmed | Primary Wave 3Thesis
NYSE:ZETA is transitioning from long-term accumulation into the early phase of Primary Wave 3 following a confirmed breakout.
Context
- Daily / weekly structure
- Primary Wave 2 completed near $10 (April 2025)
- Wave 1 advanced to ~$22
- Recent phase was a controlled Wave 2 consolidatio

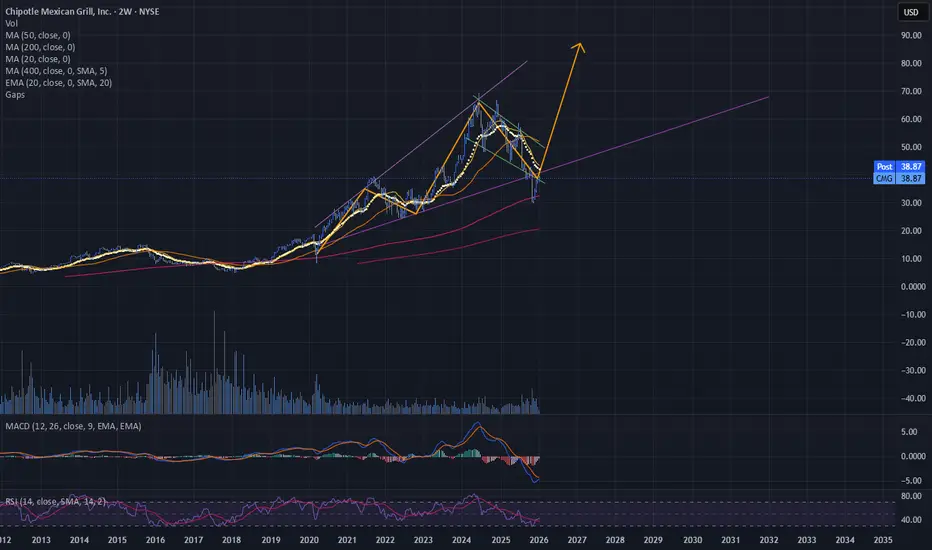
CMG under massive accumulation targeting $88CMG is forming a perfect Livermore cylinder-style accumulation pattern. Initial targets are $88 and final long-term targets is $180.
Note: Chipotle itself is buying its stock. Their board authorized close to 3.8 billion $ worth of stock repurchases (2025 and 2026).
NFA
BTBT - Is the launchpad ready?Approx 50 USD price target
Quite a clear bull penant
Assuming it is within a bearish ascending megaphone type pattern similar to TSLA
Not financial advice

MSTR fud is over, the cartel=banks bought the dipMSTR should be heading to 250$-300$ , chart looks ready for a bounce and bullish sentiment across crypto likely to happen around Feb-March

$META — Short SetupNASDAQ:META — Short Setup
Opened a short in $META. We saw strong selling right out of the open, likely influenced by headlines around China reviewing the Manus acquisition under AI-security scrutiny.
Technically, the chart is forming what looks like a bear flag with downside magnets below. Yes, y

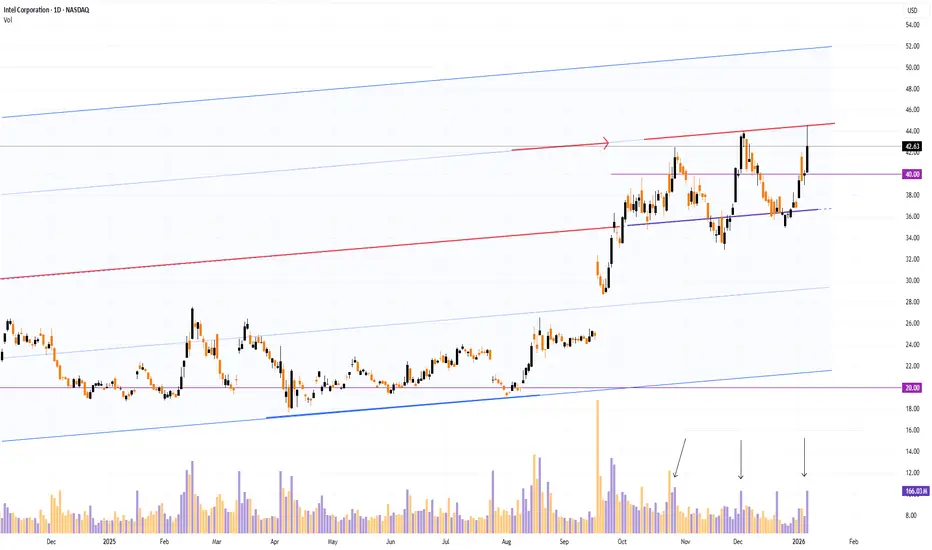
Intel (INTC) shares surge following chip unveilingIntel (INTC) shares surge following chip unveiling
Intel (INTC) shares jumped above $44.30 yesterday, marking a 21-month high. The rally was driven by news from CES 2026, where the company unveiled its new Core Ultra Series 3 processors (codenamed Panther Lake). These are Intel’s first consumer ch
See all stocks ideas
Jan 8
AYIAcuity Inc.
Actual
4.69
USD
Estimate
4.59
USD
Jan 8
RPMRPM International Inc.
Actual
1.20
USD
Estimate
1.41
USD
Jan 8
LNNLindsay Corporation
Actual
1.54
USD
Estimate
1.47
USD
Jan 8
HELEHelen of Troy Limited
Actual
1.71
USD
Estimate
1.70
USD
Jan 8
CMCCommercial Metals Company
Actual
1.84
USD
Estimate
1.57
USD
Jan 8
SNXTD SYNNEX Corporation
Actual
3.83
USD
Estimate
3.73
USD
Jan 8
EDUCEducational Development Corporation
Actual
—
Estimate
—
Jan 8
NEOGNeogen Corporation
Actual
0.10
USD
Estimate
0.06
USD
See more events
No scheduled reports
Community trends
January 2026 Alt Analysis RequestFamily, January 2026 marks the opening of a new trading year and a critical reset point for the broader market. With Bitcoin setting the tone and liquidity gradually repositioning, this phase is decisive for identifying which altcoins are preparing for expansion and which will continue to lag.
Thi

BTC - Demand Did Its Job. Now Watching the ChannelBTC reacted exactly where it was supposed to... the blue demand zone held, and buyers stepped in!
Since that reaction, price has started to shift short-term momentum to the upside, forming a rising channel. Nothing aggressive yet, but structure is slowly improving.
From here, my focus is simple:

BTCUSDT: Pullback Toward Demand ZoneHi!
Bitcoin is showing short-term weakness after failing to hold above the recent high. Price is currently trading below the local resistance area, suggesting a corrective pullback rather than continuation.
The highlighted demand zone around 90.4K–90.9K is a key area to watch. This level previousl

Elise | BTCUSD – M30 | Bearish Structure ContinuationBITSTAMP:BTCUSD
After a strong impulsive rally from the accumulation zone, BTC failed to hold higher structure and printed a decisive bearish continuation move. The breakdown was followed by weak retracements, indicating a lack of strong buying interest. Current price action suggests distribution

BLACKWHALE: $0.01 | Perhaps something Fascinating there are Blue Whales
there are Purple Pepes and Bitcoins
and there is that WHite WHale we all adore and look up to
yet a Black Whale may just be as powerful as an AVENTADOR gunning for greateness
this could turn $100,000 to $1,000,000 just as it did to the oother one
who knows this could be it

BTCUSDT: Bullish Structure Intact - Targeting 93K ResistanceHello everyone, here is my breakdown of the current BTCUSDT setup.
Market Analysis
BTCUSDT previously traded inside a well-defined consolidation range, where price moved sideways and volatility was compressed, showing balance between buyers and sellers. During this phase, multiple internal swings

BTC Analysis: Rising Channel Resistance & Volume Divergence
1. Reaching Ascending Channel Resistance
Looking at the turquoise Ascending Channel on the chart, the current price has reached the top of the channel (resistance line).
In technical analysis, the upper boundary of an ascending channel acts as a strong resistance zone. Unless there is a strong bre

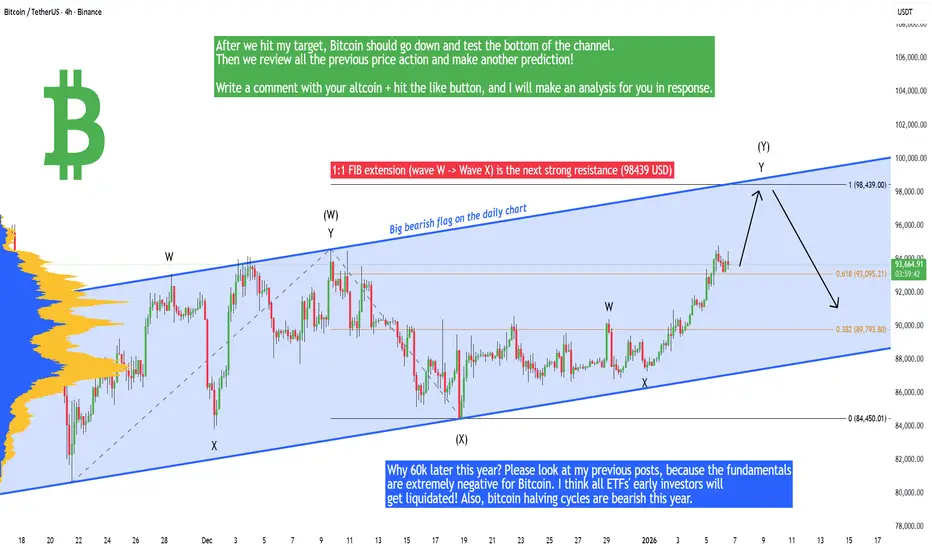
Bitcoin - Soon pump to 98k! But sell here, because...Bitcoin is temporarily bullish, and from a technical point of view, we can expect 98,439 USD in the short term. There are many reasons behind this movement, the first is that Bitcoin is forming a bigger bearish flag that is well visible on the daily chart. This is not the ultimate bottom on Bitcoin
USDT dominance will experience pumps and dumps (4H)One of the key indicators for understanding the market’s direction is this index. As you know, Tether dominance (USDT dominance) moves inversely to Bitcoin.
From the point marked F on the chart, the bearish phase of Tether dominance, which we refer to as wave G, has begun.
Currently, wave G is for

BTCUSDT Long: Holding Above Demand, Eyes on 91,800 RetestHello traders! Here’s a clear technical breakdown of BTCUSDT (3H) based on the current chart structure. BTCUSDT initially traded within a well-defined descending channel, where price consistently respected the lower highs and lower lows, confirming strong bearish pressure. This bearish structure eve

See all crypto ideas
GOLD Price Update – Clean & Clear ExplanationGold is currently trading within a rising channel, which shows that the overall short-term trend remains bullish. Price respected the channel structure multiple times, making higher highs and higher lows, confirming bullish control earlier.
Recently, price reached a strong resistance zone near 4,57

Gold Testing a Key EMA, the Pullback Remains TechnicalOn the OANDA:XAUUSD H1 chart, gold is entering a short-term corrective phase following the previous strong rally. The key point to emphasize is that the bullish structure remains intact, and current price action is mainly about how the market reacts around the major EMA levels.
From a technical p

XAUUSD Rising Support Holds - Next Target 4,500 ResistanceHello traders! Here’s a clear technical breakdown of XAUUSD (4H) based on the current chart structure. After a prolonged consolidation phase, Gold was trading inside a well-defined range, indicating balance between buyers and sellers. This range acted as an accumulation zone before price initiated a

XAUUSD – Bullish Wave Structure Still Intact, Waiting for Wave 4Gold is moving within a clear 5-wave bullish structure, where:
Wave 1 → Wave 3 have already completed with strong impulsive momentum.
Price is currently in the corrective phase of Wave 4, which is technical in nature and not a trend reversal.
Wave 5 to the upside is still expected once downside l

Gold (XAUUSD) – H&S Target Reached, Watching the BounceHi!
Gold did exactly what it was supposed to do.
The head & shoulders played out clean, price dropped into the 4400 area, hit the target, and buyers reacted right away.
This zone lines up with:
Previous structure
Rising trendline support
So the bounce here makes sense.
🎯 If 4400 holds:
→ M

Gold 30Min Engaged ( Bearish Volume Reversal entry Detected )⚡Base : Hanzo Trading Alpha Algorithm
The algorithm calculates volatility displacement vs liquidity recovery, identifying where probability meets imbalance.
It trades only where precision, volume, and manipulation intersect —only logic.
✈️ Technical Reasons
/ Direction — SHORT / Reversal 4471 Area

Lingrid | GOLD Retracement Ends - Bullish Trend ContinuesOANDA:XAUUSD is forming a controlled retracement after printing a higher high, with price now reacting positively above the rising trendline and key demand zone. The pullback appears corrective and structure remains constructive while higher lows continue to form. Momentum has cooled, but buyers ar

GOLD reacting from an important supply/resistance area.Gold is currently trading inside a key consolidation zone after a strong bullish move earlier. Price has started to lose bullish momentum and is now reacting from an important supply/resistance area.
Gold prices slipped to around 4,440 per ounce on Wednesday as investors booked profits following th

Where Is Oil Heading To ? - /CL Analysis 1) Technical Perspective: Support & Resistance
~$65 was a support zone earlier (2021–2024). In 2025–26, that $65 area now often acts as resistance. Prices have come down toward $55
2) Fundamental Drivers Behind the Downtrend
Oil has been in a multi-year decline from the highs seen in 2022 afte
XAUUSD: Descending After Fake Breakout - Bears in ControlHello everyone, here is my breakdown of the current XAUUSD setup.
Market Analysis
XAUUSD initially spent a prolonged period trading inside a well-defined range, where price respected clear support and resistance boundaries. This range reflected market indecision, with neither buyers nor sellers a

See all futures ideas
GBPUSD Institutional Levels: Sell 1.3490 → Buy 1.3360🔱 GBPUSD WEEKLY SNAPSHOT — EXECUTIVE SUMMARY
✨ GBPUSD trading inside a liquidity-driven range with expansion risk
🔄 Current environment: balanced → reactive, awaiting liquidity taps
🧱 Fresh sell-side liquidity / sell zones (premium):
• 1.3460
• 1.3490 upper premium / stop-rich zone
🟢 Fresh buy

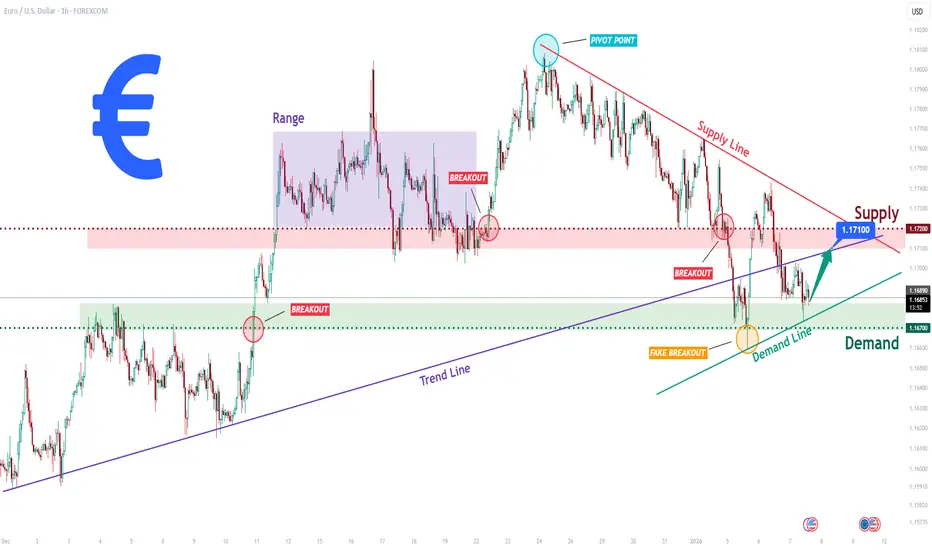
EURUSDHello Traders! 👋
What are your thoughts on EURUSD?
EURUSD was rejected from the resistance zone as expected after reaching the highlighted area.
Price is now moving toward a key support zone, where a rising trendline is also present. This confluence increases the probability of a bullish reaction

08.01.26 Daily ForecastPairs on Watch -
FX:AUDUSD
FX:GBPUSD
FX:GBPCAD
FX:EURCAD
A short overview of the instruments I am looking at for today, multi-timeframe analysis down to what I will be looking at for an entry. Enjoy!

EURUSD Long: Compression Near Key Zones Signals Upcoming MoveHello traders! Here’s a clear technical breakdown of EURUSD (1H) based on the current chart structure. EURUSD previously traded within a well-defined ascending structure, respecting a rising trend line that acted as dynamic support during multiple pullbacks. This bullish phase showed consistent high
EURGBP - When Structure Breaks, Bias FollowsFor a while, EURGBP was respecting a rising blue broadening wedge, keeping the overall momentum bullish. That changed.
📉 Momentum has now shifted from bullish to bearish after price broke below the blue rising structure, signaling a clear loss of upside control.
Since then, price has been tradin

Lingrid | USDCHF Bearish Opportunity from Major ResistanceFX:USDCHF is recovering from the recent bottom but remains capped beneath the broader bearish structure, with price now pressing into the 0.8000 psychological level. This rebound appears corrective, unfolding as a pullback toward the supply area, while the sequence of lower highs still defines the

GBPUSD Could Push Higher? | Rate-Cut Risk Pressures the Dollar!Hey Traders,
In today’s trading session, we are closely monitoring GBPUSD for a potential buying opportunity around the 1.33800 zone. GBPUSD remains in a well-established uptrend and is currently undergoing a healthy corrective pullback, approaching a key trendline confluence and the 1.33800 suppor

GBPAUD Could Continue lowerPrice was trading in a clear range, showing back-and-forth price action with no clear direction. That balance ended once price broke decisively below the range support.
After the breakdown, price attempted to retrace back into the prior range, but the pullback was weak. Its failure to reclaim the ra

EURUSD Tests Key Support — Is This the Base for a Bullish ReversFX:EURUSD on the H1 timeframe has been in a corrective bearish phase following a prolonged distribution period at the highs, with price trending lower beneath declining moving averages. Momentum weakened sharply during the selloff, culminating in a strong downside extension that swept liquidity be

USD/JPY | What's next? (READ THE CAPTION)As you can see in the hourly chart of USDJPY, in the early hours of today, it managed to break through the NWOG and the FVG, going as high as 156.955, before dropping to the low of the FVG at 156.460. Currently it's being traded at 156.680 and it's retesting the NWOG. I expect it to continue working

See all forex ideas
| - | - | - | - | - | - | - | ||
| - | - | - | - | - | - | - | ||
| - | - | - | - | - | - | - | ||
| - | - | - | - | - | - | - | ||
| - | - | - | - | - | - | - | ||
| - | - | - | - | - | - | - | ||
| - | - | - | - | - | - | - | ||
| - | - | - | - | - | - | - |
Trade directly on Supercharts through our supported, fully-verified, and user-reviewed brokers.


