Analysis for What’s Coming - AI Bubble Sentiment The US markets have been described as “on a rally” for quite some time. I would not agree if it is meant to describe the overall US market, but would agree if it refers specifically to AI or tech stocks. Why?
Among the four major US indices, the Russell—representing a much broader base of US-listed

Black Friday
The greatest deal of the year is here.Get it before the point of no return.

Nvidia Earnings Finally Ease Market Jitters. Are AI Bulls Back?It’s confirmed. This is Nvidia’s stock market and we all live in it.
Nvidia NASDAQ:NVDA reported yet another record-breaking quarter, instantly soothing market nerves after a week filled with talks of “AI bubble,” “valuation fever,” and “maybe Michael Burry is right again.” It was the cherry of t

META now close to a critical trendlineMETA is approaching a significant technical region.
The trendline currently in focus originated on 31 October 2022, and it has remained relevant over time.
This same trendline was retested twice in April of this year, and price action is once again moving toward it after achieving a new all-time

SOL — Deep Pullback Into Major SupportSOL has been in a steady freefall over the past weeks. On the higher timeframes the key support and resistance zones are very clearly defined. The $250 level acted as a big resistance area, with multiple rejections showing sellers were firmly in control up there.
On the downside, the $125 support z

The Market is at 80°C. What Happens at 100°C?Greetings, everyone.
Today, I don't want to talk about the news. I want to talk about what truly matters: market structure. Many traders are currently looking for a news event to explain the current lull and predict Bitcoin's next move. They are looking in the wrong direction.
Remember this: the n
XAUUSD Long: Buyers Eye Push Toward $4,100 ResistanceHello traders! XAUUSD is developing a clear technical structure after reacting multiple times to both the Supply and Demand zones, forming a well-defined pattern of price behavior. Recently, Gold rejected the Supply Line after creating a new Pivot Point near the $4,230 area — the same region where a

From Shutdown Relief to AI Anxiety — Two Narratives Driving ESMarket Theme
The week began on a strong footing, driven by a bullish Sunday reopen in ES after news broke that the 43-day government shutdown was set to end, following the Senate’s late-night support for a potential agreement on November 9th. This relief catalyst created early upside momentum, pus

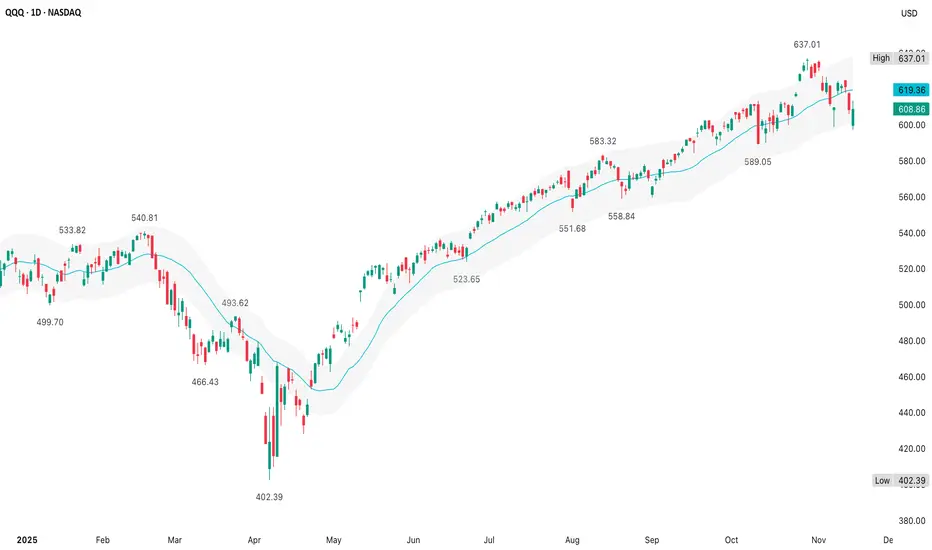
QQQ (14 November)The +/- 3% envelope with the 20d MA works well for mean-reversion strategies since it clearly shows inflection points where price may snap back toward the average
How far is price from its 20d MA & is price near extremes of the 3% bands?
Bollinger Bands adjust dynamically with volatility
Price
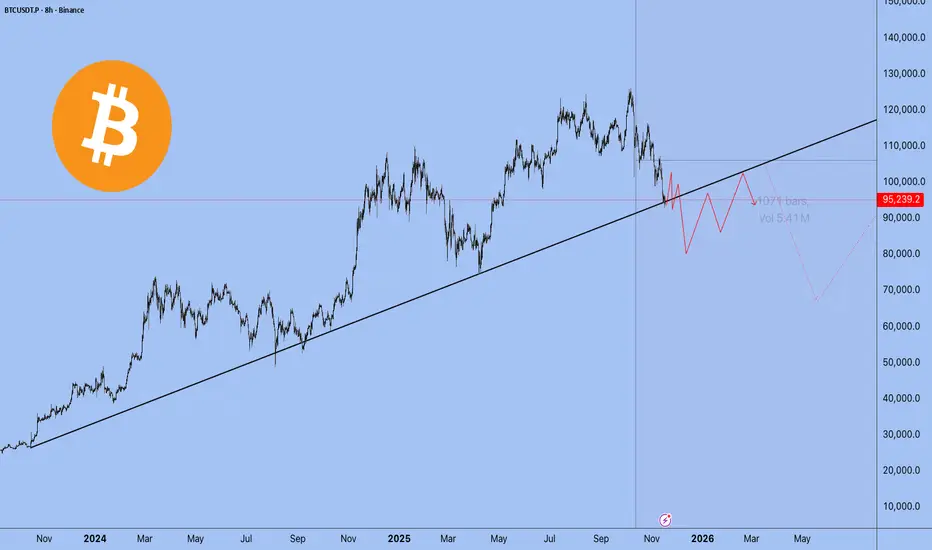
Technical analysis of bitcoin key levels and wedge chart pattern1. Trend Structure
The descending trendline (Resistance line) at the top of the chart remains valid.
The price has repeatedly faced rejection at this level, indicating that the medium-term downtrend is still intact.
2. Key Price Levels and Indicators
50-week EMA
The price has recently

Bitcoin FOMOThe technical levels I am watching in the near term are:
Upside Resistance:
104800
117,500
All Time High
Downside Support
87,700
84,100
Throughout this bull cycle, starting from the low in November 2022, following the January 2023 Ichimoku breakout that truly triggered the bull tre

See all editors' picks ideas
Holographic Market Microstructure | AlphaNattHolographic Market Microstructure | AlphaNatt
A multidimensional, holographically-rendered framework designed to expose the invisible forces shaping every candle — liquidity voids, smart money footprints, order flow imbalances, and structural evolution — in real time.
---
📘 Overview
The Hol

PriceFormatLibrary for automatically converting price values to formatted strings
matching the same format that TradingView uses to display open/high/low/close prices on the chart.
█ OVERVIEW
This library is intended for Pine Coders who are authors of scripts that display numbers onto a user's charts. T

LogNormalLibrary "LogNormal"
A collection of functions used to model skewed distributions as log-normal.
Prices are commonly modeled using log-normal distributions (ie. Black-Scholes) because they exhibit multiplicative changes with long tails; skewed exponential growth and high variance. This approach i

Range Oscillator (Zeiierman)█ Overview
Range Oscillator (Zeiierman) is a dynamic market oscillator designed to visualize how far the price is trading relative to its equilibrium range. Instead of relying on traditional overbought/oversold thresholds, it uses adaptive range detection and heatmap coloring to reveal where pri

Volume Surprise [LuxAlgo]The Volume Surprise tool displays the trading volume alongside the expected volume at that time, allowing users to spot unexpected trading activity on the chart easily.
The tool includes an extrapolation of the estimated volume for future periods, allowing forecasting future trading activity.
🔶 U

Smooth Theil-SenI wanted to build a Theil-Sen estimator that could run on more than one bar and produce smoother output than the standard implementation. Theil-Sen regression is a non-parametric method that calculates the median slope between all pairs of points in your dataset, which makes it extremely robust to o

Fair Value Gaps by DGTFair Value Gaps
A refined, multi-timeframe Fair Value Gap (FVG) detection tool that brings institutional imbalance zones to life directly on your chart.
Designed for precision, it visualizes how price delivers into inefficiencies across chart, higher, and lower (intrabar) timeframes — offering a fl

TASC 2025.11 The Points and Line Chart█ OVERVIEW
This script implements the Points and Line Chart described by Mohamed Ashraf Mahfouz and Mohamed Meregy in the November 2025 edition of the TASC Traders' Tips , "Efficient Display of Irregular Time Series”. This novel chart type interprets regular time series chart data to create an ir

Simplified Percentile ClusteringSimplified Percentile Clustering (SPC) is a clustering system for trend regime analysis.
Instead of relying on heavy iterative algorithms such as k-means, SPC takes a deterministic approach: it uses percentiles and running averages to form cluster centers directly from the data, producing smoo

Adaptive Volume Delta Map---
📊 Adaptive Volume Delta Map (AVDM)
What is Adaptive Volume Delta Map (AVDM)?
The Adaptive Volume Delta Map (AVDM) is a smart, multi-timeframe indicator that visualizes buy and sell volume imbalances directly on the chart.
It adapts automatically to the best available data resolution

See all indicators and strategies
Community trends
Nvidia Earnings Finally Ease Market Jitters. Are AI Bulls Back?It’s confirmed. This is Nvidia’s stock market and we all live in it.
Nvidia NASDAQ:NVDA reported yet another record-breaking quarter, instantly soothing market nerves after a week filled with talks of “AI bubble,” “valuation fever,” and “maybe Michael Burry is right again.” It was the cherry of t
QS: Double Top Confirmed — Potential Decline Toward $5.50QS: Double Top Confirmed — Potential Decline Toward $5.50
QS reached $19 on October 15th, marking a significant new high after a long period of consolidation. This level had not been tested since early April 2022.
However, the sharp rise—driven partly by news—appears to have triggered profit-taki

Apple - This stock will collapse!🥊Apple ( NASDAQ:AAPL ) is reversing right now:
🔎Analysis summary:
Starting back five years ago, Apple established a major rising channel pattern. Following this channel, Apple recently created a textbook +40% move higher. But with the current retest of resistance, we will certainly see anothe

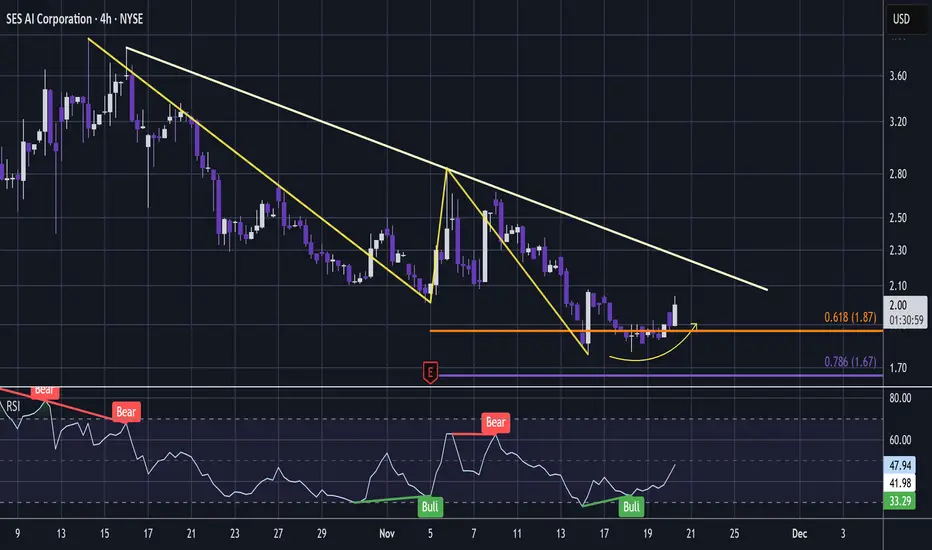
SES - Dip Buy In Micro AI stock Collaborating With NVDASES New1 High Vol1
Here's another wild AI setup:
NVDA recently popped on positive news and this positivity may trickle down into wild stocks like SES that is partnering with NVDA.
AI write up:
"SES AI has partnered with Nvidia to accelerate the discovery of next-generation battery materials usi
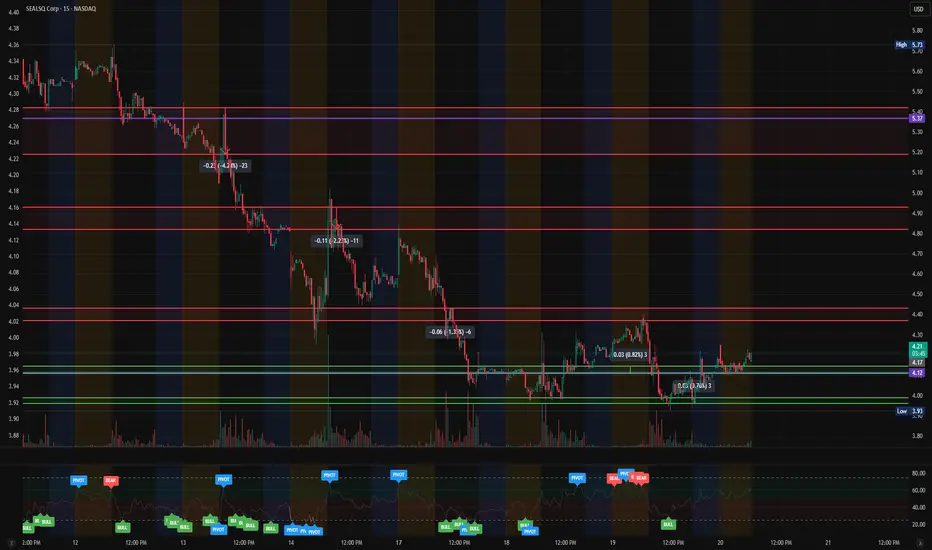
$LAES — Watching for a Reversal Attempt After Finding Bid SupporNASDAQ:LAES has been in a controlled downtrend over the past several sessions, but today’s early movement shows the first signs of stabilization. Price has now tested the $4.12 demand zone multiple times and continues to hold, creating a potential short-term base for a bounce attempt.
This level h
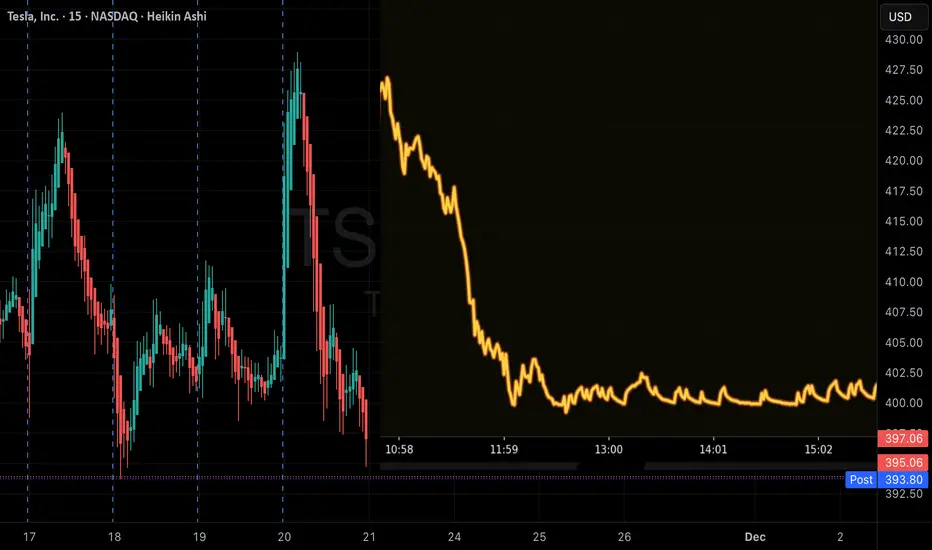
QuantSignals V3 TSLA Alert: Strong Bearish MomentumTSLA 1M | QuantSignals Katy | 2025-11-20
Direction: PUT (Bearish)
Confidence: 75%
Current Price: $427.76
Final Target: $411.82 (-3.73%)
30min Target: $419.17 (-2.01%)
Entry: $427.76
Take Profit: $415.01
Stop Loss: $434.18
Volatility: 24.9%
Analysis:
Katy AI predicts steady bearish movemen
MSTR chart update. Bounce to $266-315 before more downside?Updating the prior chart as the levels I had were off. I think it's likely that we bounce from this level.
You can see we've now hit a key support and filled a gap that was on the chart at $176. I think it's likely that we see a strong bounce from this level.
Reasons being:
1. We're at a key su

ALL-IN TTDThis is a major support that i suspect we will finally have a proper reversal take place. Target the all time highs givning is a +265% return.
Good luck

Looking to long CRWV at $60Previously I was bearish on coreweave, and wow did that cause some strife in the comments, but I've closed my short yesterday and now looking to long $60.
Good luck!

Concerns on market specifically NVDA - Not financial adviceSome thoughts and concerns watching the market as an amateur investor looking at historical shifts and trends. This is not a prediction and not to be considered financial advice in any manner shape or form. It is simply a personal opinion based on my impression of the market. Please discuss any choi

See all stocks ideas
Today
FROFrontline Plc
Actual
0.18
USD
Estimate
0.27
USD
Today
AZTAAzenta, Inc.
Actual
0.21
USD
Estimate
0.19
USD
Today
BJBJ's Wholesale Club Holdings, Inc.
Actual
1.16
USD
Estimate
1.09
USD
Today
BKEBuckle, Inc. (The)
Actual
0.96
USD
Estimate
0.95
USD
Today
ASYSAmtech Systems, Inc.
Actual
—
Estimate
−0.03
USD
Today
IESCIES Holdings, Inc.
Actual
3.77
USD
Estimate
3.11
USD
Today
MOG.AMoog Inc.
Actual
2.56
USD
Estimate
2.22
USD
Today
BMNRBitMine Immersion Technologies, Inc.
Actual
−0.10
USD
Estimate
−0.10
USD
See more events
Today
R
REEDReed's Inc.
Exchange
NYSE
Offer price
—
Nov 26
R
RGNTRegentis Biomaterials Ltd.
Exchange
AMEX
Offer price
10.00 - 12.00
USD
Dec 1
PPHCPublic Policy Holding Co. Inc.
Exchange
NASDAQ
Offer price
—
Dec 1
HWEPHW ELECTRO Co. Ltd.
Exchange
NASDAQ
Offer price
—
Dec 1
AIGOAigo Holding Ltd.
Exchange
NASDAQ
Offer price
4.00 - 6.00
USD
See more events
Community trends
Bitcoin Roadmap: Is This the Beginning of the Short-Term Rally?Today I want to share with you the Bitcoin ( BINANCE:BTCUSDT ) chart on the 15-minute time frame. This analysis is in line with the previous analysis (still valid) .
These days, considering that Bitcoin is facing many parameters to analyze. One of the most important parameters is the SPX500

BITCOIN Is the first Bear Cycle RALLY approaching?Bitcoin (BTCUSD) has been on a brutal (but technically anticipated) correction ever since its October 06 All Time High (ATH), registering 6 red candles out of last 7. We have shown in previous analyses why the Bear Cycle has technically started, how the market lost the 1W MA50 (blue trend-line) and

BTCUSD Channel Support Holds as Price Targets $85K PullbackHello traders! Let’s break down the current BTCUSD market structure. Bitcoin is trading inside a well-defined descending channel, forming consistent lower highs and lower lows. This structure confirms that the market is still moving within a broader bearish trend. Earlier, BTC created a large range

Bitcoin - Approaching the Make or Break ZoneBitcoin continues to bleed lower after multiple liquidity sweeps, and the decline is beginning to compress into a more controlled down move. The chart shows a clear shift in sentiment after the all time high sweep, then another daily sweep that helped close both the daily and 4H imbalance. Since los

TradeCityPro | Bitcoin Daily Analysis #226👋 Welcome to TradeCity Pro!
Let’s dive into today’s Bitcoin analysis. Our new short triggers have activated, and the market is continuing its downward movement.
⏳ 1-Hour Timeframe
After Bitcoin made a fake downward move yesterday, today it formed a lower high below 93,555, and after breaking the 90

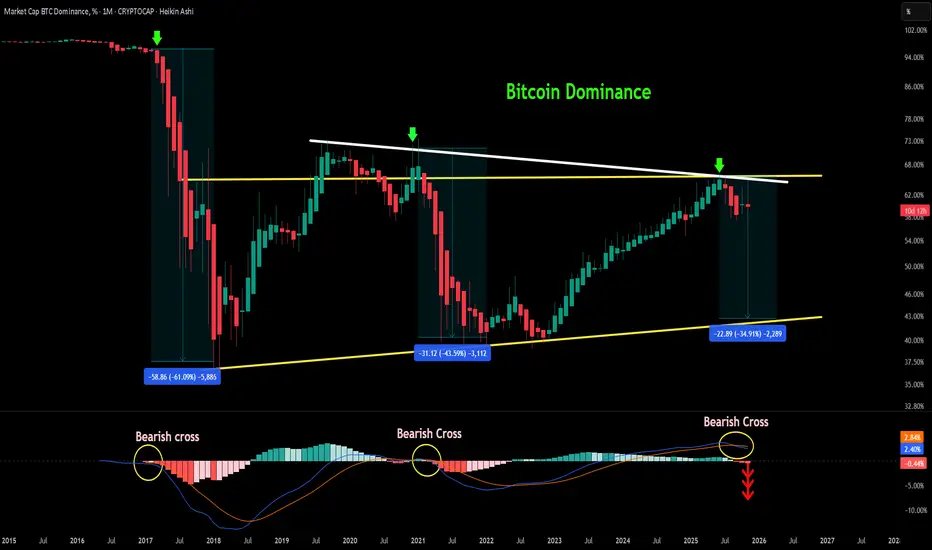
Bitcoin Dominance (1M) a multi-year structural pattern with MACD1️⃣ Macro Structure: Lower Highs + Ascending Support
Bitcoin Dominance has been forming:
✔ Descending trendline of lower highs (2017 → 2021 → 2025)
✔ Rising major support (long-term uptrend on lows)
This creates a large symmetrical wedge structure. Each time price hits the upper resistance, a str
BTCUSD Next Buying Move AnalysisPrice is sitting inside a strong demand zone.
If BTC breaks below this support, more downside can open.
But if it holds, expect a pullback toward the mid-resistance zone, and only a break above that can target the upper resistance.
Focus Levels
Support: Current lower pink zone
Resistance: Mid-zon

BTCUSD Short: Descending Channel Targets $89,000 Demand ZoneHello traders! BTCUSD continues to trade within a clear descending channel, maintaining a strong bearish structure characterized by consecutive lower highs and lower lows. The price action repeatedly respected the channel boundaries, confirming solid seller control throughout the recent decline. Eac

BTC near term Road Map around the Golden Genesis fib at 85.3kThis is a near term followup to my big picture posted below.
We are approaching a MAJOR Landmark in Bitcoin's lifetime.
"Golden Genesis" fibs are the highest gravity objects in this universe.
What happens here will determine the remaining life of this cycle (or end).
$ 85,354.35 is the Golden Gene

Ethereum Slides Deeper as Price Moves Toward 2,750 SupportHello everyone, Ethereum is facing a rather uncomfortable decline after its attempt to recover from the 3,000 USD region failed completely. The price is now hovering around 2,790 USD — the lowest level in over 10 days — and is trading firmly below the Ichimoku cloud, a familiar signal that sellers

See all crypto ideas
XAUUSDHello Traders! 👋
What are your thoughts on GOLD?
Gold reached the resistance zone and the upper boundary of the descending channel, but failed to break above it and was strongly rejected.
This reaction indicates that selling pressure remains dominant in this area.
The ongoing downward correction is

Lingrid | GOLD Possible Long Opportunity At Channel FloorOANDA:XAUUSD perfectly played out in my previous idea. Price is pulling back toward the key 4,000 support zone after failing to hold above the mid-range level near 4,130, where sellers re-entered the market. The structure still respects the ascending trendline, forming a sequence of higher lows tha

Gold 30-Min — Volume Sell Reversal Triggered⚡Base : Hanzo Trading Alpha Algorithm
The algorithm calculates volatility displacement vs liquidity recovery, identifying where probability meets imbalance.
It trades only where precision, volume, and manipulation intersect —only logic.
✈️ Technical Reasons
/ Direction — SHORT / Reversal 4081 Area

GOLD → Waiting for NFP... High importance level!FX:XAUUSD is stagnating ahead of the news. The market is in a phase of uncertainty, with long shadows and short candlestick bodies. The key factor will be the US employment data for September.
We have not seen unemployment data for more than seven weeks, which makes this data highly significan

Bias Still Bearish, But Confirmation Below 4050 Is Needed1. What Happened Yesterday
Gold continued to trade inside the well-defined 4050–4100 range discussed in the previous analysis.
Aside from a few small spikes, price respected the boundaries perfectly, confirming this as the current “decision zone” for the market.
2. Current Market Context
My outl

Is Gold About to Fall? Strong USD Pressures XAUUSD DownThe gold market is entering a sensitive phase as buying momentum gradually weakens, while the USD strengthens again following a series of positive economic releases . There is a sense of “calm before the storm”, and XAUUSD is now tilting toward a bearish direction.
U.S. data shows a clear reco

XAUUSD: Price Holds Triangle Support, Aiming for $4,120Hello everyone, here is my breakdown of the current Gold setup.
Market Analysis
XAUUSD is trading within a broad symmetrical triangle structure, where price continues to respect both the Triangle Resistance Line and the Triangle Support Line. After a strong bullish rally inside the Upward Channel

If Nasdaq can crack the pressure line then...🔱 We have a Hagopian on the down-move. 🔱
Price was (so far) not able to reach the L-MLH of the red fork.
If buyers can eat through the pressure cheese, then the Long-Play is on.
Most often we see price breaking the pressure line and then coming back to it, scaring out the early longs, just to rus

XAU/USD | Gold Approaching Key Intraday Supply Zone! (READ)By analyzing the #Gold chart on the 4H timeframe, we can see that after dropping to 3998 dollars, price found strong demand and has now climbed back up to around 4050 dollars.
Keep an eye on the 4056–4064 zone for a potential SELL reaction, as this is a key supply area.
This analysis will be updated

Gold possible move Gold is currently bouncing from a rising trendline support around 4022–4040, indicating buyers are still active in this zone. If price holds above this support, we may see a bullish move toward the first resistance at 4089, followed by 4133. A breakout above these levels can push price toward the up

See all futures ideas
CAD/JPY – Wedge Breakout Pattern (21.11.2025)📝 Setup Overview OANDA:CADJPY
CAD/JPY has broken below a rising wedge structure, signaling weakening bullish momentum. After multiple rejections at the resistance zone, price is now losing steam below the Ichimoku cloud, showing early bearish pressure.A clean breakout + retest scenario opens the

USDCHF I Daily CLS I Model 1 I Key Level - OBHi friends, new range created. As always we are looking for the manipulation in to the key level around the range. Don't forget confirmation switch from manipulation phase to the distribution phase to make the setup valid. Stay patient and enter only after change in order flow. If price reaches 50%

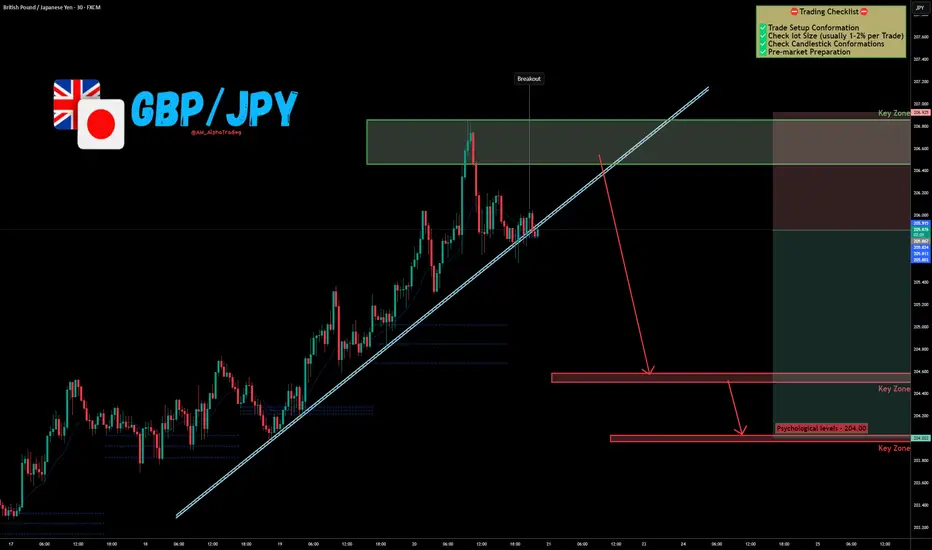
GBP/JPY Rejection at Supply → Next Stop: 204.00 !The GBP/JPY Pair, Price has been trading within a Trendline Breakout on the M30 chart, forming consistent lower highs and lower lows. Price action is now testing the lower boundary of the pattern, signalling a possible breakdown.
✅Market Context:
1️⃣Downward structure building inside the pattern
EURUSD Weakens at Resistance — Pullback Toward 1.1480 ExpectedHello traders! Let’s break down the current EURUSD structure. EURUSD continues to trade inside a broad descending channel, where both the resistance and support lines have been respected multiple times, forming a steady sequence of lower highs and lower lows. Each touch of the upper boundary resulte

USDJPY 30-Min — Volume Buy Reversal Triggered⚡Base : Hanzo Trading Alpha Algorithm
The algorithm calculates volatility displacement vs liquidity recovery, identifying where probability meets imbalance.
It trades only where precision, volume, and manipulation intersect —only logic.
✈️ Technical Reasons
/ Direction — LONG / Reversal 156.800 : 1

NZDJPY Poised To Start a Bearish Wave- BOJ Verbal InterventionNZDJPY Poised To Start a Bearish Wave- BOJ Verbal Intervention
NZDJPY completed a bearish harmonic pattern at 88.50
Price has already reacted and chances are for a short-term bearish move.
Despite this, the bearish pattern is clear, this move today is more attributed to the Japanese government’s

EURUSD is preparing for a major reversal counterattack?There are phases when the market drops so deeply that everyone believes the downtrend is already sealed. Yet right in the quietest moments, buying pressure begins to accumulate the strongest. EURUSD is now sitting precisely at that “compression point”.
The latest economic data shows a clearly wea

21.11.25 Morning ForecastPairs on Watch -
FX:AUDUSD
FX:EURUSD
FX:CADJPY
FX:GBPJPY
A short overview of the instruments I am looking at for today, multi-timeframe analysis down to what I will be looking at for an entry. Enjoy!

USD/JPYUSD/JPY Is The Best Pair For Volatility And Today We Find Ourselves At NonFarm Payrolls With The Possibility Of Previous Data Being Realeased That Was Hiden From The Goverment Shutdown..
We Find Ourselves In A 4H Fvg And A Break Of Structure On The 30m Timeframe Has Just A#Occured At London Open. I

NZDUSD → The hunt for liquidity. Bearish trend...FX:NZDUSD is forming a correction towards consolidation after updating its global minimum. Bears may play aggressively against the backdrop of a strong dollar.
The dollar is quite strong after Thursday's news. After retesting resistance, the index is not falling, but is gathering strength and

See all forex ideas
| - | - | - | - | - | - | - | ||
| - | - | - | - | - | - | - | ||
| - | - | - | - | - | - | - | ||
| - | - | - | - | - | - | - | ||
| - | - | - | - | - | - | - | ||
| - | - | - | - | - | - | - | ||
| - | - | - | - | - | - | - | ||
| - | - | - | - | - | - | - |
Trade directly on the supercharts through our supported, fully-verified and user-reviewed brokers.


