Stocks Stage Comeback in Time for Thanksgiving. What's Behind ItIt’s Thanksgiving, and you know what that means. “Hey, sweety, why don't you come here and let us know how your high-beta stocks are doing. Here’s our little investor.”
And for once, the answer isn’t followed by a sigh. Stock traders are heading into the holiday with something they haven’t had in

Black Friday
The greatest deal of the year is here.Get it before the point of no return.

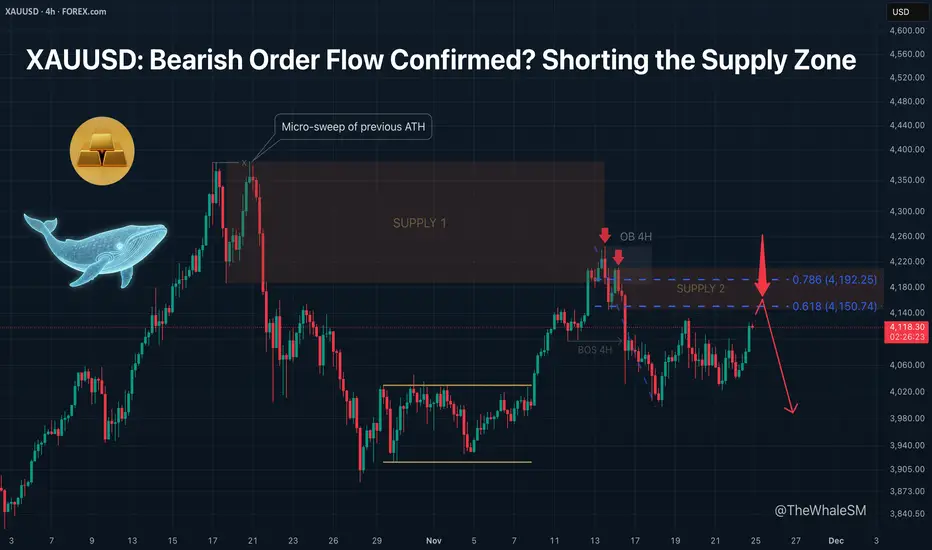
XAUUSD: Bearish Order Flow Confirmed? Shorting the Supply Zone.After updating the All-Time High (ATH), Gold performed a micro-sweep of liquidity from the previous ATH. This move was engineered via a Supply Zone . Following the sweep, this zone was mitigated, initiating a bearish order flow that broke the 4H structure to the downside (BOS 4H).
After the struc
ETHUSD H1 | Bullish Bounce Off Key SupportMomentum: Bullish
Price is currently above the ichimoku cloud.
Buy entry: 2,867.08
- Pullback support
- 61.8% Fib retracement
- 100% Fib projection
Stop Loss: 2,777.16
- Overlap support
Take Profit: 2,972.69
- Swing high resistance
High Risk Investment Warning
Stratos Markets Limited (tradu.com

NZDUSD downtrend continuation below falling resistanceThe NZDUSD currency pair continues to display a bearish outlook, in line with the prevailing downward trend. Recent price action suggests a corrective pullback, potentially setting up for another move lower if resistance holds.
Key Level: 0.5675
This zone, previously a consolidation area, now acts

PYPL USPayPal is a rare combination of value and growth.
The company demonstrates strong fundamentals, is strategically focused on the future, and trades at record-low multiples. The combination of financial discipline, capital return, and AI innovation makes it an attractive asset for long-term investor

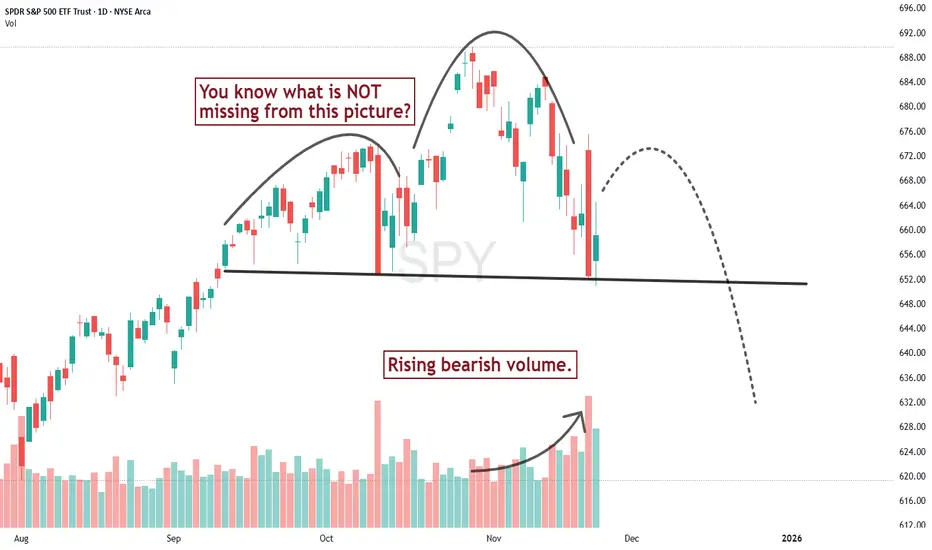
Oh what a difference a day makes!A couple days ago I thought there wasn't sufficient price pattern evidence to talk about a serious change in trend for the S&P 500, mostly because I didn't see the volume pattern confirming the downward slide of the recent high. But Thursday changed that. Redrawing the neckline, we get a chart that
Why This Time Is Not Different — BTC Could Still Drop >50%Bitcoin is moving into a phase where long-term cycles matter more than whatever the market narrative happens to be this week.
And if you look at those cycles, one thing becomes clear: BTC has never avoided a major drop after making a new ATH.
1. The timing keeps repeating — almost to the day
Every

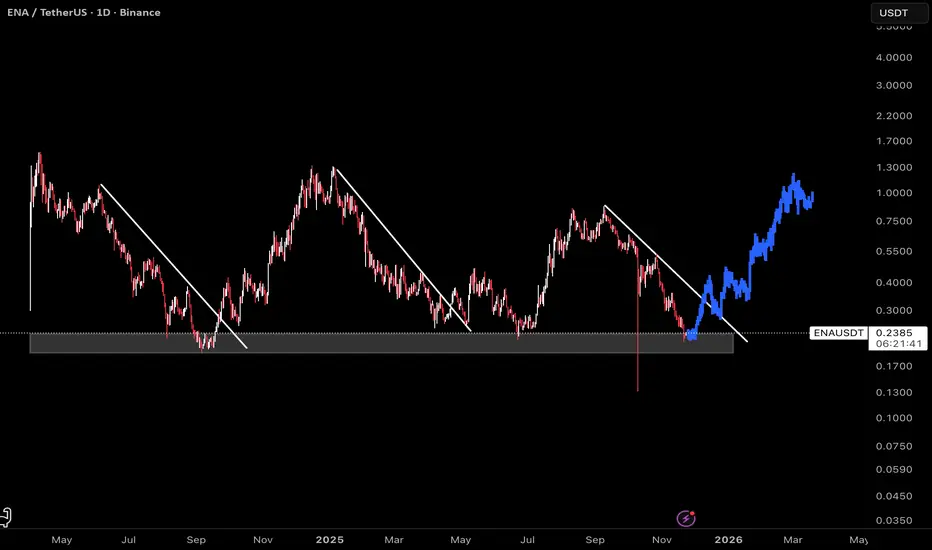
ENA: Bullish SetupThis chart displays ENA on a daily timeframe, with clear structure pointing to a favorable long entry. The current price action is trading within a major support zone, where previous trendline breaks have consistently marked the start of impulsive moves.
Historically, every time ENA breaks out abov
Analysis for What’s Coming - AI Bubble Sentiment The US markets have been described as “on a rally” for quite some time. I would not agree if it is meant to describe the overall US market, but would agree if it refers specifically to AI or tech stocks. Why?
Among the four major US indices, the Russell—representing a much broader base of US-listed

Nvidia Earnings Finally Ease Market Jitters. Are AI Bulls Back?It’s confirmed. This is Nvidia’s stock market and we all live in it.
Nvidia NASDAQ:NVDA reported yet another record-breaking quarter, instantly soothing market nerves after a week filled with talks of “AI bubble,” “valuation fever,” and “maybe Michael Burry is right again.” It was the cherry of t

See all editors' picks ideas
Count█ OVERVIEW
A library of functions for counting the number of times (frequency) that elements occur in an array or matrix.
█ USAGE
Import the Count library.
import joebaus/count/1 as c
Create an array or matrix that is a `float`, `int`, `string`, or `bool` type to count elements from, t

Holographic Market Microstructure | AlphaNattHolographic Market Microstructure | AlphaNatt
A multidimensional, holographically-rendered framework designed to expose the invisible forces shaping every candle — liquidity voids, smart money footprints, order flow imbalances, and structural evolution — in real time.
---
📘 Overview
The Hol

PriceFormatLibrary for automatically converting price values to formatted strings
matching the same format that TradingView uses to display open/high/low/close prices on the chart.
█ OVERVIEW
This library is intended for Pine Coders who are authors of scripts that display numbers onto a user's charts. T

LogNormalLibrary "LogNormal"
A collection of functions used to model skewed distributions as log-normal.
Prices are commonly modeled using log-normal distributions (ie. Black-Scholes) because they exhibit multiplicative changes with long tails; skewed exponential growth and high variance. This approach i

Range Oscillator (Zeiierman)█ Overview
Range Oscillator (Zeiierman) is a dynamic market oscillator designed to visualize how far the price is trading relative to its equilibrium range. Instead of relying on traditional overbought/oversold thresholds, it uses adaptive range detection and heatmap coloring to reveal where pri

Volume Surprise [LuxAlgo]The Volume Surprise tool displays the trading volume alongside the expected volume at that time, allowing users to spot unexpected trading activity on the chart easily.
The tool includes an extrapolation of the estimated volume for future periods, allowing forecasting future trading activity.
🔶 U

Smooth Theil-SenI wanted to build a Theil-Sen estimator that could run on more than one bar and produce smoother output than the standard implementation. Theil-Sen regression is a non-parametric method that calculates the median slope between all pairs of points in your dataset, which makes it extremely robust to o

Fair Value Gaps by DGTFair Value Gaps
A refined, multi-timeframe Fair Value Gap (FVG) detection tool that brings institutional imbalance zones to life directly on your chart.
Designed for precision, it visualizes how price delivers into inefficiencies across chart, higher, and lower (intrabar) timeframes — offering a fl

TASC 2025.11 The Points and Line Chart█ OVERVIEW
This script implements the Points and Line Chart described by Mohamed Ashraf Mahfouz and Mohamed Meregy in the November 2025 edition of the TASC Traders' Tips , "Efficient Display of Irregular Time Series”. This novel chart type interprets regular time series chart data to create an ir

Simplified Percentile ClusteringSimplified Percentile Clustering (SPC) is a clustering system for trend regime analysis.
Instead of relying on heavy iterative algorithms such as k-means, SPC takes a deterministic approach: it uses percentiles and running averages to form cluster centers directly from the data, producing smoo

See all indicators and strategies
Community trends
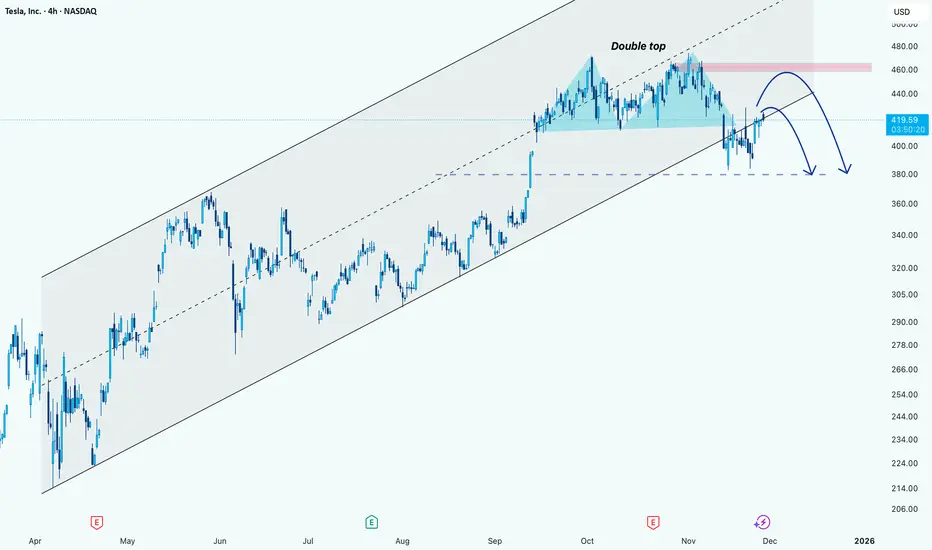
Tesla: A overview of itHi!
Trend Analysis:
TSLA has been trading in an ascending channel for several months, with higher highs and higher lows visible since April.
The recent price action broke above the midline of the channel but is currently consolidating near the $420-$425 area.
Pattern Formation:
A Double Top p
ttd almost time this is a quick update on ttd we have a solid support at a physiological 30.00 as soon as i see a reversal on the smaller time i will immediately update you note: after a rally of an incredible 6000% we now have been consolidating for nearly 2000 days it is now finally coming down to support at th

Micron Technology - The end will come soon!✂️Micron Technology ( NASDAQ:MU ) will create a top soon:
🔎Analysis summary:
Starting back in mid 2025, Micron Technology retested a major confluence of support. This retest was followed by an expected rally of about +250%. But soon, Micron Technology will create a short term top formation, f

NEBUIS BREAKOUT??The chart shows NBIS trading in a short-term uptrend, the trendline that has been tested multiple times, we are seeing consistent higher lows and strong buyer interest. Price is currently pushing into a major resistance zone at the 200MA, which has acted as a rejection point in the past. There are t

ORCL QuantSignals V3: Market Watching – Awaiting Breakout!ORCL QuantSignals Katy 1M Prediction 2025-11-26
Direction: (Neutral)
Current Price: $205.07
Final Prediction: $205.38 (+0.15%)
30min Target: $205.76 (+0.34%)
Trend: Neutral
Confidence: 40.0%
Volatility: 48.9%
Trade Signal Generated: ❌ None (insufficient confidence/move size)
Summary:
Katy AI predi

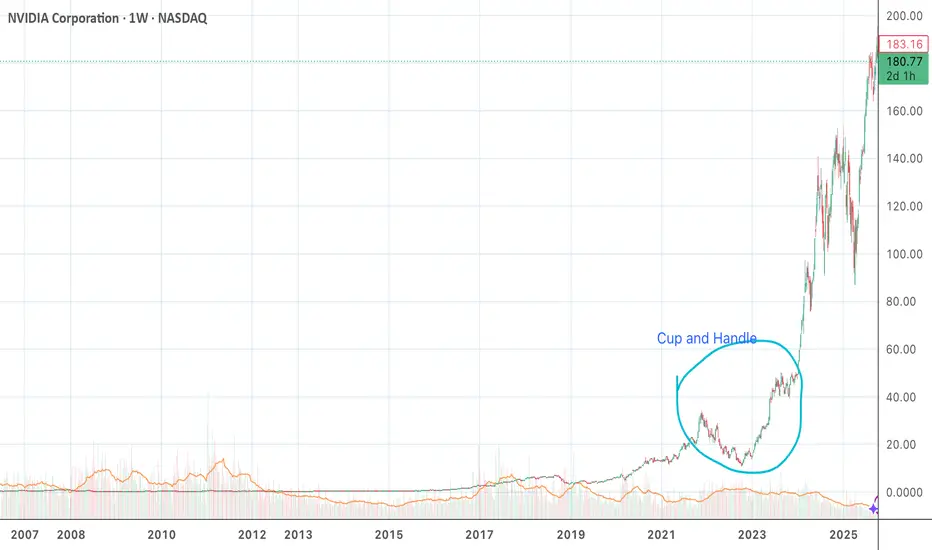
NVIDIA Cup and HandleThe cup and handle is a bullish continuation pattern in technical analysis that signals a potential uptrend after a period of consolidation.
It consists of two parts: a rounded, "U-shaped" cup, and a smaller, downward-sloping handle that forms on the right side of the cup.
Traders look for a bre
BJ vs. SPY BJ down 6 months in a row and finding consolidation around $90. The inverse H&S on the ratio between BJ and the benchmark S&P shows that this weakness could be fading. Watching the weekly chart of BJ, I am looking for a closing price above the consolidated range with a price target of $100.

Coca-Cola Is Attacking All-Time HighsCoca-Cola is basically one of the most famous drink brands in the world. It started in the late 1800s in the U.S., and over time it turned into a huge global company. They’re known for their classic Coke, but they also make tons of other drinks—juices, waters, teas, and even energy drinks.
After th

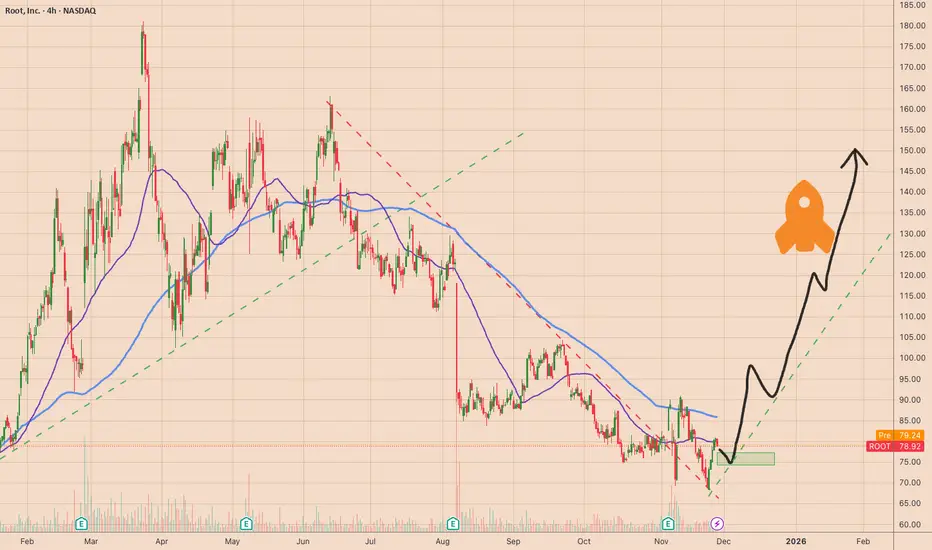
ROOT AI powered Insurance company BREAKOUT!2025 has seen explosive gains in companies building AI infrastructure — data centers, chips, and networking. But the next wave of opportunity may lie in the industries that unlock real productivity and profit improvements from adopting AI.
Insurance is a prime example. Historically, insurers have b
MSTR still bullish. MSTR bullishness is still intact but it should close above the upper yellow line for the bullishness confirmation intact. If that happens then there's a big possibility that we will see a big sharp last parabolic run to new ATH. Of course this is not financial advised.
If this failed then the la

See all stocks ideas
Today
SPIRSpire Global, Inc.
Actual
—
Estimate
−0.33
USD
Today
BTCTBTC Digital Ltd.
Actual
—
Estimate
−0.04
USD
Today
KNDIKandi Technologies Group, Inc.
Actual
—
Estimate
0.02
USD
Today
RILYB. Riley Financial, Inc.
Actual
—
Estimate
—
Today
NRSNNeuroSense Therapeutics Ltd.
Actual
—
Estimate
−0.04
USD
Today
IMPPImperial Petroleum Inc.
Actual
—
Estimate
0.10
USD
Today
SRXHSRX Health Solutions, Inc.
Actual
—
Estimate
—
Today
ALTSALT5 Sigma Corporation
Actual
—
Estimate
−0.36
USD
See more events
Dec 1
PPHCPublic Policy Holding Co. Inc.
Exchange
NASDAQ
Offer price
—
Dec 1
AIGOAigo Holding Ltd.
Exchange
NASDAQ
Offer price
4.00 - 6.00
USD
Dec 1
DTDTDt House Ltd.
Exchange
NASDAQ
Offer price
4.00 - 5.00
USD
Dec 1
E
ELCGELC Group Holdings Ltd.
Exchange
NASDAQ
Offer price
4.00 - 6.00
USD
Dec 1
HWEPHW ELECTRO Co. Ltd.
Exchange
NASDAQ
Offer price
—
Dec 5
R
RGNTRegentis Biomaterials Ltd.
Exchange
AMEX
Offer price
10.00 - 12.00
USD
See more events
Community trends
BTCUSD: Buyers Preparing for a Move Toward $90,000Hello everyone, here is my breakdown of the current Bitcoin setup.
Market Analysis
BTCUSD continues to recover after a prolonged downtrend, where the market consistently respected the descending Trend Line and formed a series of Range structures. Each range acted as a consolidation phase inside t

Bitcoin - 66k in 2026 (but first a pump - watch this!)Bitcoin has been going down drastically, as I expected many, many weeks in advance. But this is not the end of the crash! We will see lower prices in 2026, specifically 66k and possibly 50k later in Q3 2026. This is my long-term vision, but in the short term I think Bitcoin should go up to retest th

Bitcoin - Can the bulls break resistance?Bitcoin continues to stagnate after a strong sell-off. Market structure remains weak, and trading volume is declining as price keeps moving sideways within a tight range. Traders are uncertain about the next move, and both bulls and bears currently lack conviction. Overall sentiment is cool, with mo

SOLUSDT Holds Support – Eyes on 148–150 ZoneLooking at the H4 chart, SOL has just broken above the green FVG cluster at 136–140 and is now holding above it, turning this area into new support. Multiple H4 candles closing above 140 indicate selling pressure below has weakened, and buyers are accepting higher prices.
The lower Ichimoku cloud i

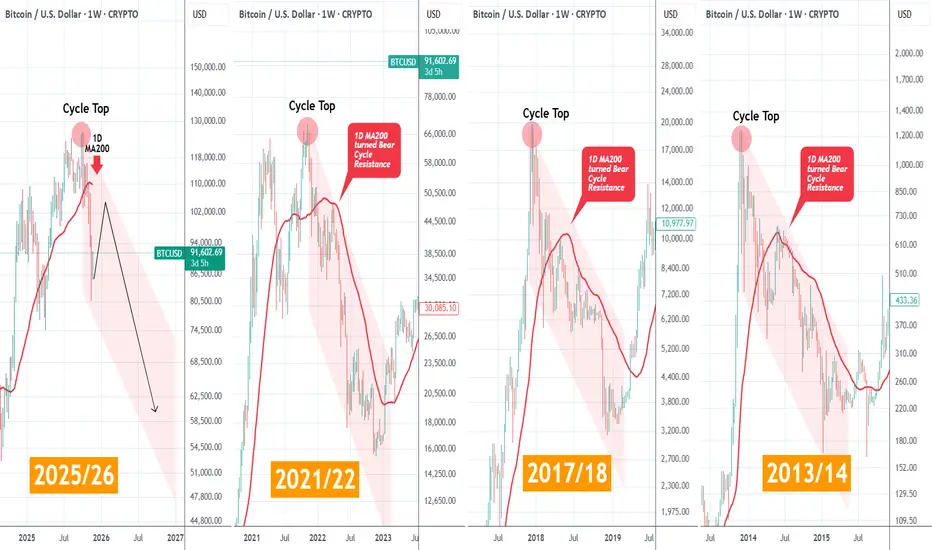
BITCOIN ! HAPPY THANKSGIVING ! Does the 1D MA200 spoil the mood?First of all allow me to wish everyone Happy Thanksgiving with all the blessings this day may bring to your family and loved ones.
As for Bitcoin (BTCUSD), the anticipated short-term rebound is targeting the first Lower High of the emerging Bear Cycle. What's critical in this? The 1D MA200 (red tre
Bitcoin: Final Pump Before the Fall?Over the past five to six days, Bitcoin ( BINANCE:BTCUSDT ) has been attempting to recover from previous weekly declines, and it still appears to be in a corrective phase. This analysis builds on my previous idea, and if you’d like a deeper look at Bitcoin’s mid-term chart, you can check out the 4

Bitcoin recovers rise again moveBitcoin is showing signs of bullish consolidation after a prolonged decline into key support. Based on the current range structure, the market may be preparing for an upward move.
The recovery aligns with broader market sentiment, as U.S. stock indices recorded their fourth consecutive session of g

BTCUSD It is Inevitable...I hate to say it… but this chart is giving me flashbacks.
When you zoom out on BTC’s weekly structure, you see similarities between 2021 and what’s happening right now in 2025. This doesn't look good to me.
After the double-top formation in 2021, we got a relief rally that tricked everyone into th

BITCOIN → Retest of the 94,000 zone of interest...BINANCE:BTCUSDT.P is rebounding from its interim low of 80,000. However, it is still too early to talk about a bull market, as a countertrend correction is forming under the current circumstances.
Globally, Bitcoin is in a downtrend, with the zone of interest for a countertrend correction bein

ZECUSDT at least 650$ soon will hit againAs observed on the chart, ZECUSDT is demonstrating renewed strength near the $500 support level, suggesting a potential corrective rebound toward the $650 resistance zone. However, this level represents a significant technical barrier where historical selling pressure has emerged.
A decisive breako

See all crypto ideas
Gold Buyers Regain Momentum — Aiming for 4,240 RetestHello traders! Let’s break down the current XAUUSD structure. Gold is trading within a broad ascending structure after forming a strong local bottom around the Support Line, where buyers entered the market and started to push the price higher. This upward movement follows a long corrective phase, du

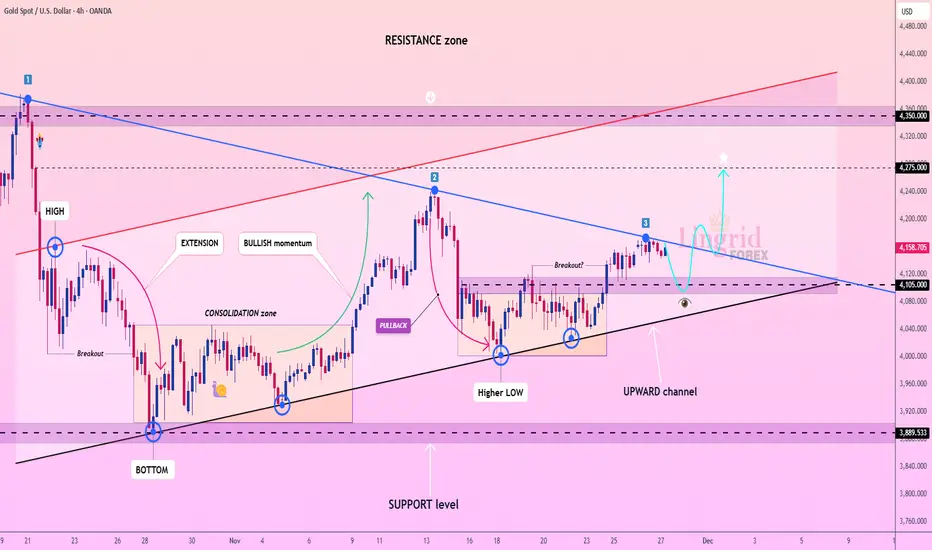
Lingrid | GOLD Trendline Break - Price AccelerationOANDA:XAUUSD is testing the downward trendline for the third touch, a historically significant point where price often attempts a breakout. The market structure has been steadily building higher lows from the 3,900 support level, while buyers continue to defend the bottom of the upward channel. Cur
Gold - This is the bullrun top!⚰️Gold ( OANDA:XAUUSD ) is slowly reversing now:
🔎Analysis summary:
Starting back in the end of 2015, Gold established another major bullish cycle. Ever since the rounding bottom breakout, Gold has been rallying higher and higher. But at this exact moment, Gold retests major resistance and is

XAUUSD: Gold Continues to Rise on Rate Cut ExpectationsGold continues its upward trend from yesterday, with the current price at 4,159.455 USD. The chart shows that gold is moving within a stable upward channel, and if it maintains above this support level, there is a high likelihood that the price will continue towards the 4,190,000 USD level.
Why is

GOLD → Distribution phase. Focus on 4150...FX:XAUUSD is trading at a one-and-a-half-week high, supported by a weaker dollar and growing expectations of Fed policy easing. More news ahead...
US PPI inflation showed signs of slowing (2.7% y/y). Retail sales and consumer confidence were weaker than expected. The probability of a Fed rate

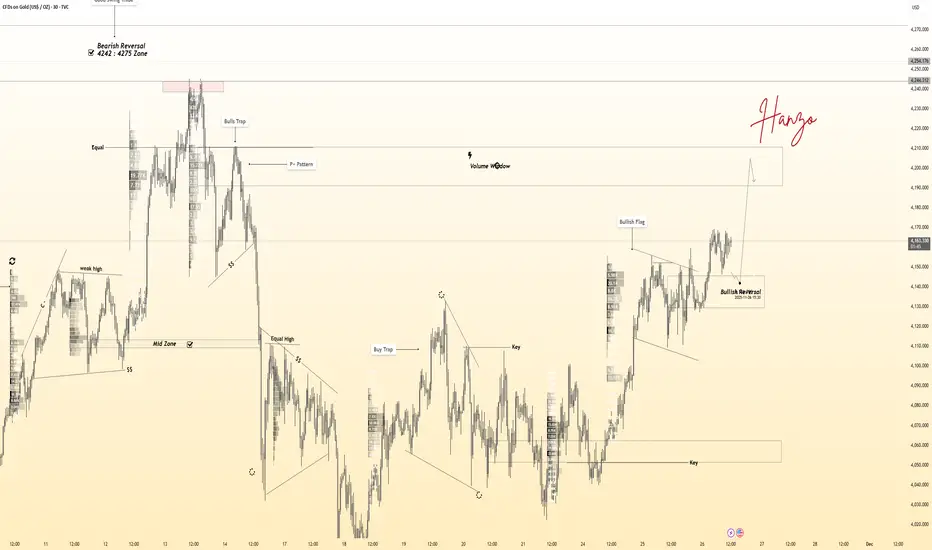
Gold 30-Min — Volume Buy Reversal Triggered⚡Base : Hanzo Trading Alpha Algorithm
The algorithm calculates volatility displacement vs liquidity recovery, identifying where probability meets imbalance.
It trades only where precision, volume, and manipulation intersect —only logic.
Technical Reasons
/ Direction — LONG / Reversal 4147 Area
☄️B
Countdown Begins — Nifty Setting Up a Precise Time Blast🔥 Time & Price Analysis — The Market Has Spoken 🔥
Strategy: Buy on Dips
CMP: 26,338
Target 1: 26,405
Target 2: 26,490
Stop Loss: Below 26,290
Time Window: Move expected by 10.50 am on 28th November
When Time and Price come together, doubt disappears.
Nifty is aligning perfectly with my cycle wind

GOLD WEEKLY CHART MID/LONG TERM ROUTE MAPHey everyone,
Please see our weekly chart timeframe Routemap and Trading plans for the week ahead.
After securing 4059 last week, we now have a long range candle body close gap above at 4294, with 4059 acting as support. We can expect price action to play between these two levels. A further EMA5 c

XAUUSD (Gold) Next Buying Move Analysis Read the CaptionPrice is reacting from the rising trendline after retesting the support zone. If the current bullish push fails to break above the previous high, gold may pull back toward the support level around the purple zone before any next move.
A break below that zone can open room for deeper correction.
Ple

XAUUSDHello Traders! 👋
What are your thoughts on GOLD?
Gold corrected upward as expected, reaching the top of the descending channel and the resistance zone, where it showed a clear price rejection.
In this region, gold is expected to show some consolidation and liquidity buildup, followed by a renewed

See all futures ideas
GBP/CAD - H1 - UK Budget Boosts!📝 Description & Technical Setup FX:GBPCAD
GBP/CAD is trading inside a strong Ascending Broadening Wedge, showing bullish momentum with higher highs & higher lows.Price is currently holding above the trendline and Ichimoku support, indicating continued upward strength.
We expect a bullish contin

EURUSDHello Traders! 👋
What are your thoughts on EURUSD?
EUR/USD has broken its descending trendline and has now completed a clean pullback to the broken level. In this zone, we expect the pair to consolidate briefly and then move toward the identified resistance area.
A confirmed breakout above this res

GBPUSD Daily CLS Model 1 - 50% TPHi friends, new range created. As always we are looking for the manipulation in to the key level around the range. Don't forget confirmation switch from manipulation phase to the distribution phase to make the setup valid. Stay patient and enter only after change in order flow. If price reaches 50%

GBP/USD | Pound Hit All Targets and Looks Ready for Another DropBy analyzing the GBPUSD chart on the 2 hour timeframe, we can see that price moved exactly as expected. It dropped more than 120 pips to 1.30380, then bounced and climbed back into the second supply zone we marked. From that zone, GBPUSD immediately reacted with a 30 pip drop, showing the strong imp

USDJPY -30Min — Volume Sell Reversal Triggered⚡Base : Hanzo Trading Alpha Algorithm
The algorithm calculates volatility displacement vs liquidity recovery, identifying where probability meets imbalance.
It trades only where precision, volume, and manipulation intersect —only logic.
✈️ Technical Reasons
/ Direction — SHORT / Reversal 4191 Area

GBP/JPY: Breakout & Important Demand ZoneThe GBPJPY has violated a significant horizontal support level, and closed above it.
This previously broken structure, combined with a rising trend line, now forms a notable demand zone.
I intend to consider buying in this area, anticipating an upward movement towards the 207.70 level.


GBPCAD Could continue HigherPrice was coming from a strong downtrend and eventually, the momentum faded and price began to base out.
Price then pushed straight into the neckline again and this time it broke, a clean breakout!
After that, price pulled back and that’s exactly what we want to see if we’re expecting continuation

USDJPY Next Analysis Move USDJPY Buy Setup
Price has bounced strongly from the channel’s lower boundary, showing clear bullish momentum. As long as price holds above the recent rejection zone, bulls remain in control.
Target: 157.00 zone
Structure: Breakout from descending channel + bullish continuation pattern
Bias: Bu

NZDUSD - Trio Rejection… Now Waiting for the Retest!📈NZDUSD has just rejected a strong TRIO retest zone , marked by the blue circle — the intersection of the demand zone, the falling channel support, and the oversold lower trendline. This confluence has already generated a strong bullish reaction.
⚔️Now, after the initial bounce, we will be waitin

See all forex ideas
| - | - | - | - | - | - | - | ||
| - | - | - | - | - | - | - | ||
| - | - | - | - | - | - | - | ||
| - | - | - | - | - | - | - | ||
| - | - | - | - | - | - | - | ||
| - | - | - | - | - | - | - | ||
| - | - | - | - | - | - | - | ||
| - | - | - | - | - | - | - |
Trade directly on the supercharts through our supported, fully-verified and user-reviewed brokers.


