Tesla Stock Wobbles as Profit Dives 37%, Revenue Pops. Now What?Tesla NASDAQ:TSLA posted a 12% jump in revenue on Wednesday, reaching $28.1 billion, well above Wall Street’s $26.37 billion estimate. And yet, the stock slipped nearly 1% on the day before paring back that loss with a 2.3% Thursday gain.
Why? Because profits fell faster than Cybertruck’s reput

The best trades require research, then commitment.
Get started for free$0 forever, no credit card needed

Scott "Kidd" PoteetThe unlikely astronaut

Where the world does markets
Join 100 million traders and investors taking the future into their own hands.

Gold 1979 vs 2025 — When History Whispers and Markets Listen
🌕 1. The Echo of 1979
In 1979, the world watched Gold do the impossible. The metal surged from $226 to over $850 per ounce in less than a year, a 275% explosion that turned fear into fortune.
The triggers were seismic.
🇮🇷 The Iranian Revolution disrupted global oil flows.
🏛️ The U.S. Embassy host

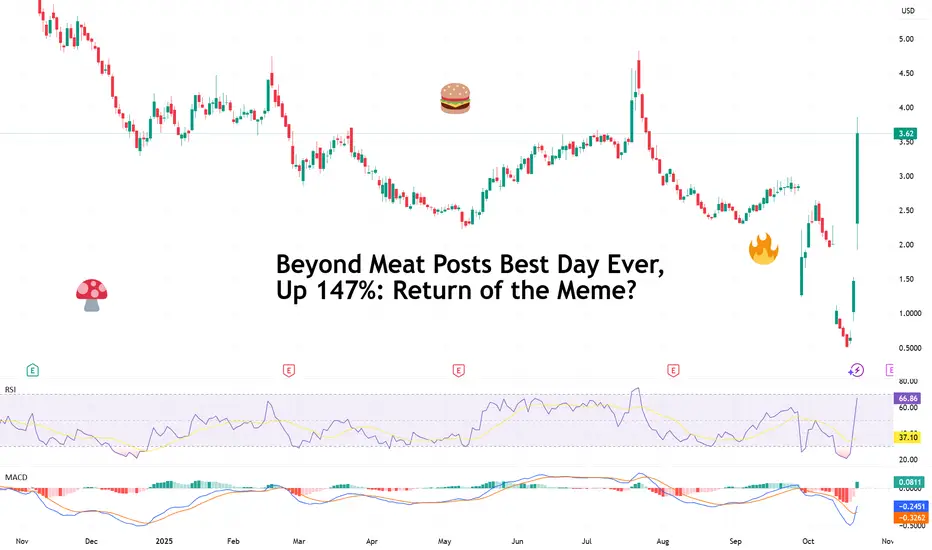
Beyond Meat Posts Best Day Ever, Up 147%: Return of the Meme?🔥 A Sizzling Comeback or Just Froth?
Beyond Meat NASDAQ:BYND , once the darling of the plant-based revolution and later the focus of every “overcooked IPO” joke, just got on everyone’s radar: a 147% single-day surge, its best performance ever.
For a company that was trading at just 65 cents las
Silver bull will try to throw you off, but long term healthyA pause that could refresh might be warranted in silver and gold.
I am still optimistic for precious metals long term.
Silver is still undervalued based on historical metrics and money supply.
I worry about the rise in metals and what it implies for the broad stock market indices.

Gold Analysis: Break Above $4,293 Could Trigger a New HighHi guys!
Gold has been moving inside a clear ascending channel, respecting both its upper and lower boundaries. Recently, we saw a double top formation near the upper trendline , which triggered a corrective move down to the $4,190–$4,200 support zone, an area that has already shown strong buying

Moment of Fate - BTC Analysis (3D)There are many reasons to go up but also going down is starting to look way more charming than ever right now.
Let's examine what we have;
-FED is about to cut rates for a second time but we'll most likely to see another rate cut in december which is bullish af.
-All companies are keeping buying
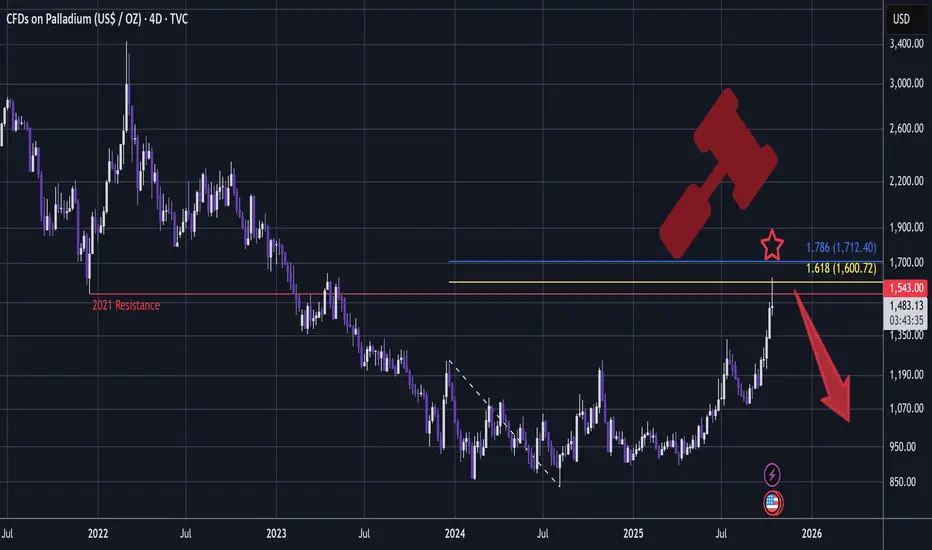
PALLADIUM - Short Setup, Bearish Rotation In MetalsA very bearish setup is developing:
Since the top, there is nowhere on the chart that has a whipsawing candle like this:
A very big Shooting Star!
This setup has my favourite conditions met:
- Whipsawing candle that sweeps liquidity through key resistance (2021)
- Tidy 1.618 Golden Window (1.6
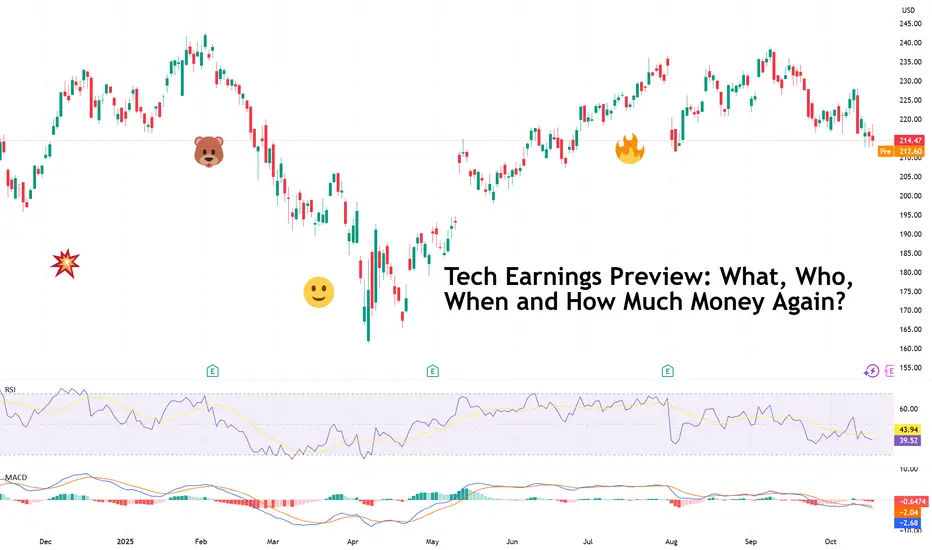
Tech Earnings Preview: What, Who, When and How Much Money Again?“ I don’t know, probably at least around $600 gazillion dollars ,” Zuck, probably if you asked him how much Meta NASDAQ:META will spend over the fiscal year.
It’s earnings season , which means Wall Street’s most expensive hobby — guessing how much the tech giants will make while pretending it’s
Tesla (TSLA) — Momentum Reload or Major Cooldown?The Next $400–$450 Decision Zone!
🧭 Weekly Chart — Big Picture Momentum
Tesla has printed one of the cleanest BOS (Break of Structure) patterns on the weekly timeframe since the post-2023 recovery, confirming that the macro downtrend has flipped into a sustained bullish expansion. The stock ripped

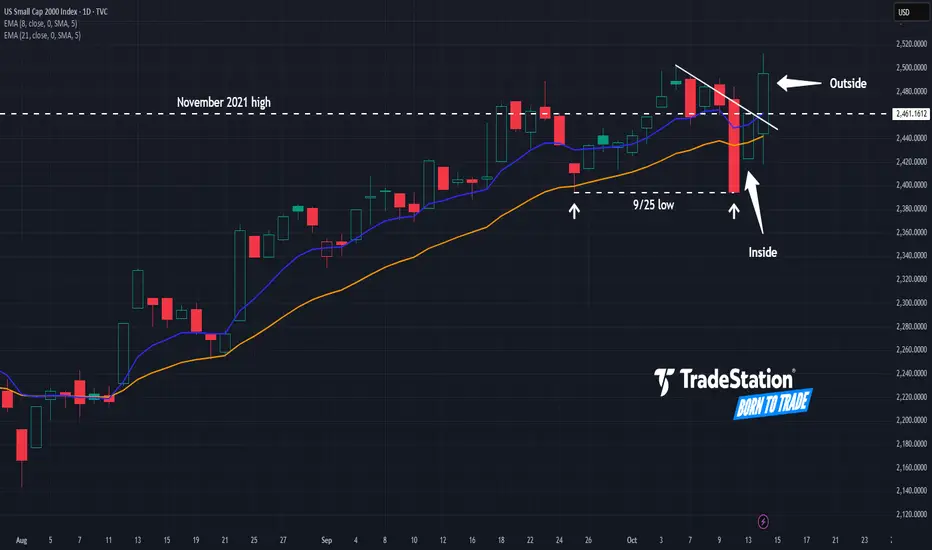
Small Caps: Finally a Breakout?The Russell 2000 has been stuck in a rut for years, but some traders may think the small-cap index has finally achieved escape velocity.
The first pattern on today’s chart is the November 2021 high around 2,460, where prices stalled last November. RUT has gotten above it this month and refused to s
See all editors' picks ideas
Fair Value Gaps by DGTFair Value Gaps
A refined, multi-timeframe Fair Value Gap (FVG) detection tool that brings institutional imbalance zones to life directly on your chart.
Designed for precision, it visualizes how price delivers into inefficiencies across chart, higher, and lower (intrabar) timeframes — offering a fl

TASC 2025.11 The Points and Line Chart█ OVERVIEW
This script implements the Points and Line Chart described by Mohamed Ashraf Mahfouz and Mohamed Meregy in the November 2025 edition of the TASC Traders' Tips , "Efficient Display of Irregular Time Series”. This novel chart type interprets regular time series chart data to create an ir

Simplified Percentile ClusteringSimplified Percentile Clustering (SPC) is a clustering system for trend regime analysis.
Instead of relying on heavy iterative algorithms such as k-means, SPC takes a deterministic approach: it uses percentiles and running averages to form cluster centers directly from the data, producing smoo

Adaptive Volume Delta Map---
📊 Adaptive Volume Delta Map (AVDM)
What is Adaptive Volume Delta Map (AVDM)?
The Adaptive Volume Delta Map (AVDM) is a smart, multi-timeframe indicator that visualizes buy and sell volume imbalances directly on the chart.
It adapts automatically to the best available data resolution

Dynamic Equity Allocation Model"Cash is Trash"? Not Always. Here's Why Science Beats Guesswork.
Every retail trader knows the frustration: you draw support and resistance lines, you spot patterns, you follow market gurus on social media—and still, when the next bear market hits, your portfolio bleeds red. Meanwhile, institution

First Passage Time - Distribution AnalysisThe First Passage Time (FPT) Distribution Analysis indicator is a sophisticated probabilistic tool that answers one of the most critical questions in trading: "How long will it take for price to reach my target, and what are the odds of getting there first?"
Unlike traditional technical indicators

PongExperience PONG! The classic arcade game, now on your charts!
With this indicator, you can finally achieve your lifelong dream of beating the Markets. . . at PONG!
Pong is jam-packed with features! Such as:
2 Paddles
A moving dot
Floating numbers
The idea of a net
This indicator is solel

Options Max Pain Calculator [BackQuant]Options Max Pain Calculator
A visualization tool that models option expiry dynamics by calculating "max pain" levels, displaying synthetic open interest curves, gamma exposure profiles, and pin-risk zones to help identify where market makers have the least payout exposure.
What is Max Pain?
Max

Volume Profile 3D (Zeiierman)█ Overview
Volume Profile 3D (Zeiierman) is a next-generation volume profile that renders market participation as a 3D-style profile directly on your chart. Instead of flat histograms, you get a depth-aware profile with parallax, gradient transparency, and bull/bear separation, so you can see w

RiskMetrics█ OVERVIEW
This library is a tool for Pine programmers that provides functions for calculating risk-adjusted performance metrics on periodic price returns. The calculations used by this library's functions closely mirror those the Broker Emulator uses to calculate strategy performance metrics (

See all indicators and strategies
Community trends
Tesla Stock Wobbles as Profit Dives 37%, Revenue Pops. Now What?Tesla NASDAQ:TSLA posted a 12% jump in revenue on Wednesday, reaching $28.1 billion, well above Wall Street’s $26.37 billion estimate. And yet, the stock slipped nearly 1% on the day before paring back that loss with a 2.3% Thursday gain.
Why? Because profits fell faster than Cybertruck’s reput
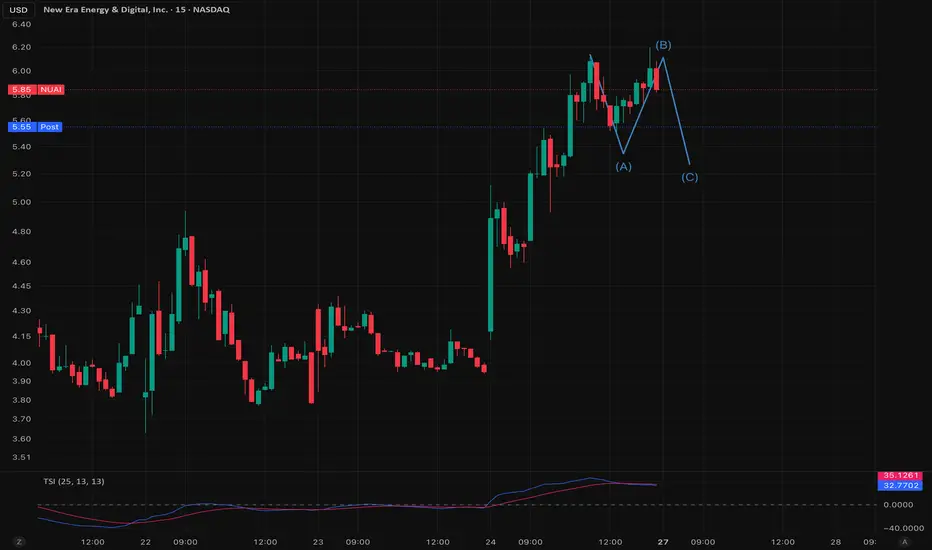
NUAI is in a corrective wave CReading this chart was tricky because the wave B looks just like a wave 1 so it's easy to misread it. The truth is that it's finishing wave C. What comes next will either be an extended correction or wave 1.
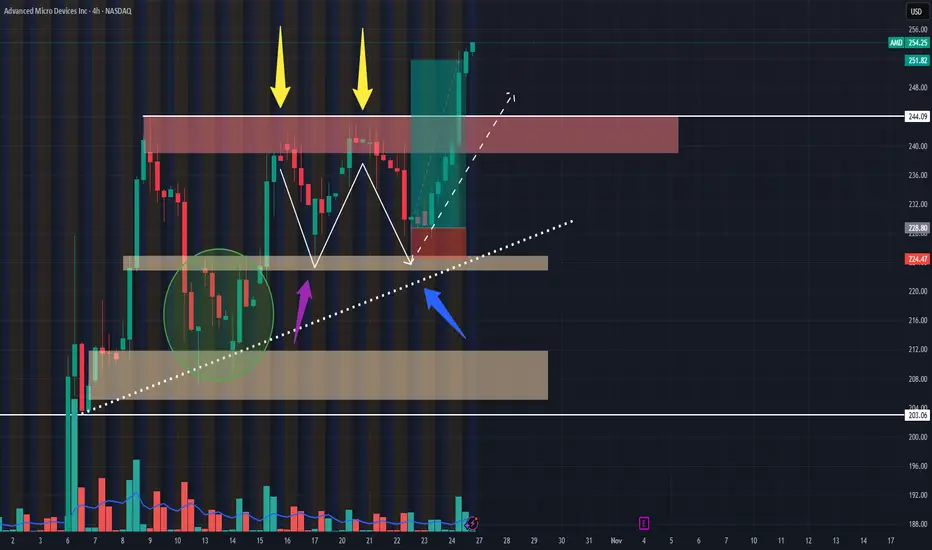
AMD Went Crazy!!! Post Trade Analysis 10/25/24Hello all,
This is my first time posting on here. So, please feel free to leave any questions, advice, or anything else in the comments!
I took this AMD swing trade on the 10/22/25 @ 2:12ish PM CST.
POSITION:
1 $300 Strike Call Exp Nov 7th 2025
Risk: $30 (price takes out low of hammer candle)
I
10X gainer penny stockNASDAQ:ASST Strive (ASST) is now sitting at a technical launching pad that could deliver explosive gains—potentially 10x returns, just like Beyond Meat (BYND) did in its early rally. The chart shows a massive long-term rectangle base pattern with recent volume surges and sharp price recoveries from

If BYND follows OPEN....Here is a time offset comparison of OPEN and BYND, matching up their first peaks. BYND has gaps to fill within this pathway.

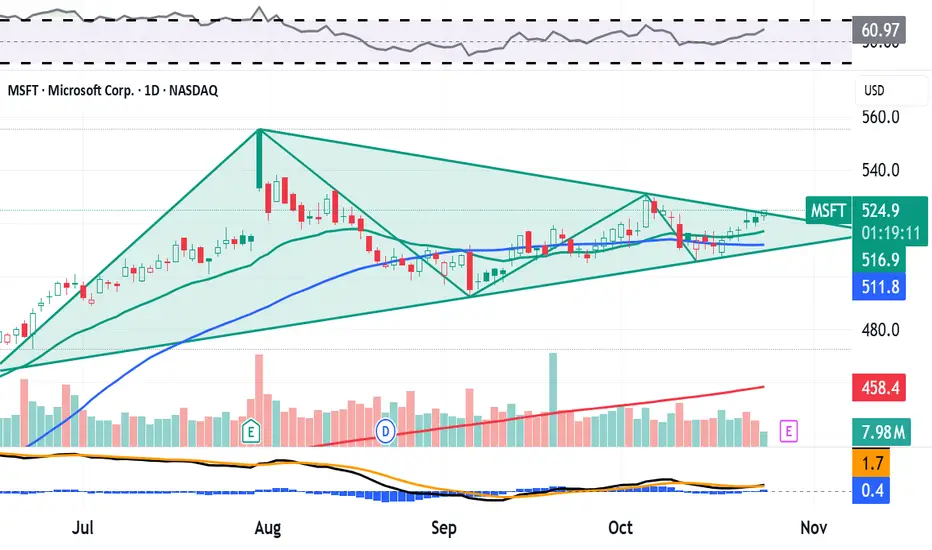
Here's What Microsoft's Chart Says Heading Into EarningsMicrosoft NASDAQ:MSFT , which will release earnings next week, is beating the S&P 500 SP:SPX year to date -- up 24.4% vs. about 15.7% for the SPX. MSFT has also gained roughly 112% over the past three years, while the S&P 500 has added just 78.9%. What does the company's chart show us ahead of e
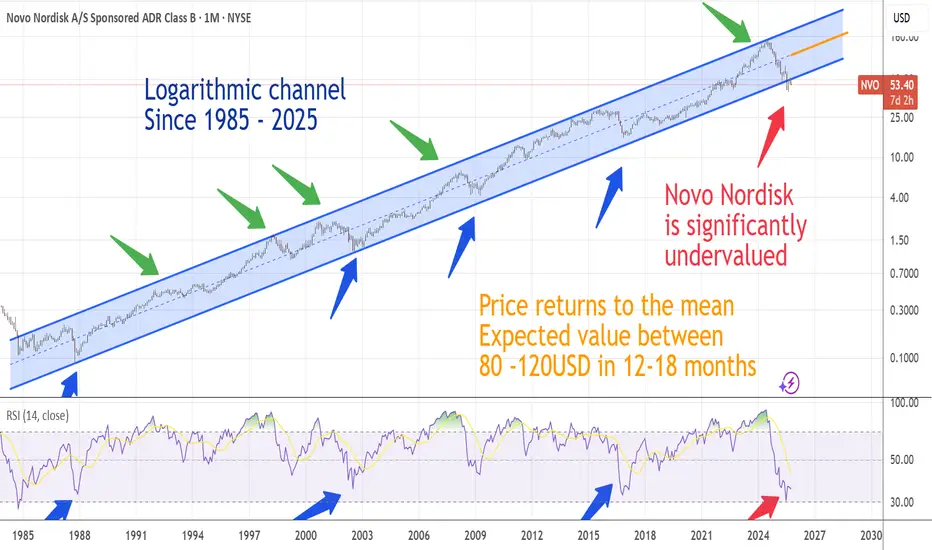
Price of Novo Nordisk follows a logarithmic channel since 1985According to the description on the plot. Expected price 80-120 USD in next 12-18 months.
UUU future breakoutI'm in 12,000+ shares. I will keep slowly buying more. Stock / company has been around forever. And I can see $10 in the future...

I held off as long as I could -- long at 34.72I have only so much willpower and only so much fear of market corrections. Both were exceeded today. I do not argue that this stock is overvalued based on its current business. I can make a case for its long term positive future (AI needs SOOOOOOO much energy while we apparently think it's a good

Wedge??Will the wedge follow through with a big bullish push to the upside. Minor resistance around $135 but long term hold will achieve much higher returns at a major resistance.

See all stocks ideas
Oct 27
RVTYRevvity, Inc.
Actual
—
Estimate
1.14
USD
Oct 27
BOHBank of Hawaii Corporation
Actual
—
Estimate
1.17
USD
Oct 27
LKFNLakeland Financial Corporation
Actual
—
Estimate
1.04
USD
Oct 27
BBTBeacon Financial Corporation
Actual
—
Estimate
0.68
USD
Oct 27
DSSDSS, Inc.
Actual
—
Estimate
—
Oct 27
JOESt. Joe Company (The)
Actual
—
Estimate
—
Oct 27
KVUEKenvue Inc.
Actual
—
Estimate
0.26
USD
Oct 27
LODEComstock Inc.
Actual
—
Estimate
−0.14
USD
See more events
Community trends
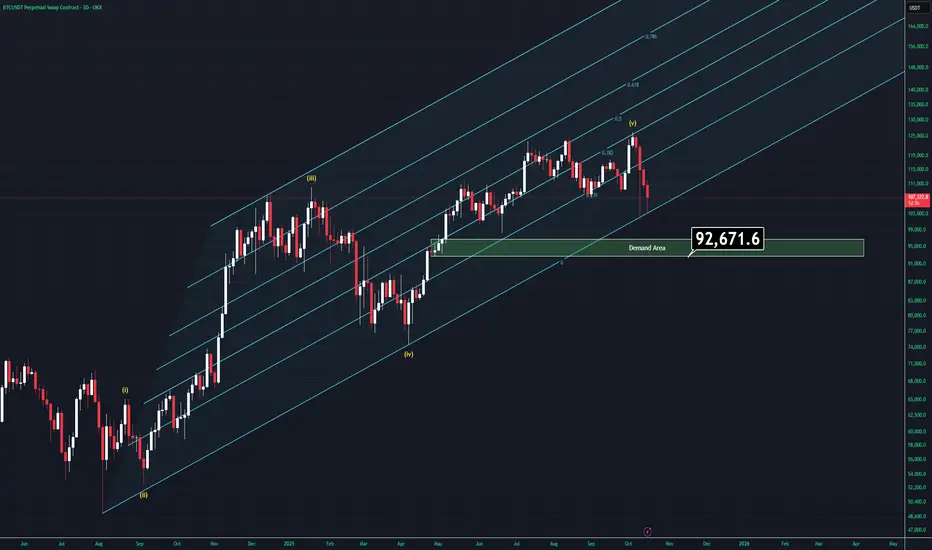
Bitcoin - Symmetrical triangle's target is 92,000 USD! Must seeBitcoin is forming a symmetrical triangle pattern, which in classic forex is a 50/50 bullish/bearish pattern. But here we do predictions, so I predict this pattern to break down! In this analysis, I will explain the reasons behind my prediction.
On Friday, October 10, we had the biggest crash in cr

BTC - Liquidity Dynamics leading to new HighsMarket Context
Bitcoin has shown a constructive reaction from the recent lows, printing a clean double bottom structure that suggests short-term demand entering the market. After a previous buy-side liquidity sweep and rejection, price has rebalanced and is now challenging a fair value gap (FVG) th

Ethereum - The realistic $15,000 target!🔥Ethereum ( CRYPTO:ETHUSD ) can still break out:
🔎Analysis summary:
Over the past four years, Ethereum has been trading in a massive bullish triangle pattern. And despite the recent all time high rejection, Ethereum can still follow its underlying bullrun. It just has to create the bullish tr

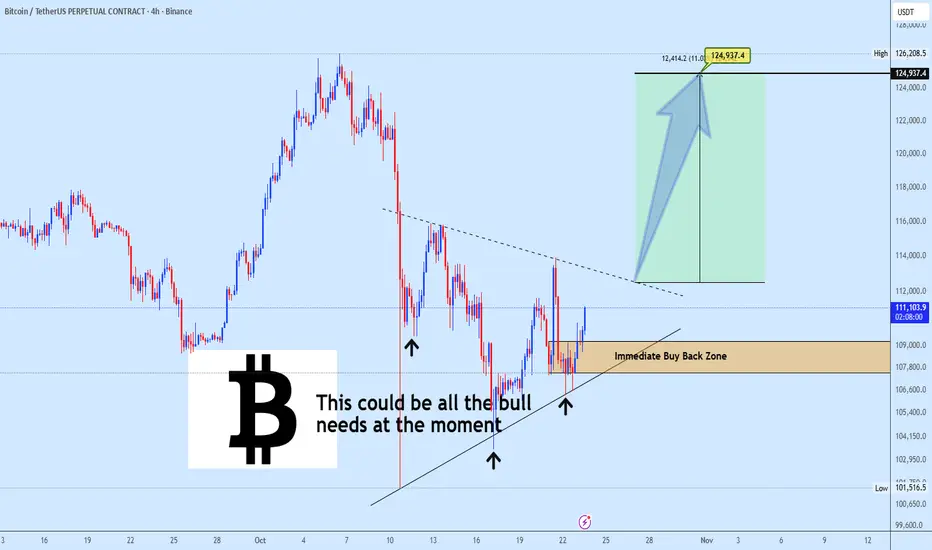
BITCOIN Update: ISHS Setup in Play! Bitcoin continues to respect the ascending structure with a potential Inverse Head & Shoulders forming along the Immediate Buy Back Zone (107k–109k).
The current bounce aligns perfectly with the neckline projection towards $124,937, which also sits near the previous resistance zone.
As long as pri
BTCUSD Short: Bearish Rotation Expected Toward 107,700Hello, traders! The prior market structure for BTCUSD shows a clear downward trend, structured between a strong supply zone around the 114,000 level and a demand zone near 104,000. Price action continues to respect these boundaries, forming a broad horizontal range after multiple breakouts and retes

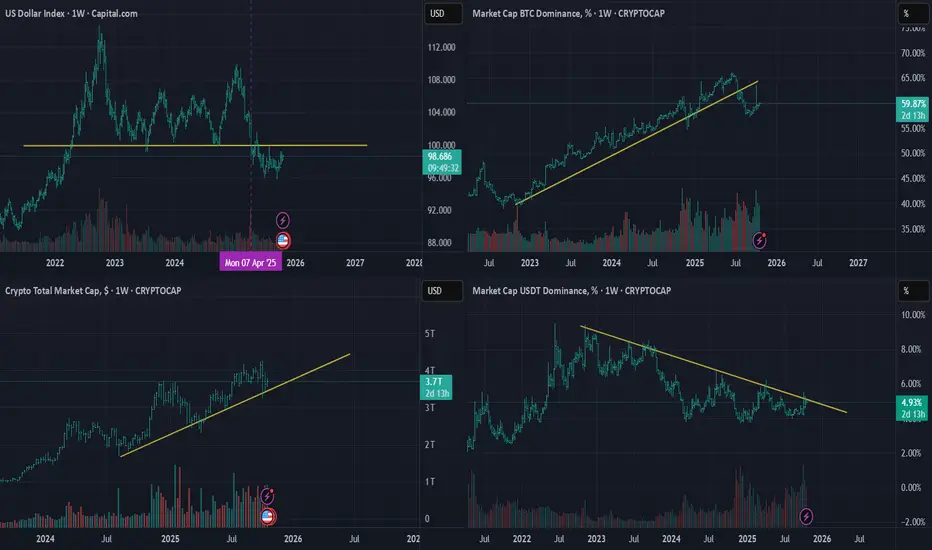
USD Index, BTC Domination, Crypto Total Market USDT Domination Hi everyone,
I just noticed a rare and exciting opportunity — the global market indexes are currently in sync in favor of altcoins.
All the charts are lining up perfectly, and to me, this looks like one of the best times to enter the market or add to your existing positions.
Wishing you all the bes
Bitcoin Forms Head and Shoulders — Correction 107,500 in PlayHello traders! I’d like to share my view on the current market structure for Bitcoin. After a prolonged period of bullish momentum and multiple impulsive rallies, the market has entered a corrective phase. The price action has formed a clear Head and Shoulders pattern beneath the major resistance zo

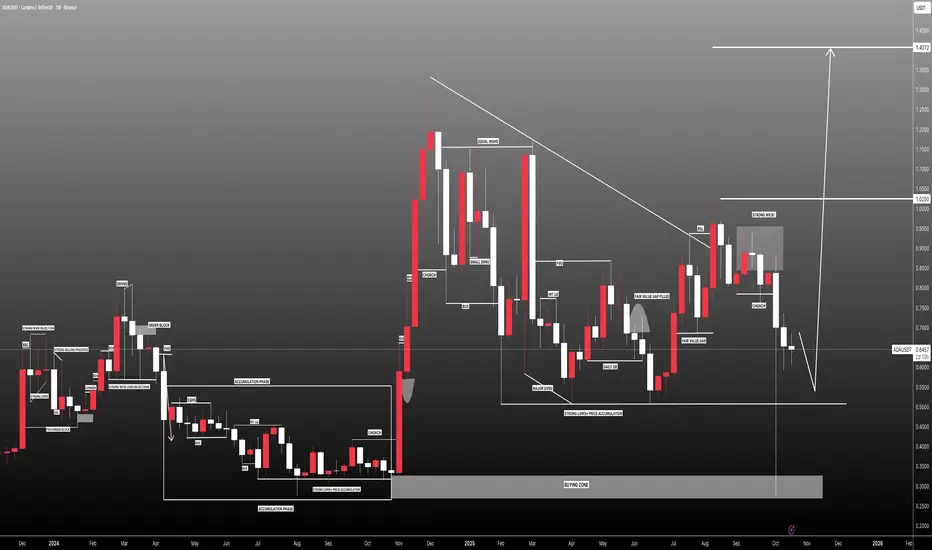
#ADAUSDT: Two Targets Both Possible, Let's See How Price MoveADAUSDT collapsed following the announcement of new tariffs on China, which caused fear in the cryptocurrency market and affected minor currency pairs. This led to a significant drop in the price of ADAUSDT. A minor decline may occur before the price reverses. There are two potential targets for the
ETHEREUM (ETH/USD): Support holds-Is the Rally Just Beginning?!There is a strong likelihood that 📈ETHEREUM will continue its bullish movement from an important daily horizontal support level.
As a confirmation of this outlook, I observe a confirmed bullish Change of Character (CHoCH) and a breakout from the resistance line of a falling wedge pattern.
I antici

TradeCityPro | CAKE: Range Squeeze, Breakout Imminent👋 Welcome to TradeCity Pro!
In this analysis, I want to review the CAKE coin, one of the DeFi projects active on the BNB network with a market cap of 916 million USD, ranked 74th on CoinMarketCap.
⏳ 1-Hour Timeframe
This coin is currently in a small range box on the 1-hour timeframe, and this tight

See all crypto ideas
NQ Range (10-20-25, Week 4)NAZ is traveling within the Churn Zone, looking for a Breakout. Favoring a lower move prior to an upside Breakout. Scalping Shorts to KL's until "all hell breaks loose". Lower CZ currently is providing U Turns with the BTD/FOMO's redirecting the NAZ. The O/N, Dead Zone Lifting while the Open Drive c

XAU/USD | Gold’s Historic Dump – Will $4,000 Hold or Break?By analyzing the Gold chart on the 2-hour timeframe , we can see that gold experienced an extremely sharp sell-off — the biggest single-day drop in over 12 years — falling nearly $400 in less than 24 hours!
After dropping from $4,381 to $4,003 , price rebounded to $4,162, but then corrected a

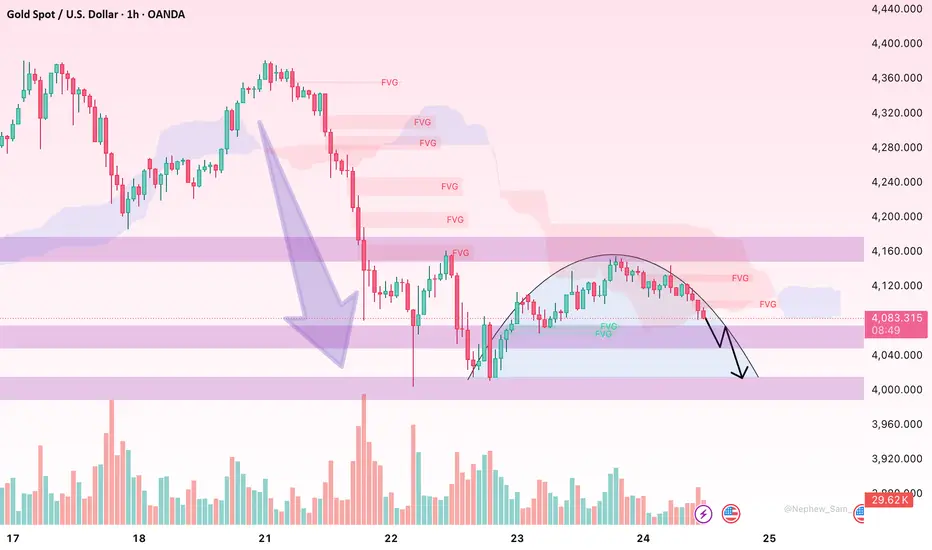
Lingrid | GOLD Consolidation Period Following Retracement ?OANDA:XAUUSD is pulling back after a failed retest of the 4,380 resistance zone, showing weakness at the upper boundary of the market structure. The market forms a descending correction within a potential consolidation phase following pullback, staying below the downward trendline. Price may attemp

XAUUSD: Will Gold Continue to Rise or Fall?👋Hello everyone, what do you think about OANDA:XAUUSD ?
As of writing, gold is trading around $4115, partially recovering from the sharp decline of the past few days. To explain the steep drop in gold prices on Tuesday, there’s no need for any conspiracy theories — the previous meteoric rise wa

Technical Correction – Bullish Structure Remains IntactHello everyone, after a strong rally to new highs, gold (XAU/USD) is entering a necessary corrective phase before deciding its next direction. On the H1 timeframe, price is temporarily consolidating around $4,090 – a key support area where buyers are beginning to show signs of defence.
From a tech
Gold - The bullrun is over today!💰Gold ( TVC:GOLD ) creates a massive top:
🔎Analysis summary:
Starting all the way back in 2015, Gold created a major rounding bottom pattern. After the breakout, Gold started its major bullrun, rallying about +300% over the past couple of years. But after this rally, Gold is now showing clear

( Gold Protocol ) Bearish Reversal DetectedStatus: Active Reversal Protocol
🆚Symbol: Gold
Session: London–New York Overlap (Smart Exit Window)
Bearish Reversal : 4085
☄️ Volume Surge Confirmed — Sellers dominate exhausted highs
☄️ Session Aligned — Smart money exit window open
☄️ Cluster Shield Active — Supply imbalance verified
☄️

1000 USD: Coffee Bull Market Overview: Prices set to DOUBLE ☕ Coffee (Arabica, ICE “KC”) — Outlook to 2026
Where we are: Nearby Arabica trades ~405–410 US¢/lb after a parabolic 2025 on weather stress, thin deliverable stocks, and policy shocks. The Dec ’25 contract is ~400 ¢/lb.
Big picture 2025/26: Official global production is pegged at a record ~178.7 M

GOLD Has buyers area at 4000 demand zone buy possible from that🚀 GOLD BULLISH OUTLOOK (1H Timeframe) 🏆
📉 Price showing strong demand zone support around 4000 — buyers stepping in with momentum!
💰 Buying Opportunity: 4000 zone
🎯 Technical Targets:
1️⃣ 4074
2️⃣ 4156
📊 Structure remains bullish as long as price holds above 4000 zone. Watch for confirmation

XAUUSD – Increased Selling Pressure After CPI DataHello traders,
With U.S. CPI rising sharply to 3.1% (compared to the forecast of 2.9%), inflation remains elevated, reinforcing the likelihood that the Fed will not cut interest rates anytime soon. With higher interest rates, the opportunity cost of holding gold (a non-yielding asset) increases

See all futures ideas
USD/CHF - Channel Breakout (24.10.2025) Setup Overview:
USD/CHF has completed a rising channel formation and is now showing signs of a bearish breakout below the lower trendline. The pair rejected the resistance zone near 0.7985 – 0.7970, confirming exhaustion in bullish momentum.
💡 Technical Setup:
Pattern: Rising Channel Breakout
Cloud

EUR/USD – Triangle Breakout (CPI Data ahead)EUR/USD – Buy Entry (M30- Channel Breakout Pattern)
The EUR/USD Pair, Price has been trading within a Triangle Breakout Pattern on the M30 chart, forming consistent higher highs and higher lows. Price action is now testing the upper boundary of the Pattern, signalling a possible breakout.
✅Market

GBPUSD Breakout and Potential RetraceHey Traders, in today’s trading session, we’re monitoring GBPUSD for a potential buying opportunity around the 1.32500 zone. The pair has recently broken out of its previous downtrend and is now in a correction phase, approaching a key retracement area at 1.32500, which also aligns with strong suppo

USDCHF I Monthly CLS I Model 2 - Big swing require patienceHi friends, new range created. As always we are looking for the manipulation in to the key level around the range. Don't forget confirmation switch from manipulation phase to the distribution phase to make the setup valid. Stay patient and enter only after change in order flow. If price reaches 50%

USD/JPY 30-Min — Volume Buy & Sell Reversals TriggeredTime Frame: 30-Minute Warfare
Entry Protocol: Only after volume-verified breakout
Bullish Reversal - 152.250
Bearish Reversal 153.000 Zone
🆚 Reasons To Enter The path
————
➕ Volume Engaged & Confirmed
➕ Time Zone Aligned (London / NY)
➕ Liquidity Cleared Below
➕ Cluster Shield Active
➕ Delta Sh

GBPUSD maintains a bearish outlook👋Hello everyone, what do you think about FX:GBPUSD ?
Currently, GBPUSD continues to trade within a clear downtrend channel on the chart. The British pound remains weak, and technical indicators show that the EMA 34 is still below the EMA 89, confirming that the downtrend is likely to persist.
T

GBP/USD Strong Down Trend Bearish Move💷 GBP/USD Technical Update (1H Chart) 📉
The pair is showing strong selling pressure from the key resistance zone at 1.33400 — bears taking control! 🐻
🎯 Technical Targets:
1️⃣ 1.33100 – Initial target
2️⃣ 1.32800 – Secondary target
3️⃣ 1.32500 – Extended target
🧭 Momentum favors the downside w

USD/JPY Nears 153 – Uptrend Faces “Danger Zone” PressureHello everyone,
USD/JPY continues to maintain bullish momentum as it holds above 152.80, approaching the tense resistance zone of 153.00–153.50 – an area where price has repeatedly stalled in the past due to risk of BoJ intervention. This is a highly sensitive phase of the market where sentiment

Lingrid | USDJPY Weekly High Rejection - Potential Sell SignalFX:USDJPY reached the weekly high, showing bearish divergence after an extended rally inside the upward channel. Price is now hovering near the 153.000 level, where prior highs align with weakening momentum. A rejection here could trigger a pullback toward the 152.000 mid-channel support, marking t

USDCAD Breaks Out After CPI – The Bullish Wave Is Rising!Hello traders!
USDCAD is showing strong bullish momentum after tonight’s U.S. economic data release. The annual CPI rose to 3.1% , higher than the forecast of 2.9% , signaling persistent inflation pressure and suggesting that the Fed may delay rate cuts . This has boosted the U.S. dollar, provid

See all forex ideas
| - | - | - | - | - | - | - | ||
| - | - | - | - | - | - | - | ||
| - | - | - | - | - | - | - | ||
| - | - | - | - | - | - | - | ||
| - | - | - | - | - | - | - | ||
| - | - | - | - | - | - | - | ||
| - | - | - | - | - | - | - | ||
| - | - | - | - | - | - | - |
Trade directly on the supercharts through our supported, fully-verified and user-reviewed brokers.


