BOJ to Stress Test Global Markets? Why a Black Swan Is PossibleWhile US markets are busy debating AI valuations and parsing the Fed’s latest rate cut , something far more understated — and potentially more disruptive — is brewing across the Pacific.
The Bank of Japan is expected to raise interest rates on Friday, marking what could be its first hike in 11 mon

The best trades require research, then commitment.
Get started for free$0 forever, no credit card needed

Scott "Kidd" PoteetThe unlikely astronaut

Where the world does markets
Join 100 million traders and investors taking the future into their own hands.

GOOG: Is a 10% Surge Imminent? The Setup for $340 Explained🚀 NASDAQ:GOOG : Is a 10% Surge Imminent? The Setup for $340 Explained
In the noisy world of trading, clarity is power.
Today, we are looking at Alphabet Inc. (GOOGL). We are not predicting the future, we are simply preparing for a high-probability outcome.
We have identified a textbook Bull Fla

DOGE pulls back before major decline DOGECOIN is in a range formed against the backdrop of a downtrend. The market is under pressure from above at 0.155 - 0.153 - 0.150. The structure is bearish. The rebound from 0.134 is directed towards 0.1415. A false breakout could trigger a decline.
There is no volume from the bulls, and the mark

BTC Corrections Don’t Kill Bull Market. They Power Them1. Primary Trend Structure
Macro trend: Clearly bullish. Price has respected a rising diagonal trendline since the 2022–2023 cycle low. Market structure shows higher highs and higher lows, confirming an intact uptrend.
This is a classic bull market staircase: impulsive advances (green boxes) follo

2025 BITCOIN TARGETS: Reality Check
Forecasting is easy. Being right is hard.
1. When Targets Turn Into Illusions
Look at this chart.
Bitcoin at $90,000. Sixteen days left in 2025.
And every “expert” target — JPMorgan, VanEck, Standard Chartered, Tom Lee, Kiyosaki, BlackRock, Cathie Wood —
all of them missed. Every single one.

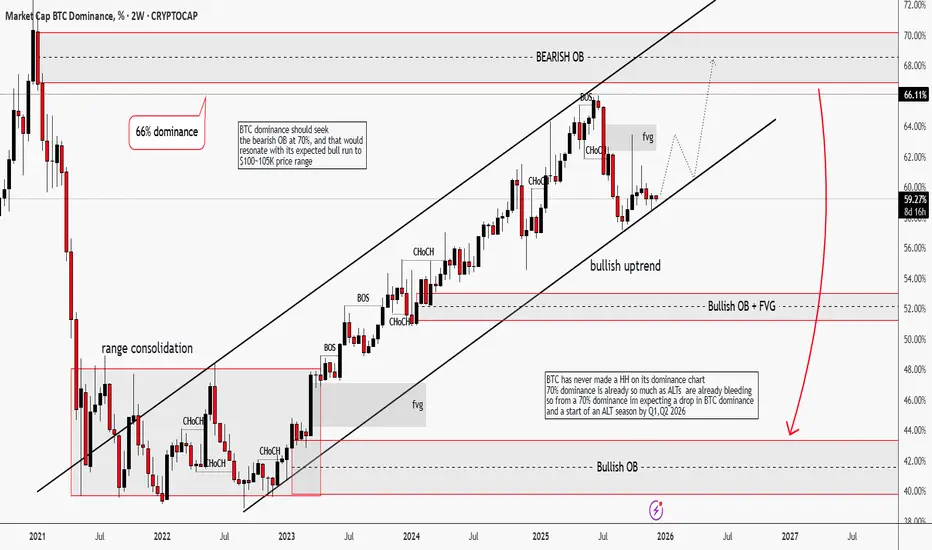
BTC Dominance | Winter is "Almost" ComingHello traders,
Its been a minute since I last checked my wallet, cause I don't love seeing red. Who loves to?
BTC dominance on the 2W timeframe has been in an impulsive bullish uptrend. Structure-wise, it has printed multiple BOS + CHoCH, which tells me that capital are still rotating into Bitcoin
Gold – Potential Choppy Price Action AheadThe market got what it wanted from the Federal Reserve last night when a widely anticipated interest rate cut of 25bps (0.25%) was announced, a move which as a rule is positive for Gold prices as it is an asset that doesn’t bear any interest itself. Initially this was the case, with the popular meta

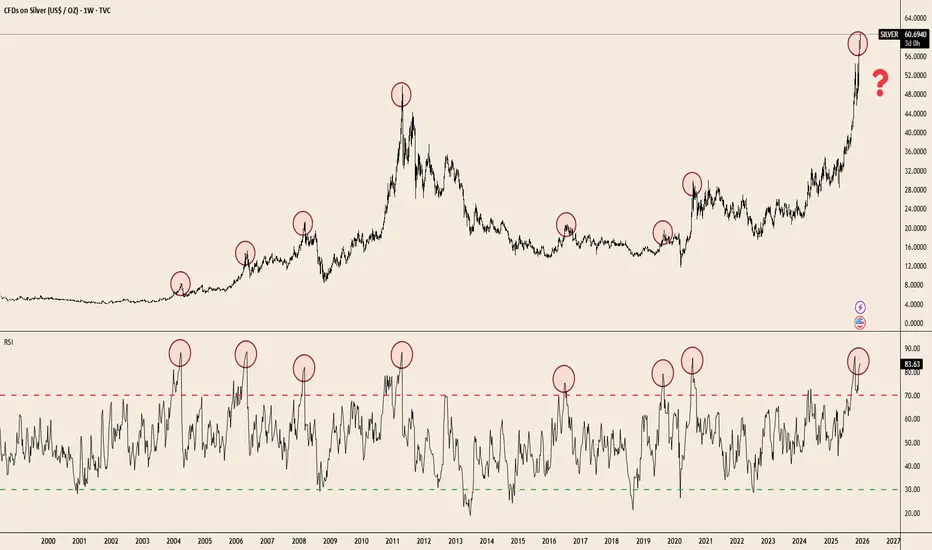
Silver at Extremes: RSI Signals Haven’t Missed in 20 YearsTVC:SILVER has delivered a massive breakout — up +109.9% YTD — but the weekly RSI is now pushing into one of the most extreme zones seen in two decades. Historically, every major spike into the 80–85 RSI band has preceded cooling periods, consolidations, or full reversals.
The chart makes the pat
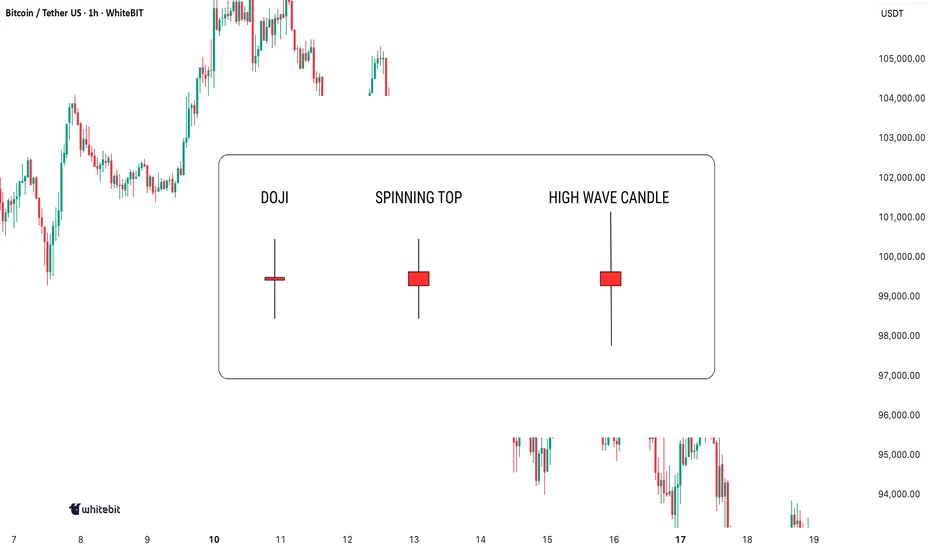
Indecision on the Chart: What These Candles Really MeanIndecision in the market? You're not alone. Every trader has faced those moments when the charts seem to scream confusion. But here's the thing: indecision candlestick patterns aren't just noise. They hold secrets that, when decoded, can give you the upper hand. Let's dive in and learn how to spot t
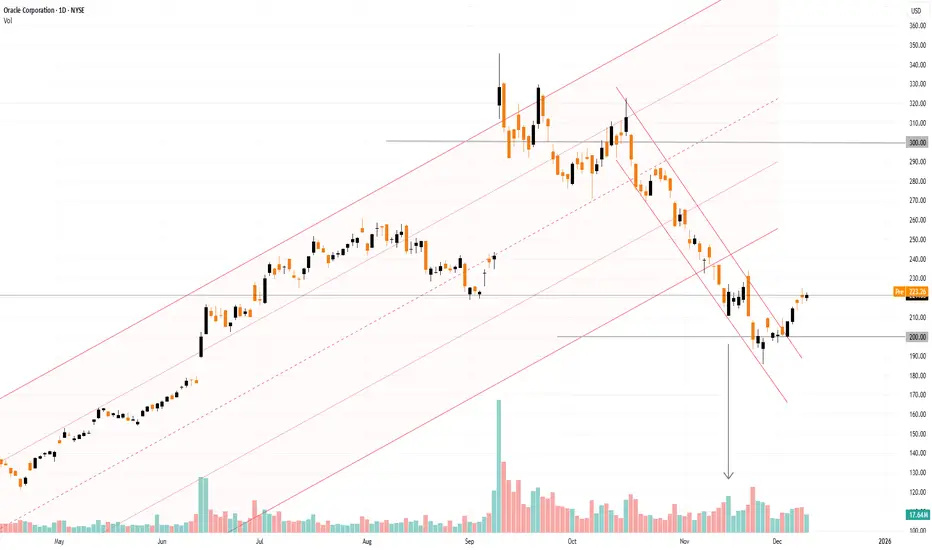
Oracle (ORCL) Share Price Rebounds Ahead of Earnings ReleaseOracle (ORCL) Share Price Rebounds Ahead of Earnings Release
Oracle is due to publish its quarterly results today after the close of the main trading session. Analysts are expecting solid year-on-year growth compared with the same period last year:
→ Revenue: forecast to rise by around 15% to $16
See all editors' picks ideas
Multi-Ticker Anchored CandlesMulti-Ticker Anchored Candles (MTAC) is a simple tool for overlaying up to 3 tickers onto the same chart. This is achieved by interpreting each symbol's OHLC data as percentages, then plotting their candle points relative to the main chart's open. This allows for a simple comparison of tickers to tr

Vdubus Divergence Wave Pattern Generator V1The Vdubus Divergence Wave Theory
10 years in the making & now finally thanks to AI I have attempted to put my Trading strategy & logic into a visual representation of how I analyse and project market using Core price action & MacD. Enjoy :)
A Proprietary Structural & Momentum Confluence System

Per Bak Self-Organized CriticalityTL;DR: This indicator measures market fragility. It measures the system's vulnerability to cascade failures and phase transitions. I've added four independent stress vectors: tail risk, volatility regime, credit stress, and positioning extremes. This allows us to quantify how susceptible markets are

Volatility Risk PremiumTHE INSURANCE PREMIUM OF THE STOCK MARKET
Every day, millions of investors face a fundamental question that has puzzled economists for decades: how much should protection against market crashes cost? The answer lies in a phenomenon called the Volatility Risk Premium, and understanding it may fundam

Volume Gaps & Imbalances (Zeiierman)█ Overview
Volume Gaps & Imbalances (Zeiierman) is an advanced market-structure and order-flow visualizer that maps where the market traded, where it did not, and how buyer-vs-seller pressure accumulated across the entire price range.
The core of the indicator is a price-by-price volume prof

Match Finder [theUltimator5]Match Finder is the dating app of indicators. It takes your current ticker and finds the most compatible match over a recent time period. The match may not be Mr. right, but it is Mr. right now. It doesn't forecast future connection, but it tells you current compatibility for today.
Jokes aside,

Trend Line Methods (TLM)Trend Line Methods (TLM)
Overview
Trend Line Methods (TLM) is a visual study designed to help traders explore trend structure using two complementary, auto-drawn trend channels. The script focuses on how price interacts with rising or falling boundaries over time. It does not generate trade sign

Breakouts & Pullbacks [Trendoscope®]🎲 Breakouts & Pullbacks - All-Time High Breakout Analyzer
Probability-Based Post-Breakout Behavior Statistics | Real-Time Pullback & Runup Tracker
A professional-grade Pine Script v6 indicator designed specifically for analyzing the historical and real-time behavior of price after strong All-Ti

Count█ OVERVIEW
A library of functions for counting the number of times (frequency) that elements occur in an array or matrix.
█ USAGE
Import the Count library.
import joebaus/count/1 as c
Create an array or matrix that is a `float`, `int`, `string`, or `bool` type to count elements from, t

Holographic Market Microstructure | AlphaNattHolographic Market Microstructure | AlphaNatt
A multidimensional, holographically-rendered framework designed to expose the invisible forces shaping every candle — liquidity voids, smart money footprints, order flow imbalances, and structural evolution — in real time.
---
📘 Overview
The Hol

See all indicators and strategies
Community trends
GOOG: Is a 10% Surge Imminent? The Setup for $340 Explained🚀 NASDAQ:GOOG : Is a 10% Surge Imminent? The Setup for $340 Explained
In the noisy world of trading, clarity is power.
Today, we are looking at Alphabet Inc. (GOOGL). We are not predicting the future, we are simply preparing for a high-probability outcome.
We have identified a textbook Bull Fla
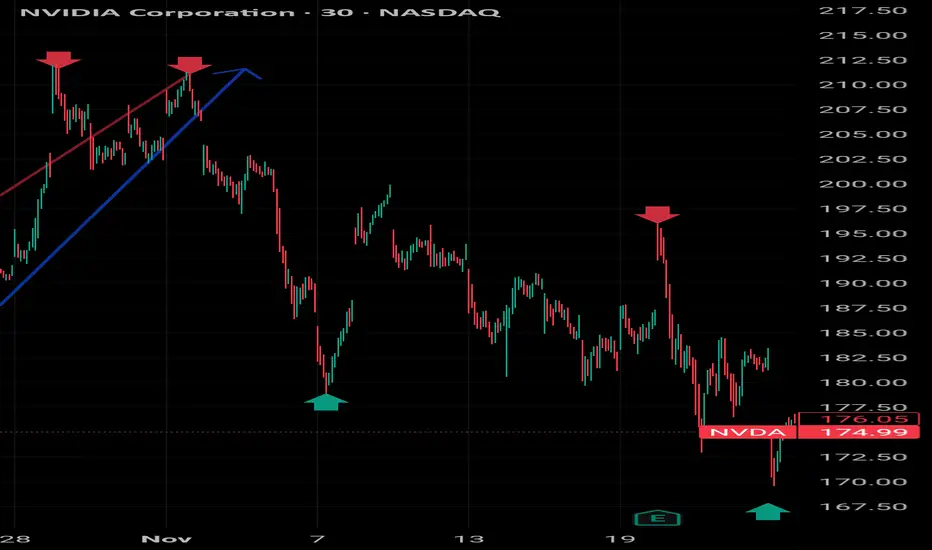
NVDA 30-Min – Beginner Structure & S/R PracticeI’m new to trading and still learning how to properly read market structure, trends, and support/resistance. This post is for feedback only, not a trade idea.
On this 30-minute NVDA chart, I marked:
Higher highs / higher lows during the uptrend (blue arrows)
Lower highs where price rejected and r
$ptonyieahhh we are back
economy is sketchy right now. But a lot of small caps are looking good.
Volume shelf, potential head and shoulder, volume seems to be slightly higher than usual and seeing it breaking a down trend?
will see

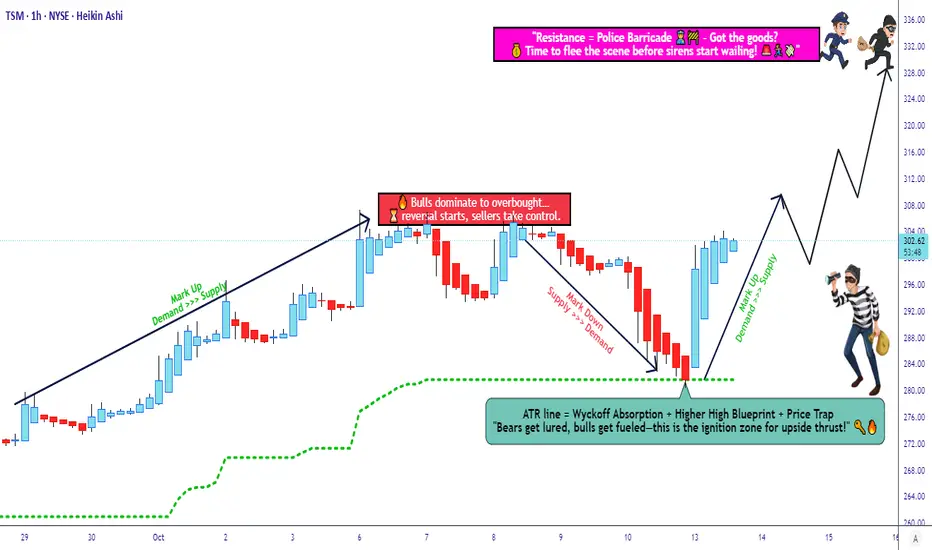
TSM Trade Setup — Strategic Entries and Risk Control🏦 TSM — “The Chip Heist: Thief Layers Up for the Big Loot” 💎
🎯 Market Setup:
TSM (Taiwan Semiconductor Mfg. Co., Ltd) is showing a bullish setup after a potential retest at the ATR line. The ATR retest will confirm buyer strength before momentum kicks in.
💰 Thief’s Master Plan (Layer Entry Tactics)
NVDA Sitting on a Decision Zone – Dec. 15 Could Be ExplosiveNVDA doesn’t look healthy right now. The structure has already rolled over, and what we’re seeing now feels more like damage control, not buyers stepping in with confidence.
After the breakdown from the prior range, price tried to bounce, but every push higher has been weak and quickly sold. That te

BlackBerry still encrypts, just not phones anymoreBB closed the week at 4.28. The weekly chart shows a symmetric triangle forming after a fully completed falling wedge. The key point is that price has already reacted from the 0.618 Fibonacci level near 4.00, which aligns with the highest volume area on the Volume Profile and a clear demand zone. A

EVTL Another EVOL to take flight?I have had an open position in EVTL for a couple months. I bought it for about $4.50.
Then, this past week I closed the entire position after the breakout. My closing prices was $6.70.
I closed it simply because I thought that the breakout move was too fast and that it would come back down again,

Google is trading in a high-risk zone.Google (Alphabet) Stock Analysis
As shown on Chart A, Google is trading within a 5-year ascending channel on the weekly timeframe and has now reached the upper boundary of the channel.
On Chart B (daily timeframe), price has broken below its rising channel and has already moved toward the mid-leve

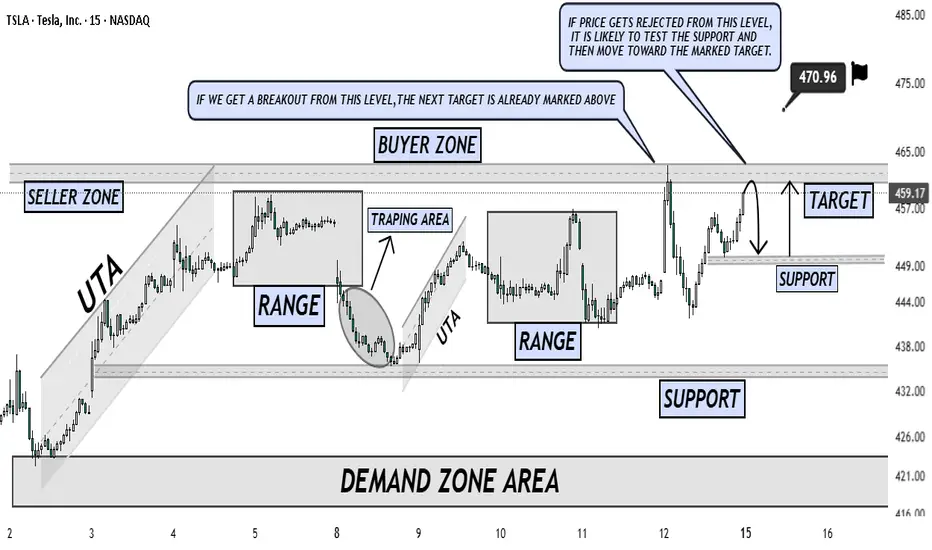
TSLA — Range Structure, Rejection Risk & Breakout Continuation TSLA is currently trading inside a well-defined range after a strong upside move from the demand zone, showing clear market structure with buyer and seller zones in play. Price has already reacted from the upper resistance area, where rejection is possible, indicating that sellers are defending this
Massive Upside Ahead: Top 5 Stocks With Big 2026 Potential📌 Top 5 Stocks for 2026 (Monthly Chart Setups)
I just published a new breakdown focused on multi-month / multi-year moves — not short-term noise. Using the monthly timeframe, I walk through structure + momentum to find the next potential 2x–10x runners.
Names covered:
• NYSE:ZETA – cup & handle

See all stocks ideas
Today
PLCEChildren's Place, Inc. (The)
Actual
—
Estimate
0.70
USD
Today
BNBXBNB Plus Corp.
Actual
—
Estimate
−22.50
USD
Today
CTXRCitius Pharmaceuticals, Inc.
Actual
—
Estimate
−0.43
USD
Today
GTIMGood Times Restaurants Inc.
Actual
—
Estimate
—
Today
TBHCThe Brand House Collective, Inc
Actual
—
Estimate
−0.42
USD
Today
NMTCNeuroOne Medical Technologies Corporation
Actual
—
Estimate
−0.04
USD
Today
IMMRImmersion Corporation
Actual
—
Estimate
0.10
USD
Today
RICKRCI Hospitality Holdings, Inc.
Actual
—
Estimate
1.81
USD
See more events
Today
ELCGELC Group Holdings Ltd.
Exchange
NASDAQ
Offer price
4.00 - 6.00
USD
Today
R
RIKURiku Dining Group Ltd.
Exchange
NASDAQ
Offer price
4.00 - 6.00
USD
Today
DTDTDt House Ltd.
Exchange
NASDAQ
Offer price
4.00 - 5.00
USD
Tomorrow
U
UPXUptrend Holdings Ltd.
Exchange
NASDAQ
Offer price
4.00 - 5.00
USD
Dec 17
MDLNMedline Inc.
Exchange
NASDAQ
Offer price
—
Dec 17
A
ANDGAndersen Group Inc.
Exchange
NYSE
Offer price
14.00 - 16.00
USD
See more events
Community trends
2025 BITCOIN TARGETS: Reality Check
Forecasting is easy. Being right is hard.
1. When Targets Turn Into Illusions
Look at this chart.
Bitcoin at $90,000. Sixteen days left in 2025.
And every “expert” target — JPMorgan, VanEck, Standard Chartered, Tom Lee, Kiyosaki, BlackRock, Cathie Wood —
all of them missed. Every single one.
Bitcoin - Bear flag, 74k confirmed! (warning, must see)Bitcoin has just completed its bearish flag formation. What now? The probability of going down is now around 70%, while the probability of going up is only 30%. Many times we see a bullish breakout of a bear flag. How does it look? Something like that:
We see that for a bullish breakout, the bulls

BTCUSDTHello Traders! 👋
What are your thoughts on BITCOIN?
Bitcoin is currently consolidating within a well-defined range between $88,000 and $95,000, while continuing to trade inside an ascending channel.
The lower boundary of this ascending channel aligns closely with the $88,000 support zone, adding

#BITCOIN: Latest Update 14/12/2025 Show Massive Drop ComingDear Traders,
Overview On BTCUSDT📈
🔺Hope you are doing great, we have an excellent opportunity on BTC showing strong rejection at $96,000 region; price failed multiple times showing extreme sellers momentum in the market. After the rejection the daily candle started suggesting a strong drop in the

How long will market manipulation continue?If this daily candle confirms the triangle breakout, the bearish trend will be validated and the price could drop to $83,000. A price reversal is unlikely before the New Year.
And if this market cannot free itself from manipulation, it is doomed to collapse.

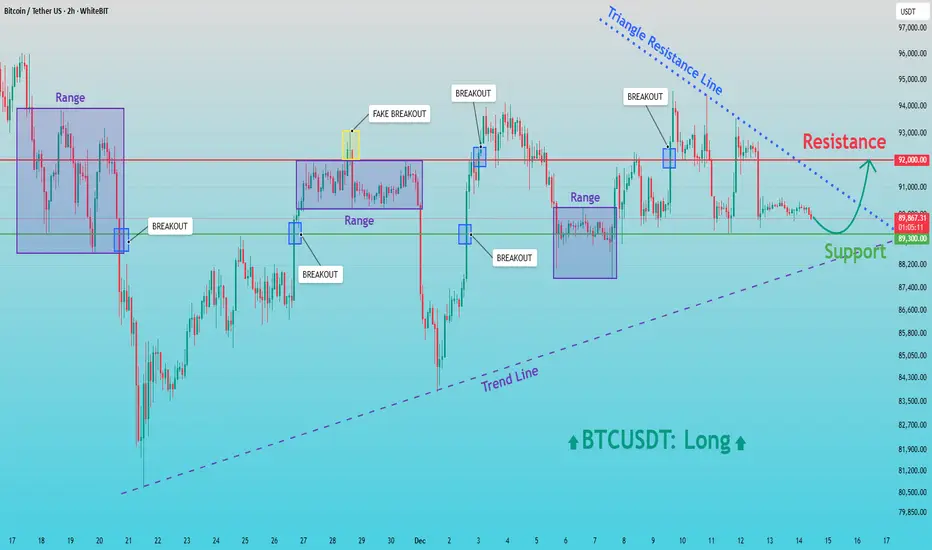
BTCUSD: Buyers in Control - Resistance Retest AheadHello everyone, here is my breakdown of the current BTCUSDT setup.
Market Analysis
BTCUSDT is currently trading within a broadly bullish structure, supported by a rising trend line that has been respected after the major sell-off and subsequent recovery. Following the strong decline, price formed
Bitcoin: Weakness Is Where Opportunity Lurks.Bitcoin is coming off a double top lower high within what appears to be a bearish triangle formation. While this pattern is going to elicit bearish reactions from the herd (experts), it is important to ANTICIPATE potential turning points that can catch everyone off guard. While Bitcoin can break low

ETH – Base Building After the PullbackHello everyone,
ETH has stabilized after a sharp correction from the 4,500–4,800 zone. In recent weeks, price has been moving slowly within the 3,000–3,200 range, forming a relatively solid accumulation base. On the weekly timeframe, the bearish structure has weakened significantly, and the market

Ethereum — Bearish structure confirmed amid weak macro sentimentHello everyone,
At the moment, Ethereum is trading within a broader risk-off environment, where defensive sentiment continues to dominate risk assets. Capital flows have yet to show a strong enough return to support a sustainable bullish trend, while investors remain cautious amid macroeconomic un

ETH - Bearish Wave UnderwayTough times for holders may be about to get tougher as ETH is printing a very bearish shooting star.
Hope you guys enjoyed my accurate call to buy:
And call to sell:
- on my previous threads.
Now looking to buy the dip again - but not here...
This analysis is shared for educational purposes

See all crypto ideas
Lingrid | GOLD Weekly Analysis: Bull Market Back in CommandOANDA:XAUUSD perfectly played out my previous weekly idea . Price capped off another powerful week, decisively breaking above the November high and confirming its bullish trajectory toward fresh all-time highs beyond $4,400. This isn’t just momentum—it’s structural. The market has transitioned fro

XAUUSDHello Traders! 👋
What are your thoughts on GOLD?
Gold is currently moving within an ascending channel and is approaching the channel ceiling.
This area coincides with the previous high and the All-Time High (ATH), making it highly significant.
A bearish reaction is expected in this zone.
Probable

GOLD 1H CHART ROUTE MAP UPDATE & TRADING PLAN FOR THE WEEKHey Everyone,
Please see our 1h chart levels and targets for the coming week.
We are seeing price play between two weighted levels with a gap above at 4306 and a gap below at 4270, as support. We will need to see ema5 cross and lock on either weighted level to determine the next range.
We will se

2 Scenarios - GOLDHello traders,
the gold price has reached the resistance zone (4338 – 4355).
We now have two possible scenarios:
🟢 BULLISH SCENARIO:
If the market breaks and closes above the resistance,
we can expect a bullish continuation 📈
🎯 TARGET: 4400.000
🔴 BEARISH SCENARIO:
If the price breaks a

GOLD → Consolidation before reaching ATH FX:XAUUSD has been rising for the fifth consecutive day amid a weakening dollar and expectations of a dovish Fed policy. The market is testing intermediate resistance before reaching ATH.
The Fed cut rates by 25 basis points, but the market expects two cuts in 2026, not one, as stated in the

XAUUSD Defends Support – Upside Move Toward 4,380 ExpectedHello traders! Here’s my technical outlook on XAUUSD based on the current market structure. Gold continues to trade within a well-established bullish trend, supported by a clear ascending Trend Line that has been respected after multiple pullbacks. After an earlier rejection from the upper Resistanc

Hellena | GOLD (4H): LONG to resistance area of 4417.This week, I expect the upward movement to continue and the medium-term “12345” impulse to complete.
I expect to see a small correction, after which I expect to see at least the 4417 area reached at the end of wave “5” or in the extension of wave “3”.
This week, after the completion of this movemen

THE KOG REPORT THE KOG REPORT:
In last week’s KOG Report, we wanted to see the immediate resistance fail and give us the short trade into defence which worked well. Due to there being now break of defence and our indicators suggesting a long, we managed to get a long into the higher defence box which ultimately

XAU/USD – Bullish Trend Confirmed, Buy on PullbacksMarket Context
Gold remains firmly bullish, continuing to trade within a well-defined ascending channel. After a strong impulsive rally, the market is now entering a technical pullback phase to rebalance liquidity, which is a healthy behavior in a trending market rather than a sign of reversal.
Fr

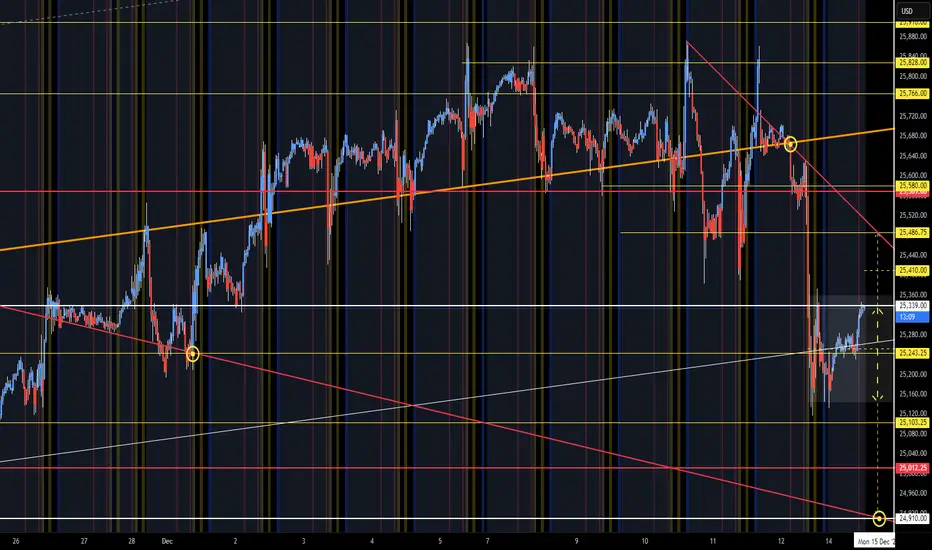
NQ Range (12-15-25)After the drop back into the Churn Zone, we have a NAZ Triangle of Range. Upper circle is the break under 10/22 TL, Mid circle is near mid CZ and Diablo pop on 12/1 and lower circle is CZ bottom and U Turn Target. Open Range (Reg Session) is shaded zone (yellow arrow), white arrow is break out to re
See all futures ideas
GBPUSD (4H) chart patterns ...GBPUSD (4H) – Technical Targets (Educational)
Based on the chart (descending trendline break + bullish structure):
🎯 Upside Targets
Target 1: 1.3600 – 1.3620 (near resistance / first objective)
Target 2: 1.3720 – 1.3750 (major resistance zone)
🛑 Invalidation / Risk Area
Bullish setup weakens

BOJ to Stress Test Global Markets? Why a Black Swan Is PossibleWhile US markets are busy debating AI valuations and parsing the Fed’s latest rate cut , something far more understated — and potentially more disruptive — is brewing across the Pacific.
The Bank of Japan is expected to raise interest rates on Friday, marking what could be its first hike in 11 mon
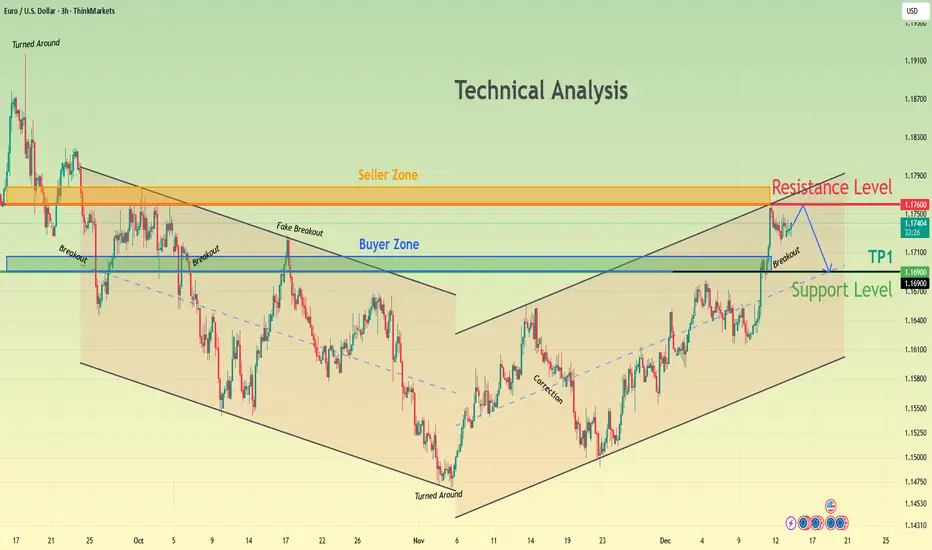
EURUSD Weakens at Seller Zone - Support at 1.1690 Under WatchHello traders! Here’s my technical outlook on EUR/USD based on the current chart structure. After a prolonged bearish move inside a downward channel, EURUSD found a base and reversed from the lower boundary, signaling a loss of bearish momentum. The price then broke above the descending resistance a
GBP/CAD: Consolidation ContinuesThe GBPCAD is currently exhibiting consolidation within a horizontal parallel channel.
We observed a notable bullish reaction to its support, as the price formed a double bottom pattern and subsequently started to grow.
It is highly probable that the price will soon reach the 1.8477 level.

USDCAD at Critical Trend ResistanceHey Traders,
In tomorrow’s trading session, we are monitoring USDCAD for a potential selling opportunity around the 1.38000 zone.
Technical structure:
USDCAD remains in a clear downtrend and is currently in a corrective phase, with price retracing toward the 1.38000 area — a key zone of trend resi

EUR/USD | Testing the supply zone (READ THE CAPTION)By examining the 4H chart of EURUSD, we can see that it has stuck to the supply zone and it's having a hard time making it through the zone. I expect another move to 1.17590 (high of the supply zone) and if it breaks through, I expect it to challenge the FVG zone.
If EURUSD fails to go through the

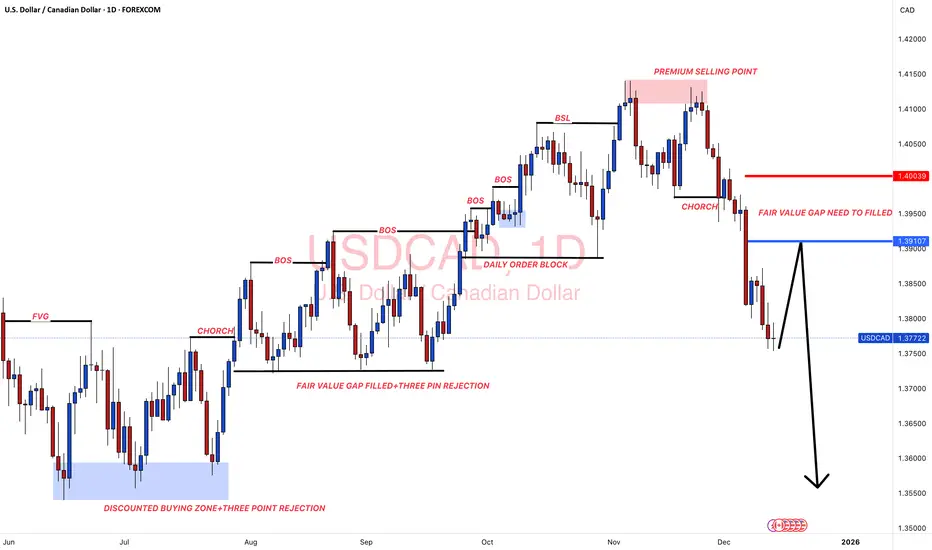
#USDCAD: A Perfect Selling Zone For The Week 15/12/2025Dear Traders,
Overview On USDCAD📈
🔺Price has left a great area of selling zone which need to be filled; we already have given an entry point and an exit point for you to identify the selling zone easily. USD is likely to show some minor bullish behaviour which will push the price of USDCAD to our
15.12.25 Daily ForecastPairs on Watch -
FX:EURNZD
FX:GBPJPY
FX:CADJPY
FX:GBPCHF
A short overview of the instruments I am looking at for today, multi-timeframe analysis down to what I will be looking at for an entry. Enjoy!

EURUSD Short: Bears Defend Resistance - Next Stop 1.1700Hello, traders! EURUSD is trading within a broader bearish structure, with price action clearly respecting a descending trend line from the higher timeframe. Earlier, the pair reacted from a Pivot Point near the trend line and moved into a consolidation Range, showing indecision before the next dire

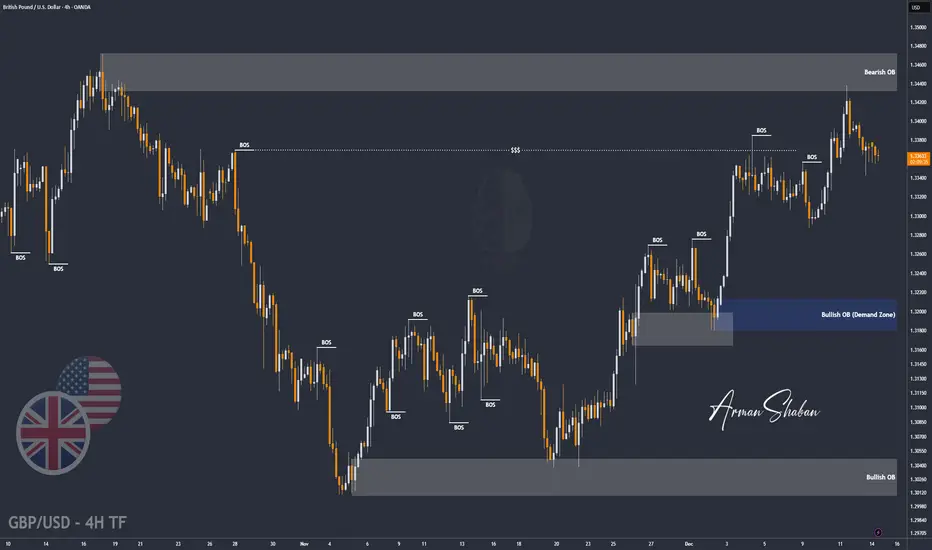
GBP/USD | Testing Supply Zone and Setting Up for Possible Drop!By analyzing the #GBPUSD chart on the 4 hour timeframe, we can see that after the initial drop, price bounced and pushed back into the 1.344 supply zone. Once it hit that level, strong selling pressure kicked in and GBPUSD dropped to 1.334. Right now the pair is trading around 1.336.
If price can ho
See all forex ideas
| - | - | - | - | - | - | - | ||
| - | - | - | - | - | - | - | ||
| - | - | - | - | - | - | - | ||
| - | - | - | - | - | - | - | ||
| - | - | - | - | - | - | - | ||
| - | - | - | - | - | - | - | ||
| - | - | - | - | - | - | - | ||
| - | - | - | - | - | - | - |
Trade directly on Supercharts through our supported, fully-verified, and user-reviewed brokers.


