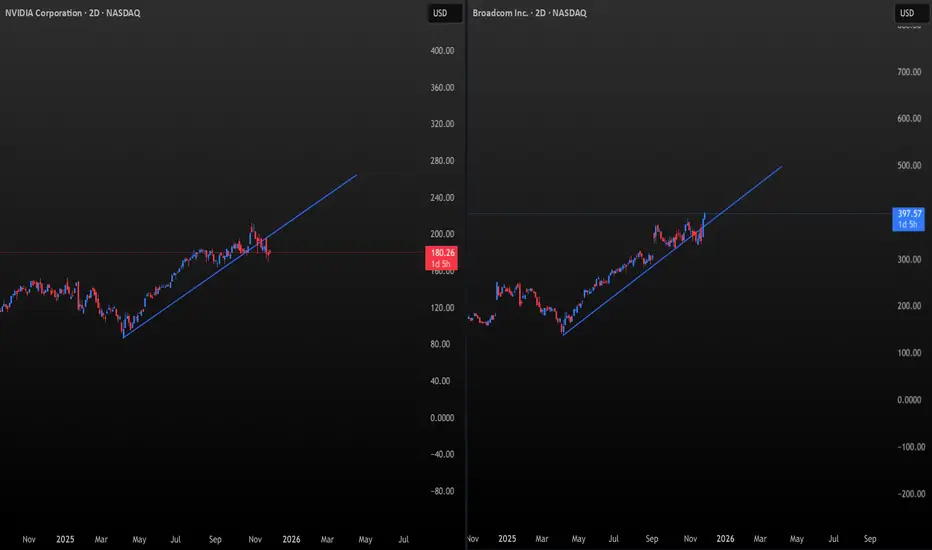
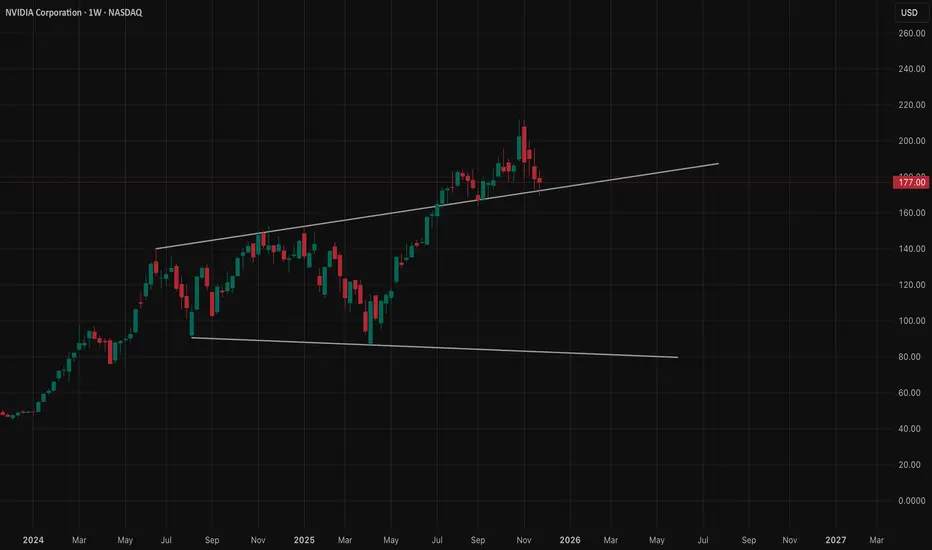
NVDA vs AVGO: The Battle for the AI Throne Has Begun⚡A New Leader Emerges in the Semiconductors
For years, NVDA was the undisputed titan — the gravitational center of the semiconductor universe.
But now, the geometry tells a different story.
THE CHARTS 📐
Both charts use the same natural scaling:
1° of time = $1 of price per unit.
And here’s the

Cyber Monday
The greatest deal of the year is in its final orbit.Secure this offer before it's gone.
SPX to Money Supply WARNING!If the charts aren’t showing bubble setups, I’m not going to invent them. I post what the data shows. So please don’t shoot the messenger when I say GTFO & STFO.
And just to keep the facts straight:
Brokerage, stock, and crypto accounts are not part of M2.
Why does M2 matter?
It’s the actual spe

Stocks Stage Comeback in Time for Thanksgiving. What's Behind ItIt’s Thanksgiving, and you know what that means. “Hey, sweety, why don't you come here and let us know how your high-beta stocks are doing. Here’s our little investor.”
And for once, the answer isn’t followed by a sigh. Stock traders are heading into the holiday with something they haven’t had in

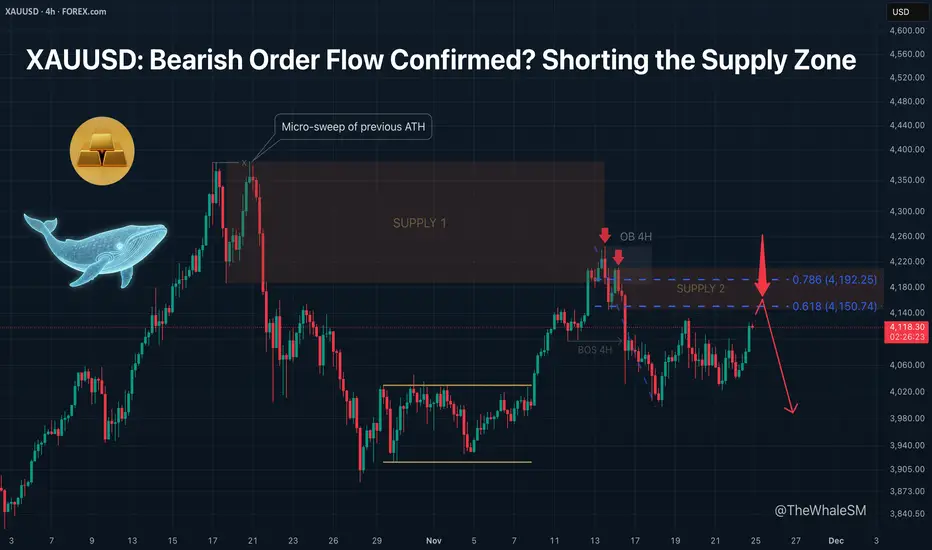
XAUUSD: Bearish Order Flow Confirmed? Shorting the Supply Zone.After updating the All-Time High (ATH), Gold performed a micro-sweep of liquidity from the previous ATH. This move was engineered via a Supply Zone . Following the sweep, this zone was mitigated, initiating a bearish order flow that broke the 4H structure to the downside (BOS 4H).
After the struc
ETHUSD H1 | Bullish Bounce Off Key SupportMomentum: Bullish
Price is currently above the ichimoku cloud.
Buy entry: 2,867.08
- Pullback support
- 61.8% Fib retracement
- 100% Fib projection
Stop Loss: 2,777.16
- Overlap support
Take Profit: 2,972.69
- Swing high resistance
High Risk Investment Warning
Stratos Markets Limited (tradu.com

NZDUSD downtrend continuation below falling resistanceThe NZDUSD currency pair continues to display a bearish outlook, in line with the prevailing downward trend. Recent price action suggests a corrective pullback, potentially setting up for another move lower if resistance holds.
Key Level: 0.5675
This zone, previously a consolidation area, now acts

PYPL USPayPal is a rare combination of value and growth.
The company demonstrates strong fundamentals, is strategically focused on the future, and trades at record-low multiples. The combination of financial discipline, capital return, and AI innovation makes it an attractive asset for long-term investor

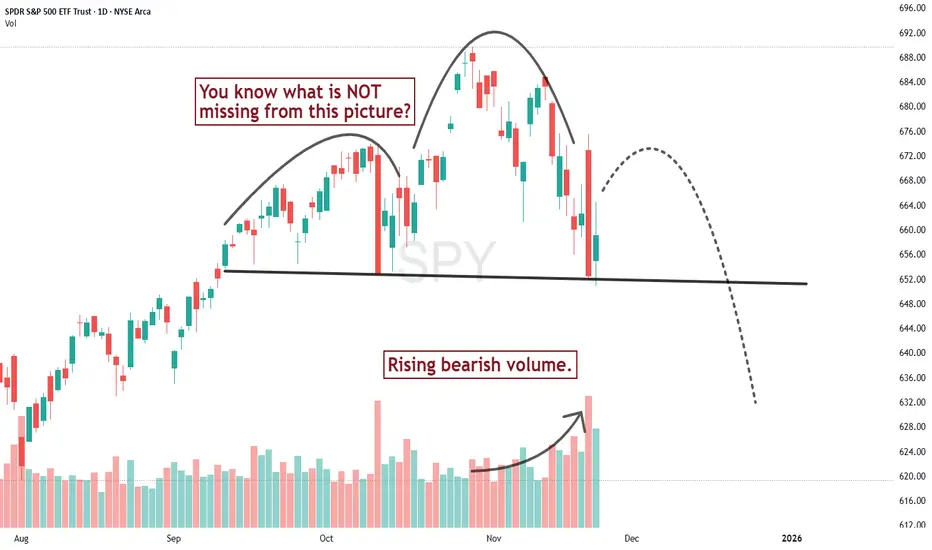
Oh what a difference a day makes!A couple days ago I thought there wasn't sufficient price pattern evidence to talk about a serious change in trend for the S&P 500, mostly because I didn't see the volume pattern confirming the downward slide of the recent high. But Thursday changed that. Redrawing the neckline, we get a chart that
Why This Time Is Not Different — BTC Could Still Drop >50%Bitcoin is moving into a phase where long-term cycles matter more than whatever the market narrative happens to be this week.
And if you look at those cycles, one thing becomes clear: BTC has never avoided a major drop after making a new ATH.
1. The timing keeps repeating — almost to the day
Every

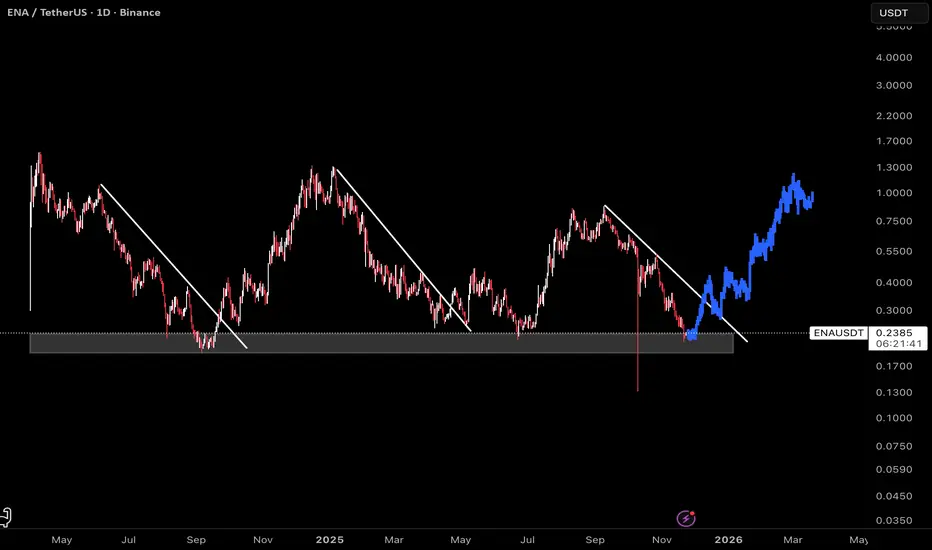
ENA: Bullish SetupThis chart displays ENA on a daily timeframe, with clear structure pointing to a favorable long entry. The current price action is trading within a major support zone, where previous trendline breaks have consistently marked the start of impulsive moves.
Historically, every time ENA breaks out abov
See all editors' picks ideas
Match Finder [theUltimator5]Match Finder is the dating app of indicators. It takes your current ticker and finds the most compatible match over a recent time period. The match may not be Mr. right, but it is Mr. right now. It doesn't forecast future connection, but it tells you current compatibility for today.
Jokes aside,

Trend Line Methods (TLM)Trend Line Methods (TLM)
Overview
Trend Line Methods (TLM) is a visual study designed to help traders explore trend structure using two complementary, auto-drawn trend channels. The script focuses on how price interacts with rising or falling boundaries over time. It does not generate trade sign

Breakouts & Pullbacks [Trendoscope®]🎲 Breakouts & Pullbacks - All-Time High Breakout Analyzer
Probability-Based Post-Breakout Behavior Statistics | Real-Time Pullback & Runup Tracker
A professional-grade Pine Script v6 indicator designed specifically for analyzing the historical and real-time behavior of price after strong All-Ti

Count█ OVERVIEW
A library of functions for counting the number of times (frequency) that elements occur in an array or matrix.
█ USAGE
Import the Count library.
import joebaus/count/1 as c
Create an array or matrix that is a `float`, `int`, `string`, or `bool` type to count elements from, t

Holographic Market Microstructure | AlphaNattHolographic Market Microstructure | AlphaNatt
A multidimensional, holographically-rendered framework designed to expose the invisible forces shaping every candle — liquidity voids, smart money footprints, order flow imbalances, and structural evolution — in real time.
---
📘 Overview
The Hol

PriceFormatLibrary for automatically converting price values to formatted strings
matching the same format that TradingView uses to display open/high/low/close prices on the chart.
█ OVERVIEW
This library is intended for Pine Coders who are authors of scripts that display numbers onto a user's charts. T

LogNormalLibrary "LogNormal"
A collection of functions used to model skewed distributions as log-normal.
Prices are commonly modeled using log-normal distributions (ie. Black-Scholes) because they exhibit multiplicative changes with long tails; skewed exponential growth and high variance. This approach i

Range Oscillator (Zeiierman)█ Overview
Range Oscillator (Zeiierman) is a dynamic market oscillator designed to visualize how far the price is trading relative to its equilibrium range. Instead of relying on traditional overbought/oversold thresholds, it uses adaptive range detection and heatmap coloring to reveal where pri

Volume Surprise [LuxAlgo]The Volume Surprise tool displays the trading volume alongside the expected volume at that time, allowing users to spot unexpected trading activity on the chart easily.
The tool includes an extrapolation of the estimated volume for future periods, allowing forecasting future trading activity.
🔶 U

Smooth Theil-SenI wanted to build a Theil-Sen estimator that could run on more than one bar and produce smoother output than the standard implementation. Theil-Sen regression is a non-parametric method that calculates the median slope between all pairs of points in your dataset, which makes it extremely robust to o

See all indicators and strategies
Community trends
NVDA🌎NVIDIA: At the Peak or the Brink?
Nvidia's record highs are accompanied by warning signs. A market cap of $4.37 trillion and a P/E ratio of 51 indicate inflated expectations.
Risks:
Speculative demand: The $23.7 billion investment looks like an artificial market pump.
Macro threats: The AI bo

AMZN : Mid-Term Bullish Continuation OutlookAmazon is shaping a constructive bullish sequence on the 4-hour timeframe, with recent price action reinforcing renewed upside momentum. The unfolding structure suggests buyers may remain in control as the market progresses into December, keeping the continuation scenario active while the current rh

NVDA at a Decision Level – Dec 1–5 OutlookWeekly – Trend Still Up, But Losing Strength
NVDA has been riding a strong multi-month uptrend, but the last few weekly candles show the first real slowdown. A clear CHoCH formed near the recent highs, and sellers stepped in aggressively. The weekly candle closed with a long upper wick and a heavier
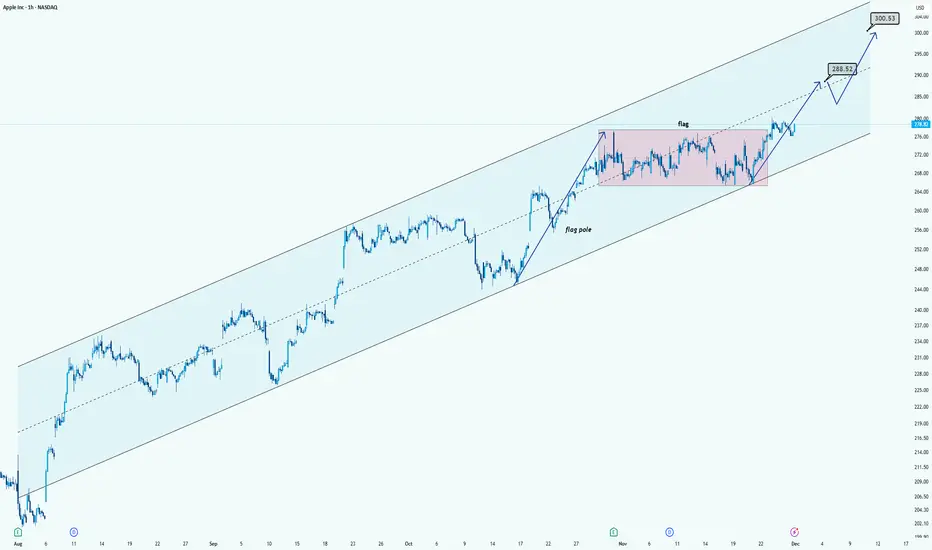
AAPL Chart AnalysisHi!
AAPL is trading inside a clean long-term ascending channel, showing a strong uptrend. Recently, the price formed a bullish flag (pink zone) after a sharp move up. The breakout above the flag signals continuation of the trend.
The chart projects two key upside levels:
$288.52 as the first tar
Amphenol has been a Momentum Powerhouse with a Strong UptrendAmphenol Corporation designs and builds high-performance connectors, cables, and interconnect systems for everything from communications and aerospace to automotive and industrial applications. Its products enable reliable, high-speed connectivity in demanding environments, and the company continues

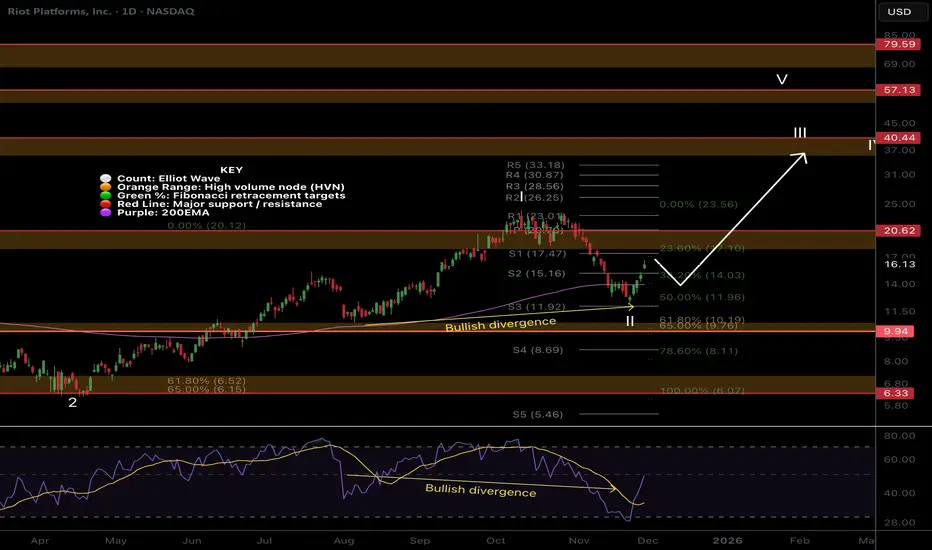
Riot Platforms, Inc. (RIOT)Company Overview
Riot Platforms, Inc. stands as a vertically integrated leader within the Bitcoin ecosystem. Its core operations are strategically divided into two synergistic segments:
Bitcoin Mining: This is the company's primary revenue driver, where Riot focuses on the relentless expansion of i
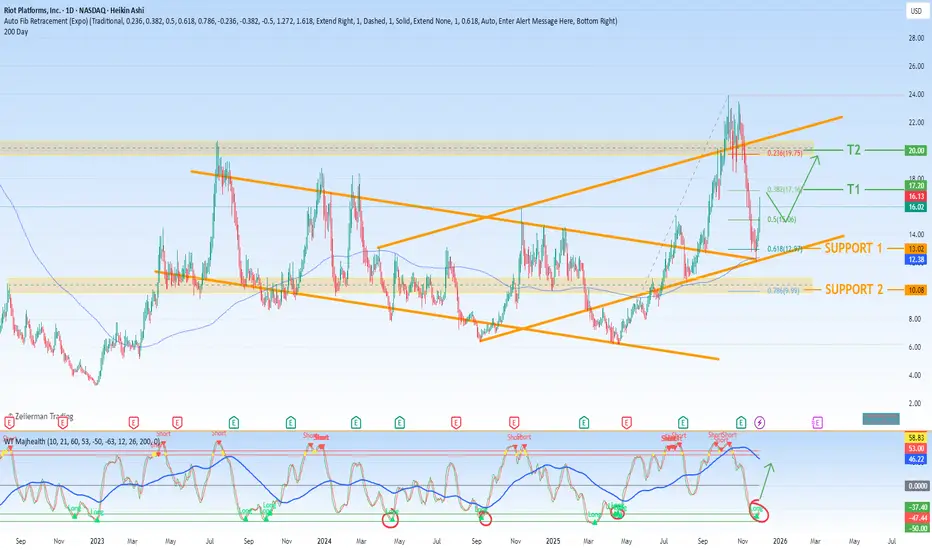
RIOT holding up stronger than the others..NASDAQ:RIOT Price remains in its uptrend and wave II of 3 appears complete with a 3 white knight bullish candle pattern.
Price recovered the daily 200EMA and looks rady for higher.
📈 Daily RSI hit oversold with bullish divergence
👉 Continued downside has a target of the High Volume Node, $10
Sa
AMD — Trying to Break the 50 MA, but GAP Still DominatesHello Everyone, Followers,
Happy Sunday to all.
I will share today some analysis to follow-up next week. First one is AMD:
AMD continues its battle around a critical technical zone.
After filling the October GAP, the price is now attempting to reclaim the 50-day MA (green line) — a key momentum s

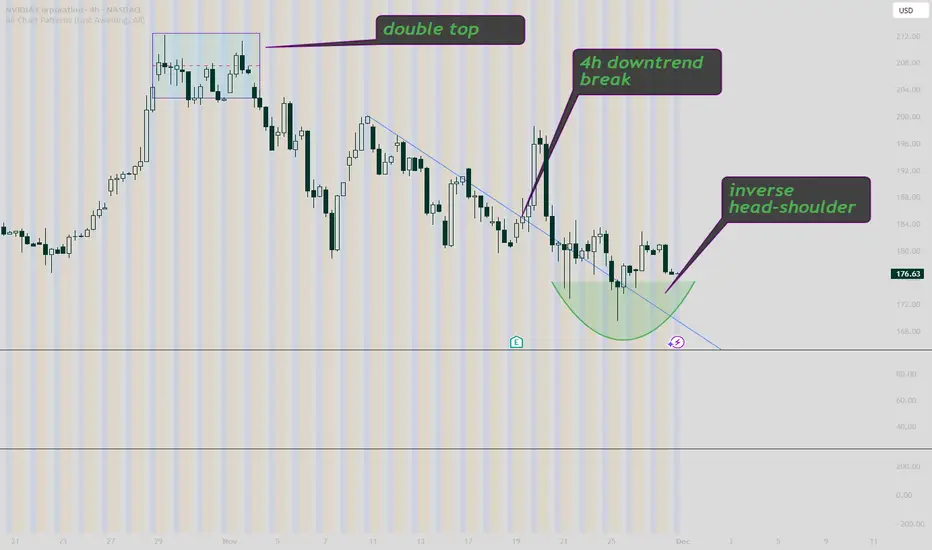
NVDA 4H TECHNICAL ANALYSIS NVDA has broken a downtrend triggered by a double top, and has now formed a inverse head and shoulders
NVO- Super Mega TrendOnce a life time oppurtunity for a mega company. I belive this megatran will work. althought there are few negative news for the company I belive they are just small problems

See all stocks ideas
Today
VERUVeru Inc.
Actual
—
Estimate
−0.37
USD
Today
ASYSAmtech Systems, Inc.
Actual
—
Estimate
−0.03
USD
Today
PLCEChildren's Place, Inc. (The)
Actual
—
Estimate
0.70
USD
Today
USAUU.S. Gold Corp.
Actual
—
Estimate
−0.13
USD
Today
TBHCThe Brand House Collective, Inc
Actual
—
Estimate
−0.42
USD
Today
NTRBNutriband Inc.
Actual
—
Estimate
−2.13
USD
Today
DLTHDuluth Holdings Inc.
Actual
—
Estimate
−0.46
USD
Today
MDBMongoDB, Inc.
Actual
—
Estimate
0.81
USD
See more events
Today
DTDTDt House Ltd.
Exchange
NASDAQ
Offer price
4.00 - 5.00
USD
Today
PPHCPublic Policy Holding Co. Inc.
Exchange
NASDAQ
Offer price
—
Today
HWEPHW ELECTRO Co. Ltd.
Exchange
NASDAQ
Offer price
—
Today
AIGOAigo Holding Ltd.
Exchange
NASDAQ
Offer price
4.00 - 6.00
USD
Today
E
ELCGELC Group Holdings Ltd.
Exchange
NASDAQ
Offer price
4.00 - 6.00
USD
Dec 5
R
RGNTRegentis Biomaterials Ltd.
Exchange
AMEX
Offer price
10.00 - 12.00
USD
See more events
Community trends
BTCUSD: Channel Momentum Points Toward $93,700 TargetHello everyone, here is my breakdown of the current Bitcoin setup.
Market Analysis
BTCUSD has shifted from a prolonged bearish phase into a clear bullish recovery after breaking out of the major downward channel. The price confirmed the end of the bearish structure once it broke above the descend

BITCOIN Two realistic bullish targets before Bear Cycle resumes?Bitcoin (BTCUSD) has more likely than not entered a new Bull Cycle, a subject that we've covered extensively over the past 2 months.
As discussed however, there is no reason not to expect technical rallies here and there, practically as we've shown those are quite common in the basic Bear Cycle str

Bitcoin Weakens After H&S Pattern: Next Stop, 89k?Hi!
It looks like price recently formed a pretty clean Head & Shoulders pattern on the 15m timeframe. The left shoulder, head, and right shoulder are all well-defined, and price has already broken beneath the neckline with a clear shift in structure. Momentum is leaning bearish.
The chart also sho

Bitcoin: Watch For Higher Low 85K Area.Bitcoin has bounced off of 80K while promising, the short term trend structure is still bearish. 95K and 100K are the next resistances and potential turning points respectively. IF price cannot break 100K or produce a higher low, it would be reasonable to anticipate a lower low (below 80K). A short
Bitcoin Only after breakout chanel resistance bull market again Soon we can expect price broke above channel resistance now it is near 93K$ and after that market will face huge gain only.
Step 1: Confirm the Breakout (The "Is It Real?" Check)
Don't buy the first tiny wick above the line. Wait for confirmation to avoid a false breakout:
Daily Close: W

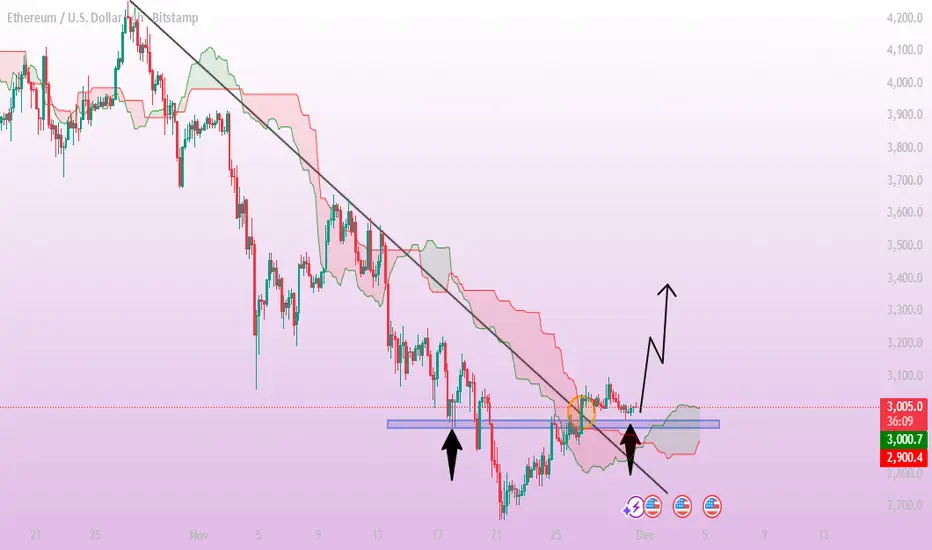
ETH/USD Long SetupThe Ethereum chart shows price moving above the downward trendline and stabilizing around a key zone marked on the chart. This area previously acted as an important level, and ETH is now holding above it, suggesting strength in the current structure. Price is also supported by the cloud, indicating
BTCUSD – Trend Shift, BOS Confirmation & Fib Reaction ZonesBitcoin has completed a clean structure transition from a strong downtrend into a confirmed uptrend, marked by multiple CHoCH and BOS levels. After tapping the Fib retracement zone, price reacted strongly and created a new swing high.
Currently, BTC is consolidating near 91,000, showing signs of ex

What IsThe Rebuy Range For The COAI ? (4H)⚠️ First of all, note that this coin is highly volatile and risky, so don’t forget to manage your position size, leverage, and risk.
⚠️ Considering the number of wave extensions and irregular candling, this coin doesn’t have a single scenario, but the scenario on the chart is the most probable one.

Bitcoin Eyes Technical Pullback Before Next Upward MoveHello everyone,
Bitcoin is pausing after a rebound from the 86,000 USD area, but upward momentum faces resistance around 92,000 USD—where a red FVG, old supply zones, and heavy volume converge. Every approach to this area triggers downward pressure, producing red candles near supply zones, showing

BTC Buyers Hold Control — Targeting $95,700 Resistance RetestHello traders! Here’s my technical outlook on BTC/USD based on the current market structure. After breaking out of the Buyer Zone near $86,400–$88,000, the price entered a sustained upward channel, forming higher highs and higher lows along the Support Line. However, BTC recently approached the Resi

See all crypto ideas
Gold Slows at Channel Top — Market Targets 4,150 Before Move UpHello traders! Here’s my technical outlook on XAU/USD based on the current market structure. After breaking out of the broader consolidation phase, gold continued to move within a rising channel, forming consistent higher highs and higher lows along the Support Line. Buyers maintained strong momentu

Gold idea Gold (XAU/USD) is respecting the rising support trend line and continues to push upward. Price is holding above 4215, showing bullish momentum. A breakout toward the resistance zone targets the 4300 level, where the next major reaction is expected.

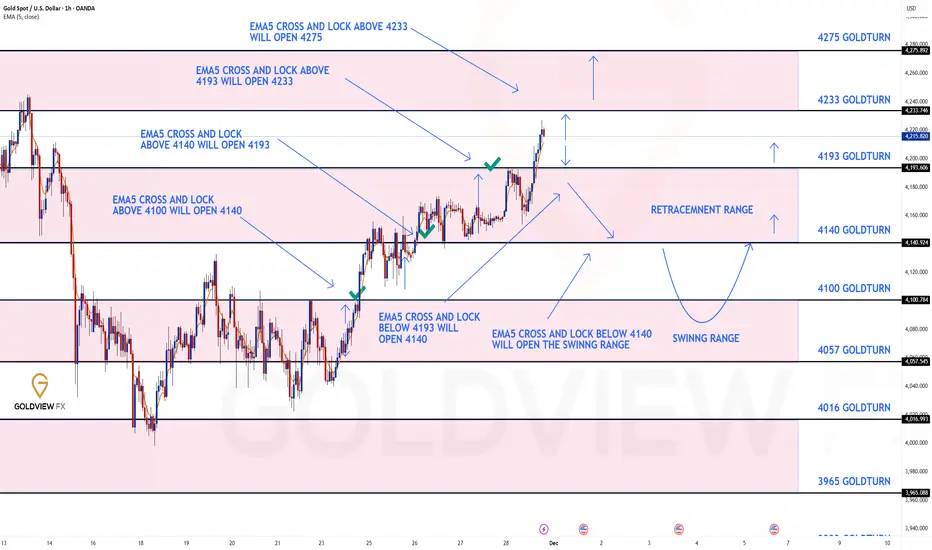
GOLD 1H CHART ROUTE MAP UPDATE & TRADING PLAN FOR THE WEEKHey Everyone,
Please see our 1h chart levels and targets for the coming week, which is still active and in play.
We are seeing price play between two weighted levels with a gap above at 4233 which is locked and a gap below at 4193 as support. We will need to see ema5 cross and lock on either weigh
XAUUSDHello Traders! 👋
What are your thoughts on GOLD?
Gold is once again moving toward its previous all-time high after completing a corrective move.
While the medium-term and long-term outlook remains bullish, we do not expect gold to break into new highs in the short term.
The current upward movement

Lingrid | GOLD Weekly Analysis: Breakout Confirmed, What’s Next?OANDA:XAUUSD concluded a week by breaking above the key levels and reclaiming the $4,200, signaling a continuation of bullish momentum after a period of compression. This breakout from the consolidation pattern suggests that buyers have regained control and are pushing price toward the November hig

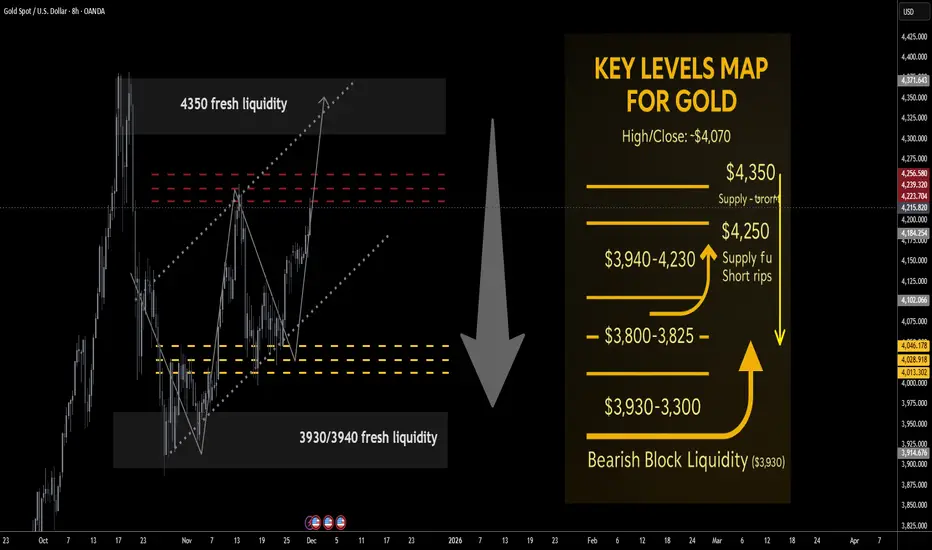
Gold next week Key S/R Levels and Outlook for Traders🔥 GOLD WEEKLY SNAPSHOT — BY PROJECTSYNDICATE
🏆 Swing High / Swing low:
$4,350 → ~$3,930 — clean rejection from the $4,350 bear-liquidity pocket, weekly close back inside prior range and below $4.1k.
📈 Trend:
Structural uptrend still intact above ~$3,900, but near-term momentum has flipped di
XAU/USD) Bullish trend analysis Read The captionSMC Trading point update
Technical analysis of XAUUSD Trade Idea Breakdown (1H Chart)
Your chart reflects a Smart Money Concepts (SMC) + Fibonacci retracement + liquidity sweep model.
The idea is well-structured and follows a typical pullback → mitigation → expansion sequence.
---
1. Current

XAUUSD Market Outlook — Targets AheadThe XAUUSD chart shows price reacting strongly from a major resistance zone highlighted by the blue area, where price has previously reversed. After retesting this resistance again, price formed a rejection candle, signaling a potential short-term pullback. The market is still respecting the ascendi

Bonus Gold long Week 01 DecemberVery simple Gold long for week 01 December.
Trade based on Fibonacci levels on the 4 hour chart.
i have added 2 TP first for 750 pips and full TP for over 1000 pips/
With these trades it is recommended to just use small lot size and be prepared to hold in drawdown .
not to be considered financial

THE KOG REPORTTHE KOG REPORT:
In last week’s KOG Report we said we would be looking either price to push up into our red box and give us a short, or, price to attempt that 4040 level and bounce, giving us the opportunity to go long. We got in on that long, and then just carried it for most of the week, resultin

See all futures ideas
USD/JPY - H4 - Breakdown Watch!(29.11.2025)📝 Technical Description FX:USDJPY
USD/JPY has been moving inside a clean ascending channel on the H4 timeframe.
Price is now sitting inside the Reversal Zone, struggling to break above the channel’s mid-line resistance. A bearish correction is possible if the market fails to reclaim the upper zo

EURUSD Long: Channel Support Intact, Path Open Toward 1.1625Hello, traders! EURUSD is trading within a developing ascending channel, where price action continues to respect both the higher lows and the upper boundary of the structure. This upward movement formed after buyers defended the Demand Zone around 1.1550, which acted as a strong pivot area and trigg

GBP/JPY: Mild Growth in the Short TermGBP/JPY is currently showing a mild uptrend, supported by both macroeconomic and technical factors. With expectations that the Fed will lower interest rates in the near future, the low-interest-rate environment is helping GBP strengthen against JPY. The Japanese yen remains weak due to BoJ's easing

Can USDJPY Break the 157.9 Barrier This Week?💶 USDJPY – Weekly Smart Money Outlook | 30/11 | by Ryan_TitanTrader
📈 Market Context
• Price remains supported inside a 4H bullish trendline, showing multiple BOS footprints from the lower structure.
• The pair has delivered strong upside displacement but is now compressing near highs, forming a cle

NZDCAD: Watch this Key Support reactionPrice has been in a steady downtrend for a long while, respecting that descending trendline over and over again. Every touch was sold off, until recently. When price reached a key support zone and sent price back upward. The reaction from that area is visibly strong.
We then got a clean breakout a

GBPUSD Potential UpsidesHey Traders, in tomorrow's trading session we are monitoring GBPUSD for a buying opportunity around 1.32000 zone, GBPUSD is trading in an uptrend and currently is in a correction phase in which it is approaching the trend at 1.32000 support and resistance area.
Trade safe, Joe.

EUR/USD) Bullish trend analysis Read The captionSMC Trading point update
Technical analysis of explanation of the EUR/USD 1H analysis idea shown in your chart:
---
Bullish Setup Explanation
The chart illustrates a potential bullish continuation setup after a corrective retracement.
Key Observations
Price recently showed a strong bulli

EURUSD : Mid-Term Bullish ScenarioEURUSD is developing a progressive bullish structure on the 4-hour timeframe, with price action continuing to build momentum after completing its recent corrective phase. The current outlook highlights a potential continuation pattern that may guide the pair toward the next upside zone as long as mo

Double Top Reversal – Clean Sell Setup on EUR/USDPrice tapped into a strong resistance zone and formed a clear **double-top pattern**, showing rejection on both attempts to break higher. After the second touch, bearish momentum entered the market, giving a clean **sell setup** with a tight stop-loss placed above the highs.
The target is set at th

EURUSD: Sellers Target Move Toward 1.15200 SupportHello everyone, here is my breakdown of the current EURUSD setup.
Market Analysis
EURUSD continues to trade within a corrective market structure after a strong bullish impulse that formed an Upward Channel earlier in the month. Once price broke below that channel, the pair shifted into a broader

See all forex ideas
| - | - | - | - | - | - | - | ||
| - | - | - | - | - | - | - | ||
| - | - | - | - | - | - | - | ||
| - | - | - | - | - | - | - | ||
| - | - | - | - | - | - | - | ||
| - | - | - | - | - | - | - | ||
| - | - | - | - | - | - | - | ||
| - | - | - | - | - | - | - |
Trade directly on the supercharts through our supported, fully-verified and user-reviewed brokers.


