GME: Bearish StructureAt $22.29, GME is not a dip. It’s a falling knife!
A close below $21.50 could trigger stop-loss cascades.
The combination of:
Bearish Patterns, broken trendline, low volume
Dilution overhang
Crypto beta risk (BTC proxy)
No growth narrative
Do your own research and trade at your own risk.

Meta long Meta dumped on earnings because of a one time tax event. I have long been following this company and have missed obvious setups multiple times. We are right at the .5 fib. This megaphone was drawn on the monthly chart but I zoomed in to show the swing trade setup I am looking at.
We note a basing O

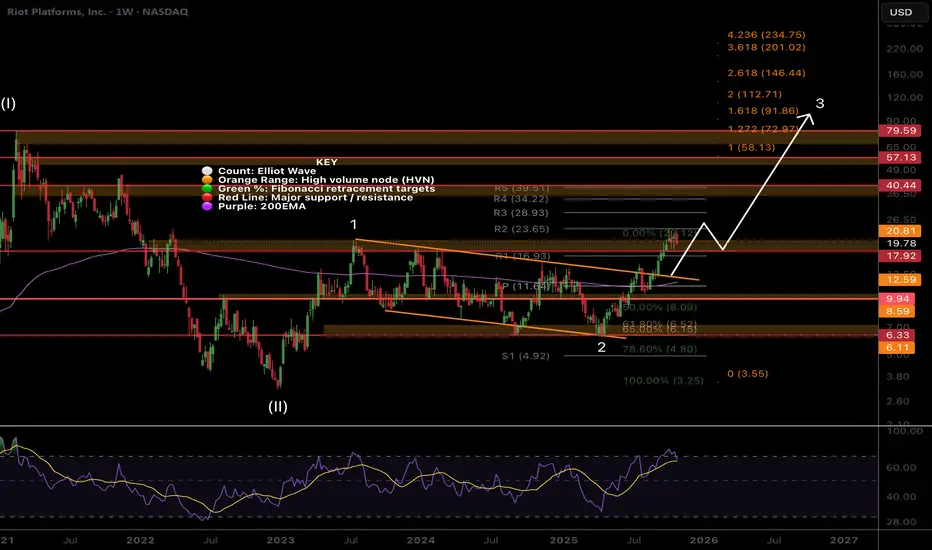
RIOT, nothing changed, Higher...Riot is another low cap volatile asset that keeps people afraid with its wild swings as I am seeing panic in my comments across platforms.
Price remains in momentum breaking out of the channel in a wave 3 with a minimum target of the 1.618 Fibonacci extension at $91, a 4x from here. Wave 2 complete
NVDA How to become successful in forex and stock trading:
1.Master fundamentals and technical analysis.
2.Build and follow a solid trading plan.
3.Apply strict risk management (4–6% rule).
4.Stay disciplined—control fear and greed.
5.Record and analyze every trade.
6.Focus on high-quality setups only.
7.

Nvidia Daily Outlook!NVDA is in an uptrend! Those who are already holding the stock can use $200 as a stop loss for short-term traders. Long-term traders can use $176 as a stop loss if the price falls below $176, it breaks below the short-term channel, which could push the price down first to the 200-day EMA(156.50$)

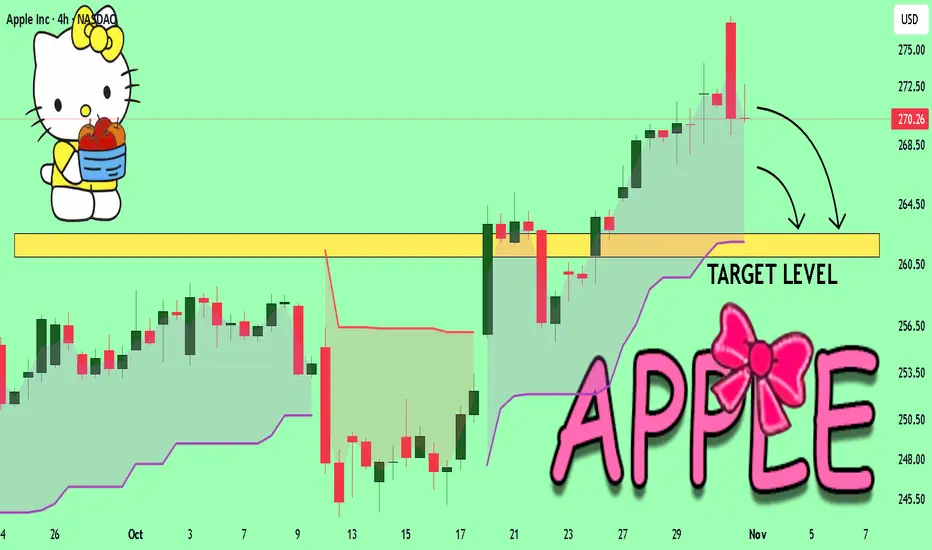
APPLE Set To Fall! SELL!
My dear subscribers,
APPLE looks like it will make a good move, and here are the details:
The market is trading on 270.26 pivot level.
Bias - Bearish
Technical Indicators: Both Super Trend & Pivot HL indicate a highly probable Bearish continuation.
Target - 262.56
About Used Indicators:
The
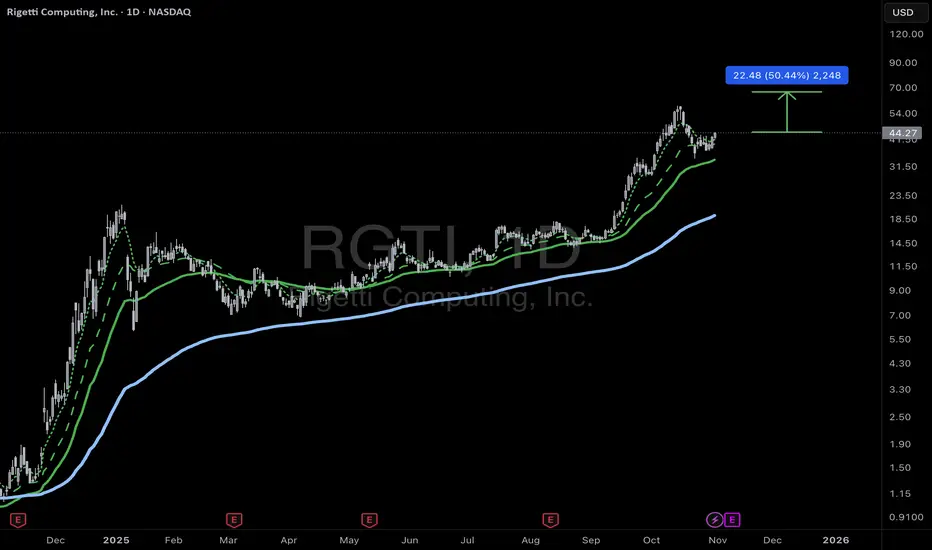
RGTI - quantum computing on the move?Rigetti RGTI beginning a 50% move? New technology requires more and more computing power. Quantum computing is the next frontier. Is the risk work the return?
PLTR: Earnings week!My thoughts on PLTR into earnings!
Hope you find it helpful, but as always not advice!
Safe trades everyone and enjoy your weekend!
S(t) = E f_t]
(new pretentious signature ;))

Buy when its still CHEAPClassic Cup-and-Handle Breakout NASDAQ:SOFI
The chart is showing a textbook cup-and-handle pattern, one of the strongest bullish continuation signals in technical analysis. SoFi pushed through years of long-term resistance with surging volume, then consolidated neatly at highs (the “handle”)—the

Amazon (AMZN): Ready for a New Breakout!Amazon isn’t just delivering packages — it’s delivering earnings surprises and a chart breakout too! 😎
After reporting strong Q3 earnings on 30 Oct 2025 , AMZN’s chart popped with a clean cup & handle breakout on 31 Oct 2025 — just in time for a bullish Halloween rally 🎃🐂
💰 Earnings Highligh

See all popular ideas
Community trends
Stock collections
All stocksTop gainersBiggest losersLarge-capSmall-capLargest employersHigh-dividendHighest net incomeHighest cashHighest profit per employeeHighest revenue per employeeMost activePre-market gainersPre-market losersPre-market most activePre-market gapAfter-hours gainersAfter-hours losersAfter-hours most activeUnusual volumeMost volatileHigh betaBest performingHighest revenueMost expensivePenny stocksPink sheetOverboughtOversoldAll-time highAll-time low52-week high52-week lowSee all
Tomorrow
MDPediatrix Medical Group, Inc.
Actual
—
Estimate
0.47
USD
Tomorrow
LLoews Corporation
Actual
—
Estimate
—
Tomorrow
LQDALiquidia Corporation
Actual
—
Estimate
−0.39
USD
Tomorrow
IIIInformation Services Group, Inc.
Actual
—
Estimate
0.04
USD
Tomorrow
IDXXIDEXX Laboratories, Inc.
Actual
—
Estimate
3.14
USD
Tomorrow
FRPTFreshpet, Inc.
Actual
—
Estimate
0.42
USD
Tomorrow
KTBKontoor Brands, Inc.
Actual
—
Estimate
1.36
USD
Tomorrow
DYNDyne Therapeutics, Inc.
Actual
—
Estimate
−0.84
USD
See more events
Sector 10 matches | Today | 1 week | 1 month | 6 months | Year to date | 1 year | 5 years | 10 years |
|---|---|---|---|---|---|---|---|---|
| Technology Services | ||||||||
| Electronic Technology | ||||||||
| Finance | ||||||||
| Health Technology | ||||||||
| Retail Trade | ||||||||
| Producer Manufacturing | ||||||||
| Consumer Non-Durables | ||||||||
| Consumer Durables | ||||||||
| Energy Minerals | ||||||||
| Consumer Services |