SUI is on the verge of another rally (4H)From the point where we marked the green arrow on the chart, a bullish phase has started on SUI. This area acted as a key reaction zone where buyers stepped in decisively, shifting market sentiment from corrective to bullish.
Based on the current price structure, it appears that we are developing a

The best trades require research, then commitment.
Get started for free$0 forever, no credit card needed

Scott "Kidd" PoteetThe unlikely astronaut

Where the world does markets
Join 100 million traders and investors taking the future into their own hands.

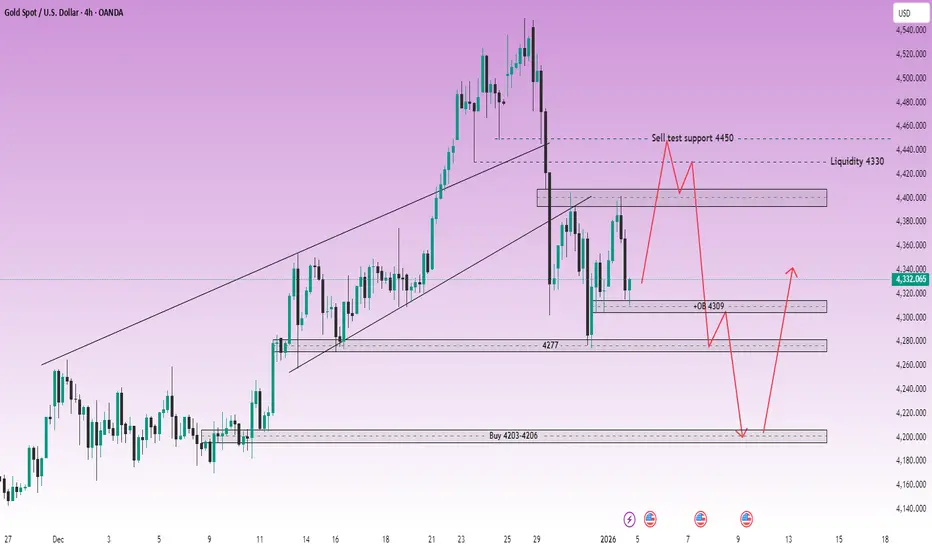
XAUUSD (H4) – Monday SetupGeopolitical shock risk, gold may spike | Trade liquidity and reaction zones only
Quick summary
News around Trump’s claim that Maduro has been detained, plus Venezuela’s response (they don’t know his and his wife’s whereabouts and are demanding proof of life), raises geopolitical uncertainty sharpl
ETHBTC W Pattern Makes the Case for a Macro Bull MarketIt seems pretty clear to me that ETHBTC is in a multi year W pattern. The higher low on the W, with hidden bullish divergence helps confirm the pattern, as does the recent price action.
From April to May of 2025 price consolidated in a low and then surged to a local high in August when it the oran

BTC/Gold A Simple Signal That Has Worked Only 4 Times in HistoryThe BTC/XAU (monthly) chart has produced only four clear local bottom signals throughout its entire history.
This is a deliberately simple, noise-free setup. No indicators overload, no short-term speculation—just relative strength between Bitcoin and gold.
Each of these historical bottom zones mar

Gold Bullish Outlook | Dollar Weakness & Geopolitical Risks!Hey Traders,
In the coming week, we are closely monitoring XAUUSD (Gold) for a potential buying opportunity around the 4,280 zone. Gold remains in a strong bullish trend and is currently undergoing a healthy corrective pullback, approaching a key trendline confluence and 4,280 support & resistance

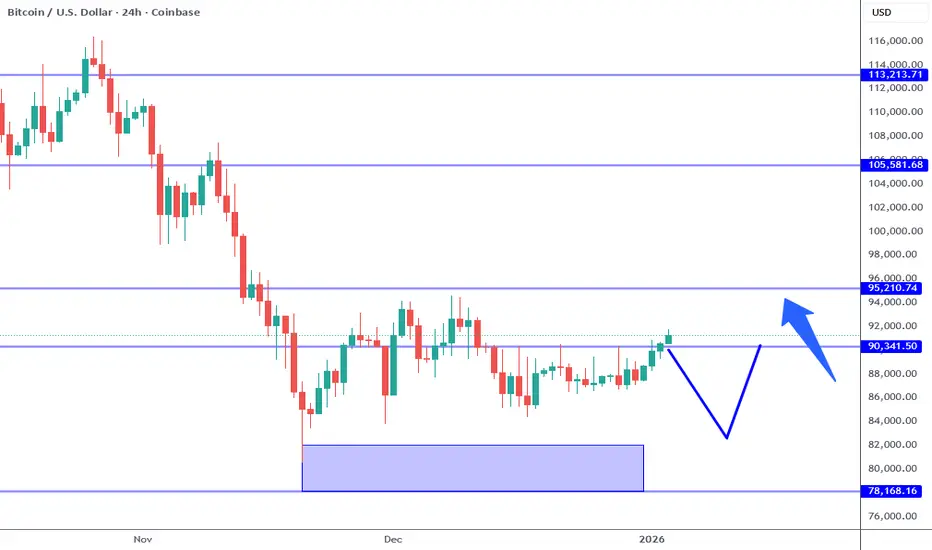
2025 Ends With a Breakout?Year Ends With a Breakout, yes!🚀📈
Bitcoin just delivered what the market was waiting for — a clean breakout back into the channel 🎯
This is how we close the year… with intent.
Key Technicals:
• Major support holding at 88,273 – 88,535
• ATA 200 support confirmed
• Price reclaimed the channel

Gold Costs 175 Hours Of Work To BuyI like to price everything I buy in hours of work.
That’s the only price that actually matters.
Money can be replaced. Time can’t. When I look at a purchase in terms of how much of my life it costs, it becomes instantly clear whether it’s worth it.
My kids hate me for it because their view is that

JPM — Bullish Channel at Decision PointTechnical Overview
• Price is moving inside a well-defined ascending channel
• Currently testing the upper channel resistance
• Trend remains bullish as long as price holds above the channel midline & SMA
Bullish Scenario
• Confirmation: Strong daily close above the channel top (~330)
• Tar

Silver Price Surpasses $80 for the First Time.Silver Price Surpasses $80 for the First Time. Why Could This Be a Bearish Sign?
As the XAG/USD chart shows, earlier this morning the price of one ounce of silver reached above $83 for the first time. However, this move was followed by an abnormally sharp reversal to the downside.
Why Did the S

Silver’s 2025 Explosion — How High Can It Go?In 2025, Silver ( OANDA:XAGUSD ) has experienced a remarkable surge, making it one of the most notable assets of the year. As we approach the end of 2025, I’ve decided to analyze silver to see how far its bullish trend might continue. So, stay with me as we delve into the reasons behind silver’s ri

See all editors' picks ideas
Arbitrage Detector [LuxAlgo]The Arbitrage Detector unveils hidden spreads in the crypto and forex markets. It compares the same asset on the main crypto exchanges and forex brokers and displays both prices and volumes on a dashboard, as well as the maximum spread detected on a histogram divided by four user-selected percenti

Multi-Distribution Volume Profile (Zeiierman)█ Overview
Multi-Distribution Volume Profile (Zeiierman) is a flexible, structure-first volume profile tool that lets you reshape how volume is distributed across price, from classic uniform profiles to advanced statistical curves like Gaussian, Lognormal, Student-t, and more.
Instead of forcin

Multi-Ticker Anchored CandlesMulti-Ticker Anchored Candles (MTAC) is a simple tool for overlaying up to 3 tickers onto the same chart. This is achieved by interpreting each symbol's OHLC data as percentages, then plotting their candle points relative to the main chart's open. This allows for a simple comparison of tickers to tr

Vdubus Divergence Wave Pattern Generator V1The Vdubus Divergence Wave Theory
10 years in the making & now finally thanks to AI I have attempted to put my Trading strategy & logic into a visual representation of how I analyse and project market using Core price action & MacD. Enjoy :)
A Proprietary Structural & Momentum Confluence System

Per Bak Self-Organized CriticalityTL;DR: This indicator measures market fragility. It measures the system's vulnerability to cascade failures and phase transitions. I've added four independent stress vectors: tail risk, volatility regime, credit stress, and positioning extremes. This allows us to quantify how susceptible markets are

Volatility Risk PremiumTHE INSURANCE PREMIUM OF THE STOCK MARKET
Every day, millions of investors face a fundamental question that has puzzled economists for decades: how much should protection against market crashes cost? The answer lies in a phenomenon called the Volatility Risk Premium, and understanding it may fundam

Volume Gaps & Imbalances (Zeiierman)█ Overview
Volume Gaps & Imbalances (Zeiierman) is an advanced market-structure and order-flow visualizer that maps where the market traded, where it did not, and how buyer-vs-seller pressure accumulated across the entire price range.
The core of the indicator is a price-by-price volume prof

Match Finder [theUltimator5]Match Finder is the dating app of indicators. It takes your current ticker and finds the most compatible match over a recent time period. The match may not be Mr. right, but it is Mr. right now. It doesn't forecast future connection, but it tells you current compatibility for today.
Jokes aside,

Trend Line Methods (TLM)Trend Line Methods (TLM)
Overview
Trend Line Methods (TLM) is a visual study designed to help traders explore trend structure using two complementary, auto-drawn trend channels. The script focuses on how price interacts with rising or falling boundaries over time. It does not generate trade sign

Breakouts & Pullbacks [Trendoscope®]🎲 Breakouts & Pullbacks - All-Time High Breakout Analyzer
Probability-Based Post-Breakout Behavior Statistics | Real-Time Pullback & Runup Tracker
A professional-grade Pine Script v6 indicator designed specifically for analyzing the historical and real-time behavior of price after strong All-Ti

See all indicators and strategies
Community trends
Bakkt Holdings, Inc. 400% move? - January 2026
Timeframe : Weekly
Core Thesis BKKT has been in a punishing downtrend since October. However, the weekly chart now shows the first tentative signs of seller exhaustion and structural improvement, forming a sequence of higher lows (HL) and a higher highs (HH). We are monitoring the current pullb

XOM: Winners of the Venezuelan Oil-Poker!Hello There,
in the past days we have witnessed spectacular events that will be historically determining for the oil market and oil company stocks. One of the largest oil reserves country Venezuela changed from a socialist government to a state under U.S. influence. Since the government changed the

TSLA: Pullback Into Trendline Support — Key Level in FocusHello Everyone, Followers,
I am back :) . Happy new year to all.
We started the trading year on Friday and from my side it was a good and green day. My portfolio gain is approx %1.2 , I consider it as a good start.
But now as always Trump changed everthing and I am very curious about pre-market

Like a Bus Ride - SMCI Super Micro - Paid Upfront - I will say it again - SMCI Super Micro -
Super Micro Computer Inc - On Dec 29, Entered Into Credit Agreement - SEC Filing
Jan 2, 2026, 17:08 GMT-5 RefinitivLess than 1 min read - fixed the bleeding every time a new project comes Up - inbet the credit line into the pricing - and get paid upfront -

Insulet Corporation (PODD)Insulet Corporation (PODD): A Strong Buy Anchored by Platform Dominance, Strategic Execution, and Robust Financials
Insulet Corporation (PODD), a leader in innovative insulin delivery systems, is strategically positioned for sustained growth in the coming quarters. The company’s trajectory is being

NVDA – Fundamentals Stay Strong📊 NVDA – Fundamentals Stay Strong
NVIDIA continues to sell more chips as AI infrastructure demand accelerates.
Data center growth remains the key driver, keeping NVDA positioned as a market leader.
📈 Strong long-term trend
🔥 AI demand not slowing
💡 Worth watching for pullbacks or continuation setu

take a looknotice at the bottom when the purple crosses the gold in the RSI in relation to the candles... just saying, i can only post 15 minute max but watch the 1 minute normally. Anyone notice a pattern? wink

$MP – Swing Setup Base forming above $55. Momentum turning up.
Risk below $54.
Initial Target $66-72
Watching for volume confirmation.
#MP #SwingTrade #TechnicalAnalysis #RareEarths

A Massive Intersection Approaching See where a major downtrend broke support and upper bound of the subsequent uptrend respected it; it got rejected exactly there. But now, the time component has been increasingly kicking in a confluence effect; forming a subtle wedge which closes on Jan 26. I am expecting a dramatic move in the thir

Amd - This correction is not over yet!🤬Amd ( NASDAQ:AMD ) can still drop another -30%:
🔎Analysis summary:
2025 has been an incredible - yet expected - year for Amd. And now, Amd is literally just perfectly rejecting the overall resistance trendline. Looking at higher timeframe structure, Amd is still not done with the drop and ca

See all stocks ideas
Today
PKEPark Aerospace Corp.
Actual
—
Estimate
—
Today
HURCHurco Companies, Inc.
Actual
—
Estimate
—
Today
LFCRLifecore Biomedical, Inc.
Actual
—
Estimate
−0.14
USD
Today
ANGOAngioDynamics, Inc.
Actual
—
Estimate
−0.10
USD
Today
PENGPenguin Solutions, Inc.
Actual
—
Estimate
0.44
USD
Today
AIRAAR Corp.
Actual
—
Estimate
1.03
USD
Tomorrow
CALMCal-Maine Foods, Inc.
Actual
—
Estimate
1.95
USD
Tomorrow
MSMMSC Industrial Direct Company, Inc.
Actual
—
Estimate
0.95
USD
See more events
No scheduled reports
Community trends
BTCUSDT Long: Uptrend Continues Toward 94,500 ResistanceHello traders! Here’s a clear technical breakdown of BTCUSDT (4H) based on the current chart structure. BTCUSDT initially traded within a well-defined descending channel, reflecting sustained bearish pressure during that phase. This move ended with a clear pivot point, followed by a strong breakout

BTCUSD is heading towards 94K for a retest...
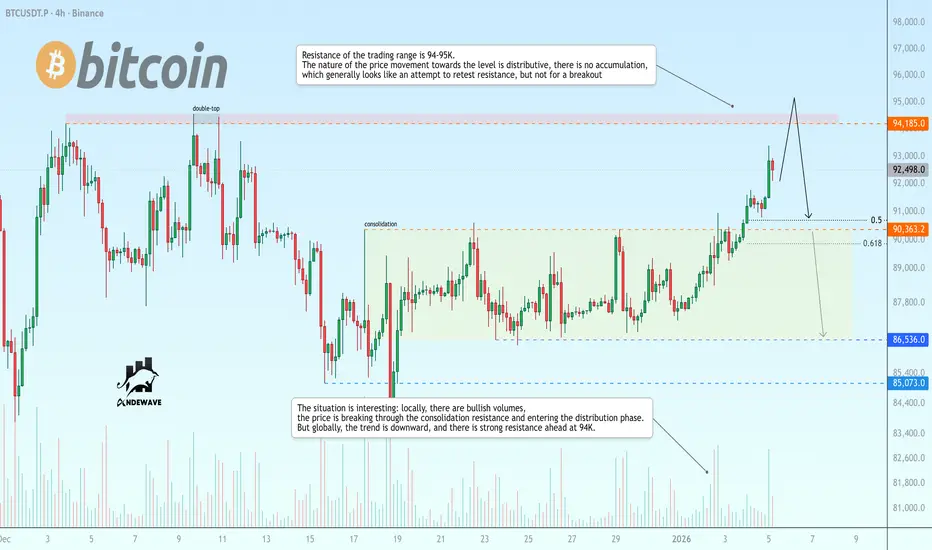
The situation is interesting: locally, there are bullish volumes, the price is breaking through the consolidation resistance and entering the distribution phase. However, globally, the trend is downward, and there is strong resistance ahead at 94K.
Resistance of the trading range is 94-95K. The n
Bitcoin is completing a bullish triangle (12H)Since we marked the red arrow on the chart the price has entered a bearish phase
This phase appears to be a complex correction likely a double structure as we can observe an ABC plus X wave followed by a triangle formation
We are currently at the end of the second corrective wave with only one wav

Bitcoin - Range High Pressure, Expansion or Rejection AheadHappy New Year everyone 🎉
I hope you all had a great start to the year. I have been offline for a while due to holidays and some personal stuff, but I am back and ready to start posting trade ideas again. Let’s kick things off with a fresh look at Bitcoin based on the chart I shared.
Market Overvi

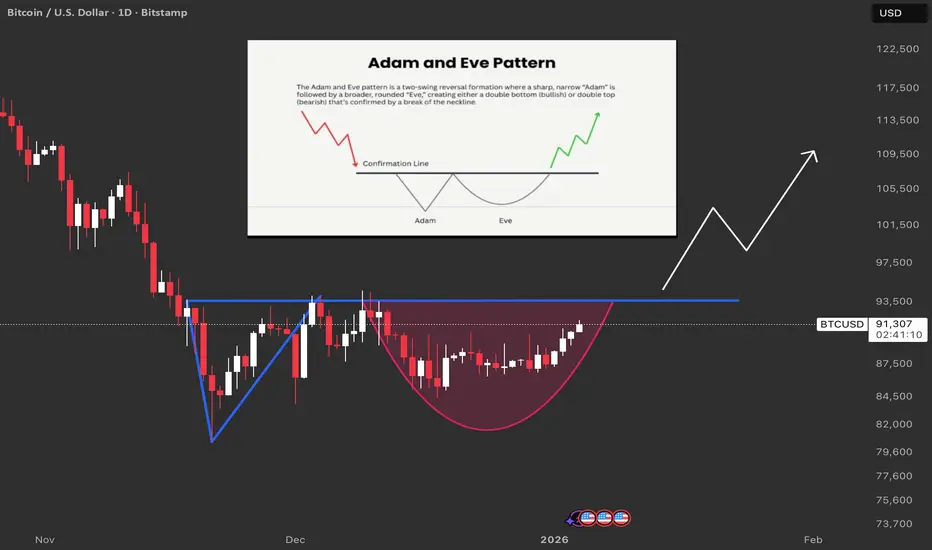
Bitcoin: Adam & Eve Double BottomWhat this pattern shows
- Adam & Eve is a double-bottom reversal pattern: first a sharp V‑shaped low (Adam), then a wider rounded low (Eve)
- It usually forms after a downtrend and signals potential bullish reversal once resistance (neckline) breaks.
Neckline and breakout level
- As long a
Bitcoin recovers, set to move back above $100,000Bitcoin just hit the highest price since the bearish breakdown, we have a local uptrend, a technical confirmation of the relief rally and recovery.
First, we used the chart signals to predict a reversal and relief rally. Now, it is confirmed based on Bitcoin's price action. We have higher highs and
BTCUSDT: Sellers Defend 91,800 as Bullish Momentum WeakensHello everyone, here is my breakdown of the current BTCUSDT setup.
Market Analysis
BTCUSDT spent a significant period trading inside a well-defined range, where price oscillated between clear support and resistance levels, showing indecision and balanced participation from both buyers and sellers

Bitcoin Pumps With Gold & S&P — But Is a Pullback Coming First?Bitcoin ( BINANCE:BTCUSDT ) started the new week with bullish momentum, pumping alongside Gold( OANDA:XAUUSD ) and the SPX500 Index( SP:SPX ).
At the moment, Bitcoin is trading within a resistance zone($94,840-$93,020), close to the upper line of the ascending channel, while also moving around the

Bitcoin Consolidation Bearish momentumBitcoin is currently moving in a sideways range, and the overall price action shows weakness near the upper area of this range. Although price recently pushed higher, the move looks unstable and lacks strong buying momentum, which increases the risk of a false breakout.\
Technically Bitcoin Price a

Bitcoin: Next Stop 95K?Bitcoin has held the 88K area support and is now attempting to push into the 95K key resistance. Can the momentum continue? That's up to Bitcoin to decide. Our job is to evaluate the price action for further evidence of momentum or not. From this point we can assess risk and figure out if an opportu
See all crypto ideas
GOLD - The battle for 4400. Will the growth continue?FX:XAUUSD starts the week of 2026 with a rise of more than 1.5%, staying above $4,400 amid escalating geopolitical tensions in Latin America
Geopolitical crisis: US-Venezuela, Donald Trump threatened new military intervention if the interim government does not comply with Washington's demands.

XAUUSDHello Traders! 👋
What are your thoughts on GOLD?
After a strong bullish rally, Gold has entered a range-bound consolidation phase between clearly defined support and resistance zones.
At the moment, price is trading within the range, and positions taken in the middle of the range carry elevated r

XAUUSD Buyers Step In at Key Level - Momentum StabilizesHello traders! Here’s my technical outlook on XAUUSD (1H) based on the current chart structure. Gold is trading within a broader bullish structure after a strong impulsive rally from lower levels. Earlier, price moved inside a consolidation range, signaling accumulation before breaking out to the up

XAU/USD Strength Builds After Trendline Break, Bulls Eye Higher The XAU/USD 45-minute chart shows a clear shift from bearish pressure to emerging bullish momentum. Price previously respected a descending trendline and formed a strong base near the lower demand zone, where buyers stepped in aggressively. After multiple rejections from the lows, gold broke above s

XAUUSD: Inverse Head & Shoulders from Flip Area Hi,
🧩 Pattern: Inverse Head & Shoulders
📍 Key Zone: Flip area (former resistance → support)
📈 Trend: Bullish (ascending trendline intact)
🔹 Gold pulled back into the flip area, respected it as support, and formed an Inverse Head & Shoulders
🔹 This structure suggests trend continuation, not a rever

XAUUSD: Buyers Defend Support, Retest of 4,490 ResistanceHello everyone, here is my breakdown of the current XAUUSD setup.
Market Analysis
Gold previously traded under pressure near a descending triangle resistance line, where price action was compressed before buyers stepped in. After forming a solid base, XAUUSD broke above the triangle resistance an

GOLD (XAUUSD) — Buy From Support | Targets 4,452 → 4,600Gold is currently holding above a strong demand zone after a healthy pullback within a bullish market structure. Price has respected this support multiple times, suggesting seller weakness and potential absorption.
A move toward the resistance area around 4,452 is expected.
If price breaks and holds

XAUUSD – Geopolitical Rally, Market Near Trend ConfirmationHello everyone, this is Domic.
During the Asian session, gold rebounded sharply from the 4.33x area to above 4.39x, signaling a clear return of defensive flows after news that the US launched a military operation in Venezuela and detained President Maduro. Although the military action itself has c

XAUUSD 30M – Support Hold & Bullish Recovery SetupPrice is reacting from a well-defined support zone around 4,310–4,330, showing signs of a short-term bullish recovery
A break and close above 4,360–4,380 can confirm upside momentum toward the first TP near 4,395–4,400
Sustained strength above 4,415 opens the path toward the main target at 4,450–4,4

GOLD 1H CHART ROUTE MAP UPDATE & TRADING PLAN FOR THE WEEKHey Everyone,
Please see our 1h chart levels and targets for the coming week.
We are seeing price play between two weighted levels with a gap above at 4346 and a gap below at 4310, as support. We will need to see ema5 cross and lock on either weighted level to determine the next range.
We will se

See all futures ideas
EURUSD Breakdown Confirmed, 1.1640 Support in FocusHello traders! Here’s my technical outlook on EURUSD (2H) based on the current chart structure. EURUSD initially traded within a well-defined ascending channel, showing a strong bullish structure with higher highs and higher lows after the market started to grow from the lower levels. This bullish p

EURUSD Short: Supply Holds Strong - Market Eyes 1.1680 DemandHello traders! Here’s a clear technical breakdown of EURUSD (3H) based on the current chart structure. EURUSD is trading within a broader bullish structure, supported by a well-defined ascending trend line that has guided price higher from the previous pivot low. Earlier, the market spent time conso

AUDUSD Potential Bullish Bias | 0.66500 Support + USD Weakness!Hey Traders,
In today’s trading session, we are closely monitoring AUDUSD for a potential buying opportunity around the 0.66500 zone. AUDUSD remains in a well-established uptrend and is currently experiencing a healthy corrective pullback, approaching a key trendline confluence and the 0.66500 supp

EURUSD Institutional Levels: Short Premium 1750–1800 → 1600🔱 EURUSD WEEKLY SNAPSHOT — EXECUTIVE SUMMARY
✨ EURUSD positioned in a corrective bearish structure (distribution → continuation)
🔴 Primary sell impulse: 1.1800 → 1.1600 confirms bearish control
🔄 Current price action: corrective rallies (sell-the-rip environment)
🧱 Institutional sell zone: 1.1750

USD/JPY | Higher and higher! (READ THE CAPTION)As you can see in the hourly chart of USDJPY, the week started for it by opening in the FVG, at 156.756 level. However, it went on to make it out of the FVG once more and broke through the supply zone, going as high as 157.300 and inside the FVG, before dropping back to the supply zone and hitting t

EURJPY - Correction (hunting for liquidity) before growthFX:EURJPY is entering a correction amid an uptrend that has been ongoing since March last year. Zone of interest: 183.0
Amid the growth of the dollar, the euro is entering a correction, but the main trend of the index is bearish.
The key area of interest and liquidity for the currency pair is

USDHCF I Weekly CLS Range I Model 1 Hi friends, new range created. As always we are looking for the manipulation in to the key level around the range. Don't forget confirmation switch from manipulation phase to the distribution phase to make the setup valid. Stay patient and enter only after change in order flow. If price reaches 50%

EUR/USD: A Healthy Correction Ahead of the Next RallyHello everyone, Camila here!
On the H4 timeframe, the bullish structure remains clearly intact. Price continues to form higher highs and higher lows, while the ascending trendline drawn from key swing lows is still being respected by the market. This indicates that the primary buying pressure has

EURUSD | 1H | Trend Reversal SetupPrice is currently moving inside a descending channel, showing strong bearish momentum. After tapping a key demand zone, we expect a technical bounce followed by a bullish continuation if confirmation appears.
🔹 Buy Zone: 1.1630 – 1.1650
🔹 Invalidation: Below demand zone
🔹 Target: 1.1720 – 1.1740
🔹

EURUSD: Three Targets Swing Buy, One Entry! **EURUSD ANALYSIS**
🔺The daily timeframe suggests a strong bullish price trend is likely to continue. After hitting some important levels and then reversing, with a big push from bullish volume, we expect the upward momentum to keep going. The lowest point of the day was at 1.1474, where the revers

See all forex ideas
| - | - | - | - | - | - | - | ||
| - | - | - | - | - | - | - | ||
| - | - | - | - | - | - | - | ||
| - | - | - | - | - | - | - | ||
| - | - | - | - | - | - | - | ||
| - | - | - | - | - | - | - | ||
| - | - | - | - | - | - | - | ||
| - | - | - | - | - | - | - |
Trade directly on Supercharts through our supported, fully-verified, and user-reviewed brokers.


