BOJ to Stress Test Global Markets? Why a Black Swan Is PossibleWhile US markets are busy debating AI valuations and parsing the Fed’s latest rate cut , something far more understated — and potentially more disruptive — is brewing across the Pacific.
The Bank of Japan is expected to raise interest rates on Friday, marking what could be its first hike in 11 mon
Your 2025 space mission is here
Suit up and get ready to explore every highlight of your trading galaxy.


GOOG: Is a 10% Surge Imminent? The Setup for $340 Explained🚀 NASDAQ:GOOG : Is a 10% Surge Imminent? The Setup for $340 Explained
In the noisy world of trading, clarity is power.
Today, we are looking at Alphabet Inc. (GOOGL). We are not predicting the future, we are simply preparing for a high-probability outcome.
We have identified a textbook Bull Fla

DOGE pulls back before major decline DOGECOIN is in a range formed against the backdrop of a downtrend. The market is under pressure from above at 0.155 - 0.153 - 0.150. The structure is bearish. The rebound from 0.134 is directed towards 0.1415. A false breakout could trigger a decline.
There is no volume from the bulls, and the mark

BTC Corrections Don’t Kill Bull Market. They Power Them1. Primary Trend Structure
Macro trend: Clearly bullish. Price has respected a rising diagonal trendline since the 2022–2023 cycle low. Market structure shows higher highs and higher lows, confirming an intact uptrend.
This is a classic bull market staircase: impulsive advances (green boxes) follo

2025 BITCOIN TARGETS: Reality Check
Forecasting is easy. Being right is hard.
1. When Targets Turn Into Illusions
Look at this chart.
Bitcoin at $90,000. Sixteen days left in 2025.
And every “expert” target — JPMorgan, VanEck, Standard Chartered, Tom Lee, Kiyosaki, BlackRock, Cathie Wood —
all of them missed. Every single one.

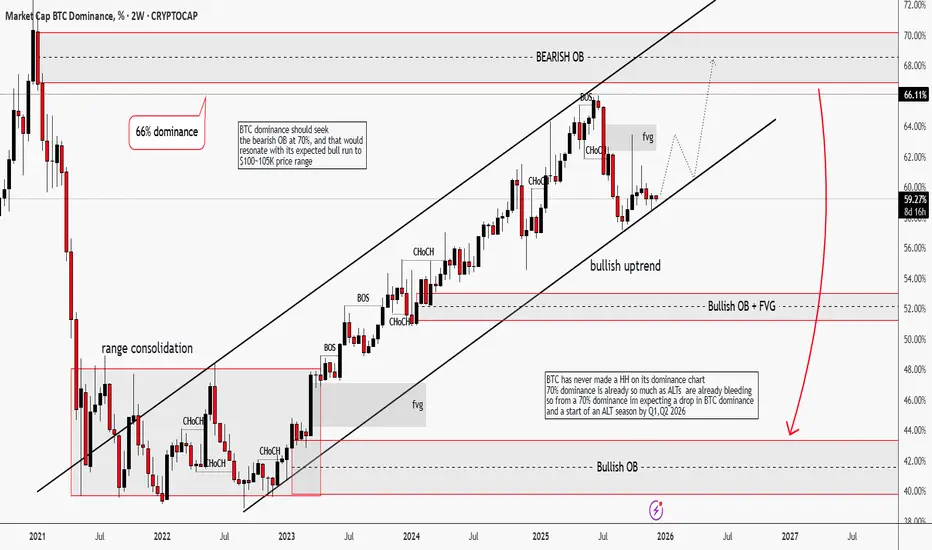
BTC Dominance | Winter is "Almost" ComingHello traders,
Its been a minute since I last checked my wallet, cause I don't love seeing red. Who loves to?
BTC dominance on the 2W timeframe has been in an impulsive bullish uptrend. Structure-wise, it has printed multiple BOS + CHoCH, which tells me that capital are still rotating into Bitcoin
Gold – Potential Choppy Price Action AheadThe market got what it wanted from the Federal Reserve last night when a widely anticipated interest rate cut of 25bps (0.25%) was announced, a move which as a rule is positive for Gold prices as it is an asset that doesn’t bear any interest itself. Initially this was the case, with the popular meta

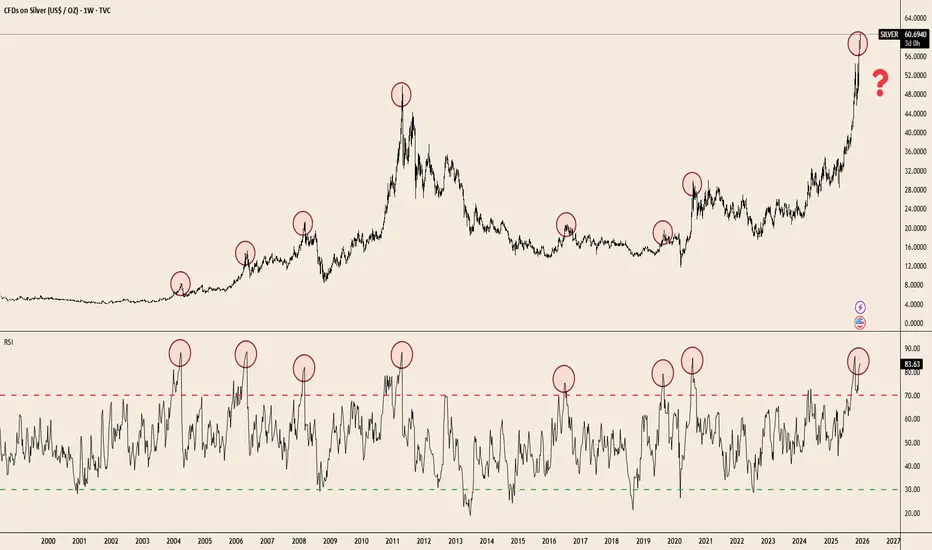
Silver at Extremes: RSI Signals Haven’t Missed in 20 YearsTVC:SILVER has delivered a massive breakout — up +109.9% YTD — but the weekly RSI is now pushing into one of the most extreme zones seen in two decades. Historically, every major spike into the 80–85 RSI band has preceded cooling periods, consolidations, or full reversals.
The chart makes the pat
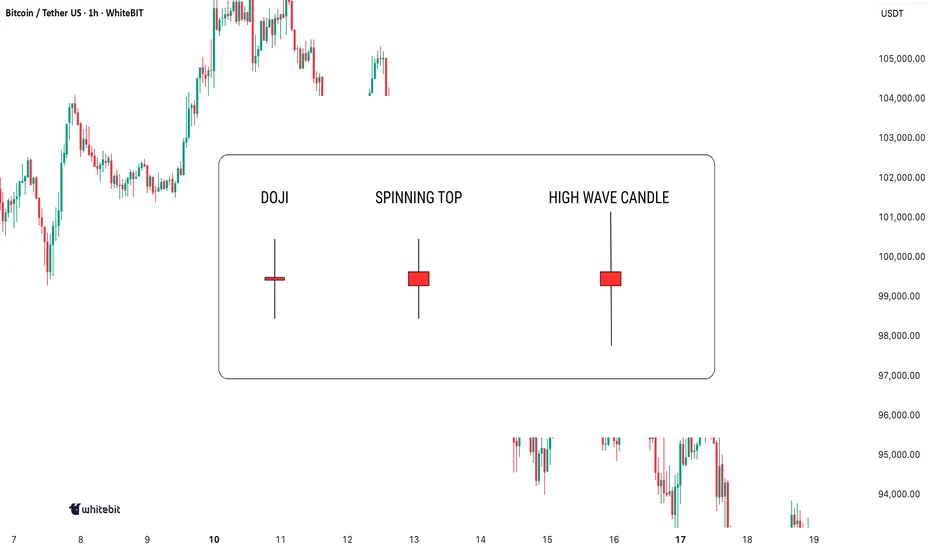
Indecision on the Chart: What These Candles Really MeanIndecision in the market? You're not alone. Every trader has faced those moments when the charts seem to scream confusion. But here's the thing: indecision candlestick patterns aren't just noise. They hold secrets that, when decoded, can give you the upper hand. Let's dive in and learn how to spot t
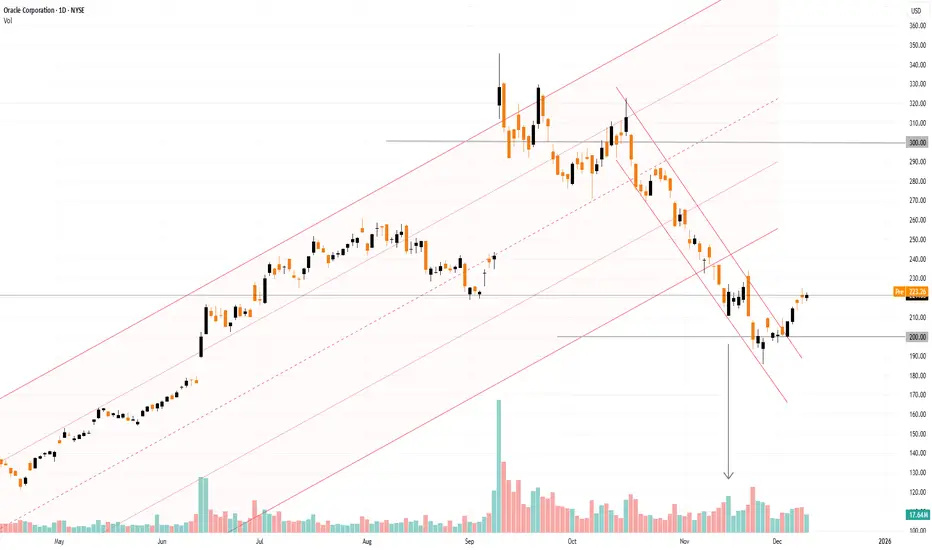
Oracle (ORCL) Share Price Rebounds Ahead of Earnings ReleaseOracle (ORCL) Share Price Rebounds Ahead of Earnings Release
Oracle is due to publish its quarterly results today after the close of the main trading session. Analysts are expecting solid year-on-year growth compared with the same period last year:
→ Revenue: forecast to rise by around 15% to $16
See all editors' picks ideas
Multi-Ticker Anchored CandlesMulti-Ticker Anchored Candles (MTAC) is a simple tool for overlaying up to 3 tickers onto the same chart. This is achieved by interpreting each symbol's OHLC data as percentages, then plotting their candle points relative to the main chart's open. This allows for a simple comparison of tickers to tr

Vdubus Divergence Wave Pattern Generator V1The Vdubus Divergence Wave Theory
10 years in the making & now finally thanks to AI I have attempted to put my Trading strategy & logic into a visual representation of how I analyse and project market using Core price action & MacD. Enjoy :)
A Proprietary Structural & Momentum Confluence System

Per Bak Self-Organized CriticalityTL;DR: This indicator measures market fragility. It measures the system's vulnerability to cascade failures and phase transitions. I've added four independent stress vectors: tail risk, volatility regime, credit stress, and positioning extremes. This allows us to quantify how susceptible markets are

Volatility Risk PremiumTHE INSURANCE PREMIUM OF THE STOCK MARKET
Every day, millions of investors face a fundamental question that has puzzled economists for decades: how much should protection against market crashes cost? The answer lies in a phenomenon called the Volatility Risk Premium, and understanding it may fundam

Volume Gaps & Imbalances (Zeiierman)█ Overview
Volume Gaps & Imbalances (Zeiierman) is an advanced market-structure and order-flow visualizer that maps where the market traded, where it did not, and how buyer-vs-seller pressure accumulated across the entire price range.
The core of the indicator is a price-by-price volume prof

Match Finder [theUltimator5]Match Finder is the dating app of indicators. It takes your current ticker and finds the most compatible match over a recent time period. The match may not be Mr. right, but it is Mr. right now. It doesn't forecast future connection, but it tells you current compatibility for today.
Jokes aside,

Trend Line Methods (TLM)Trend Line Methods (TLM)
Overview
Trend Line Methods (TLM) is a visual study designed to help traders explore trend structure using two complementary, auto-drawn trend channels. The script focuses on how price interacts with rising or falling boundaries over time. It does not generate trade sign

Breakouts & Pullbacks [Trendoscope®]🎲 Breakouts & Pullbacks - All-Time High Breakout Analyzer
Probability-Based Post-Breakout Behavior Statistics | Real-Time Pullback & Runup Tracker
A professional-grade Pine Script v6 indicator designed specifically for analyzing the historical and real-time behavior of price after strong All-Ti

Count█ OVERVIEW
A library of functions for counting the number of times (frequency) that elements occur in an array or matrix.
█ USAGE
Import the Count library.
import joebaus/count/1 as c
Create an array or matrix that is a `float`, `int`, `string`, or `bool` type to count elements from, t

Holographic Market Microstructure | AlphaNattHolographic Market Microstructure | AlphaNatt
A multidimensional, holographically-rendered framework designed to expose the invisible forces shaping every candle — liquidity voids, smart money footprints, order flow imbalances, and structural evolution — in real time.
---
📘 Overview
The Hol

See all indicators and strategies
Community trends
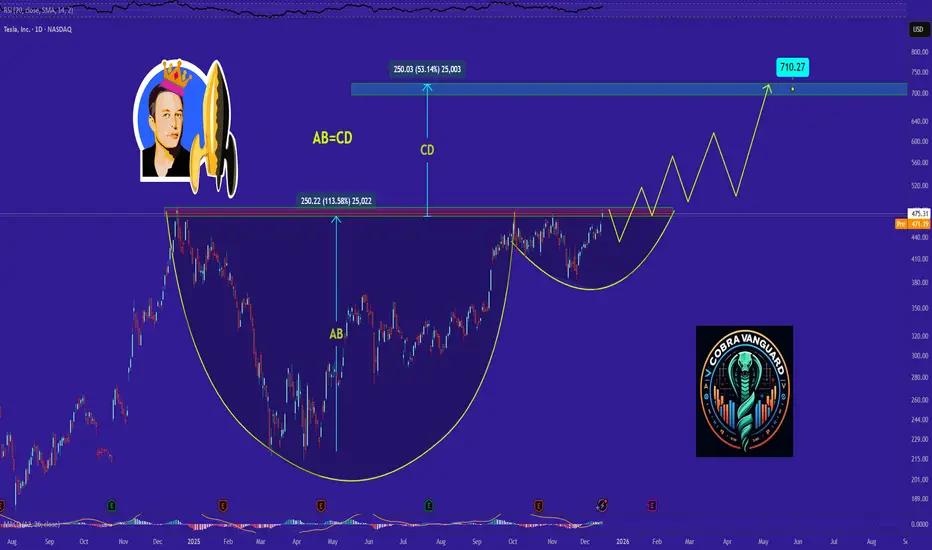
TESLA analysis, Chart is speaking itself !!!It can be said that the price has completed this pattern, and whenever the cup and handle is broken, we should expect a growth equal to AB=CD.
QS: Double Top has been confirmed and is already in actionQS: Double Top has been confirmed and is already in action
QS reached $19 on October 15th, marking a significant new high after a long period of consolidation. This level had not been tested since early April 2022.
However, the sharp rise—driven partly by news—appears to have triggered profit-taki

AVGO Threw a Party and Forgot the Guests 🚀 AVGO Threw a Party and Forgot the Guests 🚨
Hello team,
We are going to dive into one of the deepest and most counterintuitive secrets of technical analysis.
The sacred relationship between price and volume.
This connection is not just a metric, it is the voice of the market. And sometimes

QBTS SHORTChart presents my trading idea for short position on QBTS.
Breaking below $18.64 will signal strengthening and acceleration of selling pressure.
Next target price: $13.50 (06/29/25 low)
Strong support around $12, but once broken, following target are $3.77, then $1.27.

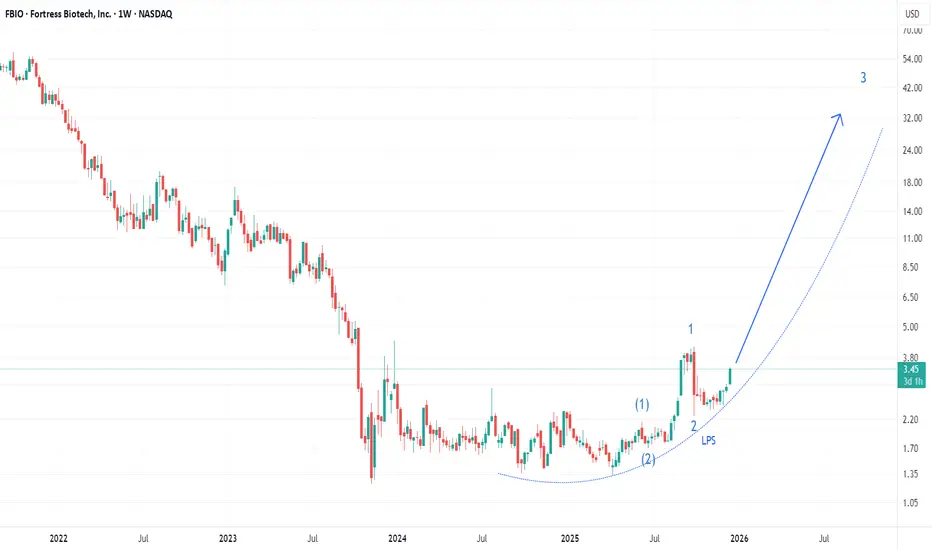
FBIO Stock Has the Potential to SkyrocketAfter years of accumulation, FBIO broke higher with clear signs of strength, marking what appears to be the first leg of Wave 3. The pullback held up well, behaving more like an LPS and fitting a Wave-2-of-3. From here, with the structure now lining up for the early acceleration of the main Wave-3-o
TSLA LongTsla Long, Breaking of handle to the upside. 440 key support. Personally a close under 466 invalidates the breakout. Entry 477. Target 1 is 520, target 2 is 570. If channel is broken to the downside the Long thesis is completely invalidated.

MU Micron Technology Options Ahead of EarningsIf you haven`t bought MU before the rally:
Now analyzing the options chain and the chart patterns of MU Micron Technology prior to the earnings report next week,
I would consider purchasing the 247.5usd strike price Calls with
an expiration date of 2025-12-19,
for a premium of approximately $8.10.

Nvidia - This is all still expected!🥊Nvidia ( NASDAQ:NVDA ) is heading for another -20%:
🔎Analysis summary:
Just last month, Nvidia created a massive bearish engulfing candle. This clearly shows that buyers are not willing to accept higher prices. Together with the retest of the major resistance trendline, Nvidia is heading low

Apple Rose 70% in Eight Months. What Its Chart Says NowApple NASDAQ:AAPL was the "Magnificent Seven" name that couldn't for more than half of 2025. Then the stock suddenly could -- rising some 70% from its $169.21 April low to a $288.62 record intraday high earlier this month. What do its chart and fundamentals say now?
Let's take a look:
Apple's F

Used cars dealership has a market cap greater than GM and Ford ?This BS valuation will be rectified very harshly sooner or later. >100 P/E WTF!

See all stocks ideas
Today
VERUVeru Inc.
Actual
−0.39
USD
Estimate
−0.39
USD
Today
BNEDBarnes & Noble Education, Inc
Actual
—
Estimate
—
Today
GTIMGood Times Restaurants Inc.
Actual
—
Estimate
—
Today
CTXRCitius Pharmaceuticals, Inc.
Actual
—
Estimate
−0.43
USD
Today
WSWorthington Steel, Inc.
Actual
—
Estimate
0.39
USD
Today
RICKRCI Hospitality Holdings, Inc.
Actual
—
Estimate
1.81
USD
Today
IMMRImmersion Corporation
Actual
—
Estimate
0.10
USD
Today
BLINBridgeline Digital, Inc.
Actual
—
Estimate
−0.03
USD
See more events
Community trends
Bitcoin - Bear flag, 74k confirmed! (warning, must see)Bitcoin has just completed its bearish flag formation. What now? The probability of going down is now around 70%, while the probability of going up is only 30%. Many times we see a bullish breakout of a bear flag. How does it look? Something like that:
We see that for a bullish breakout, the bulls

BTC Breaks Wedge Structure, Bearish Pressure IncreasingBTC Breaks Wedge Structure, Bearish Pressure Increasing
Over the past month, Bitcoin has been consolidating within a large wedge pattern, creating a complex and somewhat misleading structure.
The recent breakout has clarified the pattern as bearish, significantly increasing the probability of fur

Bitcoin Pullback to Resistance — Next Drop Loading?As I expected , Bitcoin( BINANCE:BTCUSDT ) has begun its decline from the resistance zone($94,850-$93,000) and has reached its target.
Currently, Bitcoin is moving near the resistance zone($90,900-$90,100), the Cumulative Short Liquidation Leverage($91,840-$90,110), and other resistance lines.
Fro

ADA – Downtrend Dominates, Risk of Deeper PullbackHello everyone,
On the chart, the downtrend remains clearly intact, with a persistent sequence of lower highs and lower lows extending from October to the present. Price is trading entirely below EMA34 and EMA89, both of which are sharply sloping downward. This confirms that sellers continue to co

Ethereum: Head & Shoulders Breakdown Inside a Descending channelHi
ETH is currently trading within a broader descending channel, keeping the medium-term structure under bearish pressure. On the 4H timeframe, price could have formed a clear Head & Shoulders pattern, with the left shoulder, head, and right shoulder well-defined and symmetric. Notably, the head br

BTCUSD Holds Triangle Support - Bounce Toward 88,500 ExpectedHello traders! Here’s my technical outlook on BTC/USD based on the current chart structure. After a prolonged bearish move inside a downward channel, Bitcoin found a base near the lower boundary and reversed sharply, signaling seller exhaustion and a shift in momentum. This reversal was followed by

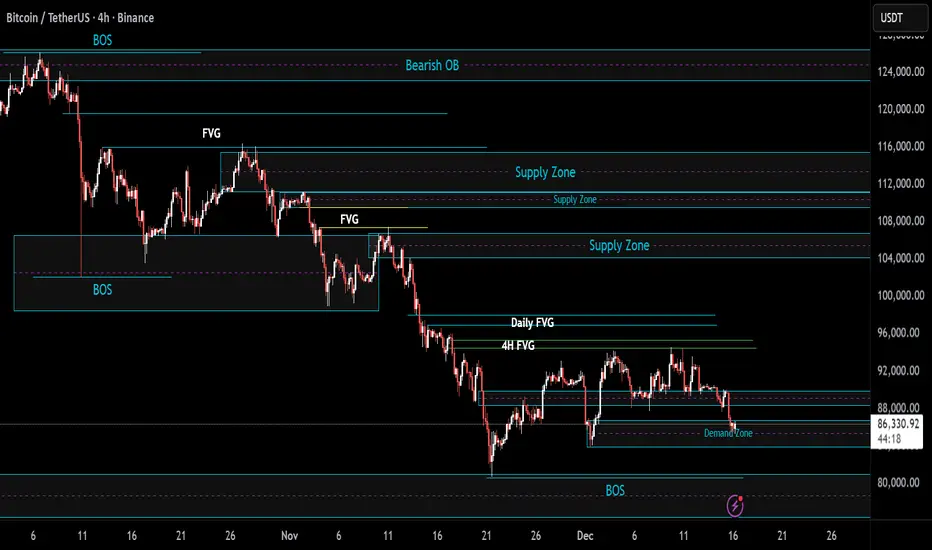
BTC/USDT | Bears in control? (READ THE CAPTION)Good day folks, hope you're doing okay.
As you can see and I previously mentioned, BTC dropped to the demand zone and now it's being traded at 86,560 level.
However, it is yet to break out of the demand zone, if it fails to do so, a drop to the low of the demand zone at 83,860 is possible. If it g
Bitcoin - Can it reclaim $89.000?Bitcoin (BTC) is currently trading in a crucial zone after the recent decline, positioned between a bullish 4-hour FVG around the lower $85,000 region and a 4-hour bearish FVG just below resistance. This BTC technical analysis focuses on whether Bitcoin can reclaim the lost trendline and the associa

BTCUSDT Analysis:BTCUSDT Analysis: Elliott Wave Structure & Liquidity Targets
Chart Analysis: Bitcoin is currently navigating a complex corrective phase on the 4-hour timeframe. Based on the market structure and recent price action, we are monitoring two potential scenarios centered around key liquidity pools.
1. P

LINK - Same Base, Same Question: Is Another Impulse Loading?📊LINK has been respecting a very clean long-term structure.
Each major sell-off has found support around the rising blue trendline, followed by a strong impulsive move higher. This behavior has repeated multiple times, creating a clear rhythm:
correction → base → impulse.🔁
Right now, price is once

See all crypto ideas
Lingrid | GOLD Buying Opportunity From Swap ZoneOANDA:XAUUSD is still trading within a well-defined rising channel, with the latest push printing a higher high before stalling inside the upper resistance band. The subsequent retracement appears controlled, with price rotating back into the former swap zone rather than breaking structure. This pu

Hellena | Oil (4H): LONG to 50% Fibo lvl (58.00).The structure has broken down. Wave “2” of the middle order should not have updated the minimum of 56,420 of wave “B” of the higher order, but this has happened.
This means that the wave structure will have to be revised.
It seems that the major correction is not yet complete, and in order for the

GOLD - Retest of key support ahead of newsFX:XAUUSD is falling during the Asian session, retreating from $4,350 — its highest level since late October — amid optimism over a peace agreement between Russia and Ukraine and ahead of US employment data.
Trump's statements about the approaching peace agreement are reducing demand for safe-

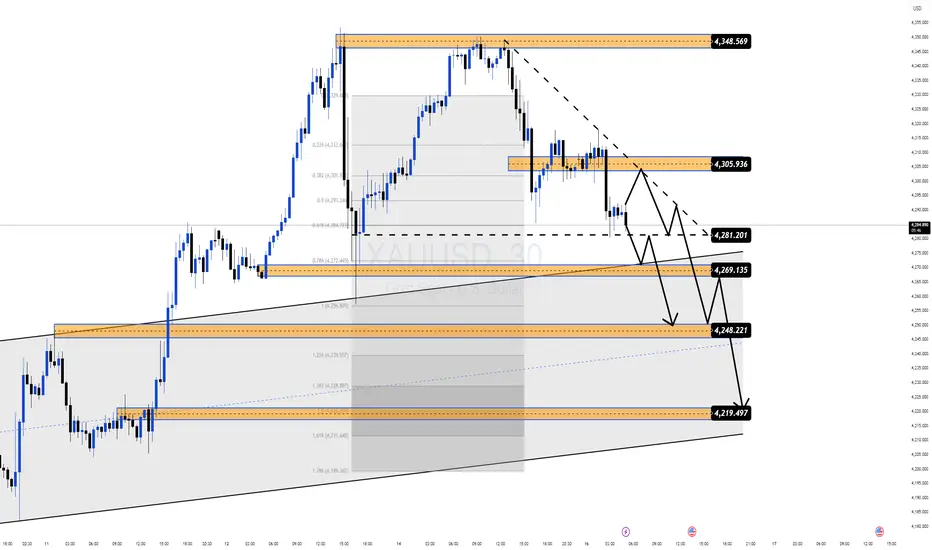
XAUUSD OVERVIEW FOR 12/16XAUUSD OVERVIEW FOR 12/16
Strategy Summary
Gold is holding steady but the main trend is unclear due to a series of strong news today. I will trade in a "wait for confirmation" style, clearly dividing into two scenarios:
Price increase confirmed when breaking above 4320
Price decrease confirmed when

Weak NFP, Rising Unemployment – Is Gold Set to Rally Again?Hello traders, let’s take a fresh look at the current XAUUSD picture.
In the short term, gold is receiving solid support from the news flow . Tonight’s NFP forecast stands at 51K, sharply lower than the previous 119K . At the same time, the unemployment rate is expected at 4.5%, higher than befor

XAGUSD (Silver) 1H chart patterns...XAGUSD (Silver) – Target Levels (Based on my Chart)
From the image, price is moving inside an ascending (bullish) channel and is currently near the upper zone / high point of the market. The marked arrows show a possible correction.
🎯 Downside Target Levels
If price gets rejected from the upper c

GOLD → Bearish Pressure Builds, But Confirmation Still RequiredHello everyone,
At the moment, gold is being influenced by a relatively sensitive macro backdrop. The U.S. dollar remains firm and U.S. Treasury yields stay elevated, making capital flows into non-yielding assets like gold more cautious. However, these factors are not yet strong enough to trigger

XAU/USD – Distribution at the Top, Sell on Rallies Market ContexAfter a strong bullish impulse, Gold is now showing clear signs of exhaustion near the upper liquidity zone. Price failed to sustain above the recent high and has started to rotate lower, suggesting a distribution phase rather than continuation.
From a macro perspective, although expectations aroun
XAUUSD(GOLD): Two Entries Both Has Equal Swing Buy PotentialDear Traders,
Buying Setup For OANDA:XAUUSD Based On SMC+ICT Strategy📈
🔺Gold has two potential buying areas. The first is a risky zone where the price may continue its bullish move but also has a risk of bears withdrawing liquidity from the entry area.
🔺Second Entry is more suitable for most

XAUUSD – Lana prefers Sell, Buy is only for scalping XAUUSD – Lana prefers Sell, Buy is only for scalping 💛
Quick Summary
Short-term trend: Downward pressure dominates
Timeframe to watch: H1
Strategy: Sell is primary; Buy is only for short-term, quick trades at liquidity zones
Note: Today there are many US data releases and events, so volatility cou

See all futures ideas
AUDUSD at Decision Point — Trend or Trap?Hey Traders,
In today’s trading session, we are monitoring AUDUSD for a potential buying opportunity around the 0.66200 zone.
Structure:
AUDUSD remains in a well-defined uptrend, and price is currently undergoing a healthy pullback toward the rising trend structure. The 0.66200 area stands out as

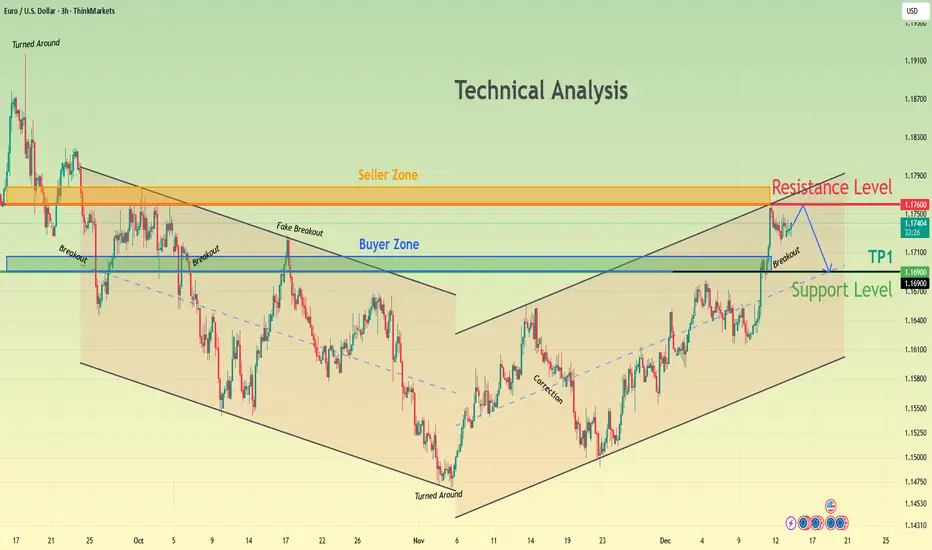
EURUSD Weakens at Seller Zone - Support at 1.1690 Under WatchHello traders! Here’s my technical outlook on EUR/USD based on the current chart structure. After a prolonged bearish move inside a downward channel, EURUSD found a base and reversed from the lower boundary, signaling a loss of bearish momentum. The price then broke above the descending resistance a
BOJ to Stress Test Global Markets? Why a Black Swan Is PossibleWhile US markets are busy debating AI valuations and parsing the Fed’s latest rate cut , something far more understated — and potentially more disruptive — is brewing across the Pacific.
The Bank of Japan is expected to raise interest rates on Friday, marking what could be its first hike in 11 mon
EURUSD: Rejection at Key Resistance - Support Zone at 1.1720Hello everyone, here is my breakdown of the current EURUSD setup.
Market Analysis
EURUSD is trading within a broader bullish structure, but the current price action points to a short-term corrective phase. After establishing an upward channel, price successfully broke above the previous consolida

GBPAUD: Pullback Trade From SupportThere is a strong possibility that 📈GBPAUD may experience a pullback from the indicated key horizontal support.
The formation of an inverted head and shoulders pattern on a 4-hour time frame suggests a significant buying interest.
The target is 2.0232.

USDJPY - Correction or Reload Before the Next Push?📈USDJPY remains structurally bullish on the higher time frame . The market respected the rising blue trendline, broke above the previous support zone, and shifted that zone into new demand.
🏹After the impulsive move higher , price is now going through a controlled correction, drifting back toward

2 Scenarios - EURUSDHello traders,
the EURUSD price is currently trading below the recent higher high .
We now have two possible scenarios :
🟢 BULLISH SCENARIO:
If the market breaks and closes above the higher high ,
we can expect a bullish continuation 📈
🎯 TARGET: 1.18020
🔴 BEARISH SCENARIO:
If the price

AUDUSD 4H chart patterns...AUDUSD – Target Levels (Based on my Chart)
From the image, AUDUSD (4H) is at a supply / resistance zone and shows a possible bearish pullback (downward arrow marked).
🎯 Downside Target Levels
If price gets rejected from the current resistance:
1. First Target: 0.6500 – 0.6480
Nearest support zo

CAD/JPY – H4 Analysis ...CAD/JPY – H4 Analysis (As per My chart)
Market Structure
Overall trend was bullish, price respected the ascending trendline + Ichimoku cloud.
Price has formed a clear Double Top near the highs.
Recent candles show breakdown below momentum, signaling a bearish correction.
---
📉 Sell Scenario

EUR/GBP Strong sell breakdown bearish move📉 EURGBP – SELL SETUP ALERT
EURGBP is showing strong bearish signals on the 1H timeframe after a clear bullish trendline breakdown. Price has also formed a Double Top pattern, followed by a Neckline break and support breakdown, confirming downside momentum.
🔻 Trade Direction: SELL
🎯 Entry: 0.87600

See all forex ideas
| - | - | - | - | - | - | - | ||
| - | - | - | - | - | - | - | ||
| - | - | - | - | - | - | - | ||
| - | - | - | - | - | - | - | ||
| - | - | - | - | - | - | - | ||
| - | - | - | - | - | - | - | ||
| - | - | - | - | - | - | - | ||
| - | - | - | - | - | - | - |
Trade directly on Supercharts through our supported, fully-verified, and user-reviewed brokers.


