Bitcoin vs Gold: The Big Monthly Retest- Price is now back inside a huge support area that has mattered since 2021.
- In the past, this zone often marked bottoms where Bitcoin stopped losing vs gold and sometimes started a new run up.
- Recent move down = gold stronger than BTC lately.
- The idea on the chart:
- Some sideways
Your 2025 space mission is here
Suit up and get ready to explore every highlight of your trading galaxy.


Bitcoin ascending channel and Cups -Next cycle Cup entered ? YES
Bitcoin ascending channel and Cups -Next cycle Cup entered
PA entered channel in march 2017 and has never left, other than to go to ATH.
Bitcoin has spent more time in and above this channel than out of it.
Since entering channel, PA has always bounced off the lower line of channel
For the sake

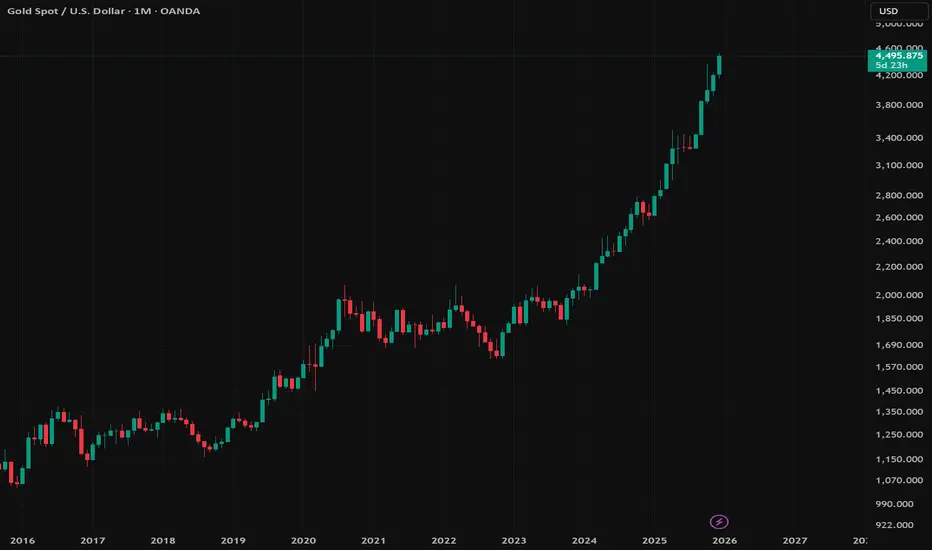
Gold – Potential 2025 Annual High Zone (Ongoing Price Discovery)Gold – Potential 2025 Annual High Zone
Date: December 26, 2025
Current Spot Price: 4489
Context:
Gold remains in an active price discovery phase, and the 2025 annual high has not yet been fully established. Recent upside expansion confirms that the market is still searching for its final year-end e
SPY – Dec 26 Trading Outlook | Trend Support vs Gamma Ceilingit’s now pressing into a zone where trend structure and GEX start to conflict. Tomorrow is about whether this pullback is a pause for continuation or the start of a deeper mean reversion.
Price action / structure (15m)
SPY remains in an intraday uptrend, respecting the rising trendline from the rec

Silver - This metal is blowing up now!💣Silver ( OANDA:XAGUSD ) is rallying even higher:
🔎Analysis summary:
Just a couple of months ago, we witnessed another bullish break and retest on Silver. It was quite obvious that Silver will rally accordingly and just recently, we experienced another +150% rally. However, looking at the hig

$NVO Quality GIGA-LONNNNNNNGGGGG!!!This is a weekly of NVO, a global leader in pharmaceuticals addressing issues like obesity, diabetes, among other things. Ever hear of Ozempic? This company makes it. They also have other products in their pipeline which intend to capitalize on these growing epidemics, such as the recently approve

NVIDIA – When the Same Setup Appears Twice!NVDA - CURRENT PRICE : 188.61
NVDA – Technical BUY Call 📈
Price previously rallied steadily after breaking a minor downtrend line (refer orange circle).
Similar technical setup is forming again, suggesting a potential repeat of the prior upswing.
In both occurrences, price stayed above

S&P 500 Index Approaches the 7,000-Point LevelOver the past five trading sessions, the U.S. equity index S&P 500 (SPX) has maintained a consistent bullish bias, posting gains of more than 2% in the short term and moving closer to the psychological 7,000-point level. For now, the index has managed to sustain firm buying pressure, supported by op

Gold smashes record highs: $4,500 next if prior record holds?Gold has exploded to new all-time highs this morning, breaking above the October peak of $4,380. But this isn't just a random holiday spike. It's the result of a specific macro mix hitting a thin, pre-Christmas market.
Here we analyse why a dovish Fed, persistent central bank buying, and geopolitic

NASDAQ100 vs BitcoinCryptocurrencies are still struggling to find strong bullish momentum, despite the rebound in stocks over the last few days after the US unemployment rate jumped and US CPI softened, as reported last week. These are ideal conditions for the Fed to consider more rate cuts in 2026, which explains why

See all editors' picks ideas
Multi-Distribution Volume Profile (Zeiierman)█ Overview
Multi-Distribution Volume Profile (Zeiierman) is a flexible, structure-first volume profile tool that lets you reshape how volume is distributed across price, from classic uniform profiles to advanced statistical curves like Gaussian, Lognormal, Student-t, and more.
Instead of forcin

Multi-Ticker Anchored CandlesMulti-Ticker Anchored Candles (MTAC) is a simple tool for overlaying up to 3 tickers onto the same chart. This is achieved by interpreting each symbol's OHLC data as percentages, then plotting their candle points relative to the main chart's open. This allows for a simple comparison of tickers to tr

Vdubus Divergence Wave Pattern Generator V1The Vdubus Divergence Wave Theory
10 years in the making & now finally thanks to AI I have attempted to put my Trading strategy & logic into a visual representation of how I analyse and project market using Core price action & MacD. Enjoy :)
A Proprietary Structural & Momentum Confluence System

Per Bak Self-Organized CriticalityTL;DR: This indicator measures market fragility. It measures the system's vulnerability to cascade failures and phase transitions. I've added four independent stress vectors: tail risk, volatility regime, credit stress, and positioning extremes. This allows us to quantify how susceptible markets are

Volatility Risk PremiumTHE INSURANCE PREMIUM OF THE STOCK MARKET
Every day, millions of investors face a fundamental question that has puzzled economists for decades: how much should protection against market crashes cost? The answer lies in a phenomenon called the Volatility Risk Premium, and understanding it may fundam

Volume Gaps & Imbalances (Zeiierman)█ Overview
Volume Gaps & Imbalances (Zeiierman) is an advanced market-structure and order-flow visualizer that maps where the market traded, where it did not, and how buyer-vs-seller pressure accumulated across the entire price range.
The core of the indicator is a price-by-price volume prof

Match Finder [theUltimator5]Match Finder is the dating app of indicators. It takes your current ticker and finds the most compatible match over a recent time period. The match may not be Mr. right, but it is Mr. right now. It doesn't forecast future connection, but it tells you current compatibility for today.
Jokes aside,

Trend Line Methods (TLM)Trend Line Methods (TLM)
Overview
Trend Line Methods (TLM) is a visual study designed to help traders explore trend structure using two complementary, auto-drawn trend channels. The script focuses on how price interacts with rising or falling boundaries over time. It does not generate trade sign

Breakouts & Pullbacks [Trendoscope®]🎲 Breakouts & Pullbacks - All-Time High Breakout Analyzer
Probability-Based Post-Breakout Behavior Statistics | Real-Time Pullback & Runup Tracker
A professional-grade Pine Script v6 indicator designed specifically for analyzing the historical and real-time behavior of price after strong All-Ti

Count█ OVERVIEW
A library of functions for counting the number of times (frequency) that elements occur in an array or matrix.
█ USAGE
Import the Count library.
import joebaus/count/1 as c
Create an array or matrix that is a `float`, `int`, `string`, or `bool` type to count elements from, t

See all indicators and strategies
Community trends
Sify Technologies- BUllish BreakoutSify Technologies ....Consolidation at support (F6) + inverted head and shoulders + breakout of tend line.
CMP -12.47.
stop loss to 10.87
and target1 -14 and target2- 17.
Need to see how stocks plays in these level. If I had to guess thick could be a multi bagger around 14 and 17.
And onc

Netflix - CALL Cortos, PUT LargosIn the medium term, a bearish outlook is expected, with prices falling to $75-79.
In the short term, a slight recovery may be possible to $104, $110 and $118

Oklo near lower channel support as momentum coolsOklo remains in a long-term uptrend, but current price action shows growing downside pressure. On the weekly chart, price has pulled back from the highs near $190–195 and is now trading around $76–77, placing it in the lower half of a well-defined rising channel. The lower channel boundary currently

NVDA which direction?Im saying the area 195-203 is critical what happen when tested could be clear the next direction, if breakthrough to the ascending channel then bullish, if rejected could be bearish to test lower levels than 170 to possible 140 for solid support.
lets see next 2 weeks

BITF - when structure starts to matter more than headlinesBitfarms Ltd. is a publicly traded Bitcoin mining company operating large scale mining facilities across North and South America. The core business is cryptocurrency mining with a strong focus on energy efficiency, infrastructure ownership, and geographic diversification across Canada, the United S

$META — High-Interest Compression Zone📊 NASDAQ:META — High-Interest Compression Zone
Price is consolidating around a high-interest node (~661–673) after a strong recovery leg.
This is not random chop — it’s a decision zone.
What stands out:
🔹 Volume Profile: Heavy participation near current price → acceptance, not rejection
🔹 Stru

Tesla - Move BeginsThe move is starting according to the previously outlined plan.
The local reversal has likely occurred, and one of the sub-waves of C , specifically a downward impulsive wave, is being formed.
Let’s mark the initial targets:
473 -> 466 -> 458
The speed and strength of this downward move

BABA: Monster Bull Flag Coiling. Next Leg to $250?BABA is forming a textbook Falling Wedge / Bull Flag consolidation after a massive impulse move (Flagpole +$100). The 50 MA remains stacked well above the 200 MA, confirming a strong primary uptrend. The RSI has successfully reset from overbought to neutral (~53) while price held key support, signal

Pan American Silver (PAAS)From a technical perspective, Pan American Silver (PAAS) exhibits a compelling structure that supports its bullish fundamental narrative. The stock’s recent surge, having gained over 26% in the past month, has established a clear pattern of higher highs and higher lows. Analyzing this move through t

BABA – Weekly Structure UpdateThesis
BABA, after multi year base, is completing an intermediate corrective phase within a broader bullish reversal structure.
Context
- Weekly timeframe
- Multi-year base completed
- Price trading above key long-term levels
What I see
- Impulsive advance followed by a controlled pullback
-

See all stocks ideas
Today
BNEDBarnes & Noble Education, Inc
Actual
—
Estimate
—
Today
IMMRImmersion Corporation
Actual
—
Estimate
0.10
USD
Today
CETXCemtrex Inc.
Actual
—
Estimate
—
Today
RICKRCI Hospitality Holdings, Inc.
Actual
—
Estimate
1.81
USD
Dec 31
JVACoffee Holding Co., Inc.
Actual
—
Estimate
—
Jan 1
PKEPark Aerospace Corp.
Actual
—
Estimate
—
Jan 1
LFCRLifecore Biomedical, Inc.
Actual
—
Estimate
−0.14
USD
Jan 2
HURCHurco Companies, Inc.
Actual
—
Estimate
—
See more events
Community trends
ETHUSDT Hello Traders! 👋
What are your thoughts on ETHEREUM?
Ethereum has experienced a sharp decline from recent highs and has now entered a corrective phase. Price is currently consolidating within a short-term ascending channel.
At the moment, ETH is trading near the lower boundary of the channel. In

BTC/USDT: Compression Phase Inside a Broad StructureHi!
Market Structure:
Bitcoin is currently trading inside a well-defined symmetrical triangle, characterized by a series of lower highs and higher lows. This structure reflects price compression and balance, not trend continuation.
Key Boundaries:
Price continues to respect both the descending upp

Bull Market 2023–2025: Final Results (27.12.25)Public history, responsibility, and the environment without which you don’t belong in the market
First of all, I want to thank @TradingView
In 2025, I received the WIZARD badge.
This is not just a label — it is recognition of my contribution as an active member of the TradingView Community.
For

BTCUSDT: Holding 87,300 Support Ahead of a 89,000 RetestHello everyone, here is my breakdown of the current BTCUSDT setup.
Market Analysis
BTCUSDT is trading within a well-defined ascending channel, reflecting a sustained bullish structure after breaking out of the prior consolidation range. Earlier in the chart, price spent significant time moving si

Bitcoin 2 day death cross doom - December 2025At the end of each 4 year cycle (October 2025 being the last around $120k), price action is followed by a 2 day death cross.
“But Ww the 4 year cycle is broken!! It does not apply anymore.”
“This time is different Ww”
Hold that thought…
The previous 2 day death crosses are shown below (in addit

LTCUSDT - Retest of the liquidity zone on a downtrendBINANCE:LTCUSDT.P is forming a local rally after breaking through resistance at 78.0. The market is bearish, but within the bullish run, the altcoin may test liquidity at 79.4 - 81.0.
Bitcoin looks weak, a rebound from resistance is forming, and Friday's daily bar indicates strong bearish domi

Lingrid | BNBUSDT Potential Downside Break After Swap RejectionBINANCE:BNBUSDT perfectly played out my previous trading idea . Price is trading below a descending trendline while struggling to reclaim the swap zone, suggesting sellers still control the short-term structure. Recent rebounds appear corrective rather than impulsive, with price repeatedly failing

ETHUSD Descending Triangle Breakdown SetupThis 2H ETH/USD chart highlights a descending triangle structure forming after a prior impulse move. Price is consistently making lower highs beneath a descending trendline, while holding a horizontal support zone around 2,890–2,900, signaling growing bearish pressure.
A clear CHoCH (Change of Char

Bitcoin (BTCUSD) – 1-Day Timeframe Tradertilki AnalysisGuys,
There have been many requests for me to share a new Bitcoin analysis, so here I am with my latest one.
My friends, Bitcoin is currently stuck between the levels of $94,500 and $84,000. This consolidation has two possible outcomes: it will break strongly in one direction.
If Bitcoin closes a

Bitcoin (BTC/USD) – 4H Bearish Rejection from Major Resistance Market Structure
Overall Bias: Bearish / corrective
Price is forming lower highs after a strong rejection from the upper zone.
Market is ranging but biased to the downside below resistance.
📉 Key Technical Zones
1️⃣ Major Resistance Zone (Red Area)
Approx. 89,900 – 92,300
Price was strongly rejecte

See all crypto ideas
GOLD DAILY CHART ROUTE MAPHey everyone,
Please see our new Daily chart roadmap and trade idea, following the completion of our previous Daily chart setup.
We’ve also updated the Goldturn channel. We currently have a daily body close above 4507, opening the path toward the 4605 AXIS target. A 5 EMA lock would further confir

XAUUSD Sellers Defend Resistance, Eyes on PullbackHello traders! Here’s my technical outlook on XAUUSD (4H) based on the current chart structure. Gold remains in a bullish structure after breaking above a descending resistance line, confirming a shift in control to buyers. Price then consolidated in a clear range, showing balanced market activity b

Gold Costs 175 Hours Of Work To BuyI like to price everything I buy in hours of work.
That’s the only price that actually matters.
Money can be replaced. Time can’t. When I look at a purchase in terms of how much of my life it costs, it becomes instantly clear whether it’s worth it.
My kids hate me for it because their view is that

Silver’s 2025 Explosion — How High Can It Go?In 2025, Silver ( OANDA:XAGUSD ) has experienced a remarkable surge, making it one of the most notable assets of the year. As we approach the end of 2025, I’ve decided to analyze silver to see how far its bullish trend might continue. So, stay with me as we delve into the reasons behind silver’s ri

XAUUSD – Bullish Continuation Setup (30M)Buy Zone: 4,520 – 4,530
Stop Loss:Below 4,500
Targets
TP1: 4,550
TP2: 4,600 – 4,610
Price is holding above ascending trendline and key demand. Bullish structure remains intact. A clean break and hold above resistance can trigger continuation toward the upper target zone.

Bulls in Full Control, but Reversal Risks Rise Near Record Highs- Gold continues to dominate the market after surging to a fresh all-time high at $4536.74, reinforcing strong bullish control despite a modest intraday pullback toward the $4515–$4525 zone. With no overhead resistance in sight, upside momentum remains intact, but the speed and vertical nature of th

XAUUSD Bullish Continuation Gold is trading in a bullish structure after filling the previous gap. Price is holding above the key support zone around 4530–4509, indicating strong buying interest. A minor pullback toward support is possible, but as long as this area holds, bullish continuation is expected. The upside targets re

XAUUSD (H4) – Trading with the Rising Channel Lana focuses on pullback buys for the week ahead 💛
Weekly overview
Primary trend (H4): Strong bullish structure, price is respecting a clean ascending channel
Current state: Price is trading near ATH and Fibonacci extensions → short-term reactions are possible
Weekly strategy: No FOMO. Lana pre

XAUUSD respecting descending channel structure.Price is trading inside a well-defined descending channel and is currently reacting from the lower boundary.
The support zone has previously held multiple times, suggesting a potential bullish response if structure remains intact.
A break and hold below support would invalidate this view.
Waiting

XAUUSD H4 – Trading the Uptrend Channel with LiquidityTrading the Uptrend Channel with Liquidity and Volume Profile
Gold remains bullish on the H4 timeframe and continues to respect a well-defined rising channel. With price approaching extended areas, the higher-probability approach is to buy pullbacks at value zones and treat the upper boundary as a

See all futures ideas
EURUSDHello Traders! 👋
What are your thoughts on EURUSD?
EURUSD has been trading within a well-defined weekly range for an extended period. Currently, the price has reached the major resistance zone (Range High), coinciding with the 0.707 and 0.786 Fibonacci retracement levels.
Technical Outlook:
Overb

#EURNZD: Bull Run Over? Start Swing Selling HAPPY NEW YAER 2026💥
EURNZD Analysis Based On SMC|ICT Strategy👨💻
🔺We are seeing bullish price exhaustions and change of character already have occurred, now the first thing we need to see is price behaviour and momentum, these are the two things that will give us the confirmation to tae swing sel

EUR/USD) Bullish trend analysis Read The captionSMC Trading point update
Technical analysis of EURUSD – 2H chart using SMC + Fibonacci OTE + EMA trend continuation.
⸻
Market Context
• Bias: Bullish continuation
• Overall structure shows higher highs & higher lows
• Strong impulsive move followed by healthy corrective channels
• Price is

GBPUSD Pullback Toward 1.34500 Keeps Bullish Trend in Play!Hey Traders,
In the coming week, we are monitoring GBPUSD for a potential buying opportunity around the 1.34500 zone.
The pair remains in a well-established uptrend and is currently undergoing a controlled correction. Price is approaching the 1.34500 area, a key zone where trendline support conver

#USDCAD #FOREX#USDCAD is showing signs of a potential trend reversal, but it's crucial to wait for confirmation. The pair is currently trapped in a downward channel, and sellers are still in control. A clean breakout above the channel, specifically above 1.36900, could flip the trend bullish. However, if it stays

TheGrove | EURUSD buy | Idea Trading AnalysisEURUSD is moving in an UP trend channel and moving on Resistance area .
The chart is above the support level, which has already become a reversal point twice.
We expect a decline in the channel after testing the current level.
We expect a decline in the channel after testing the current level which


EURUSD: Support & Resistance Analysis for Next Week 🇪🇺🇺🇸
Here is my latest structure analysis and important
supports & resistances for EURUSD for next week.
Consider these structures for pullback/breakout trading.
❤️Please, support my work with like, thank you!❤️
I am part of Trade Nation's Influencer program and receive a monthly fee for using th

GBPUSD SELLSI am going to short GBPUSD based on a break of structure on the daily time frame. I am risking 1% on this trade.

EURUSD Short: Failed Break 1.1800 - Demand at 1.1740 as TargetHello traders! Here’s a clear technical breakdown of EURUSD (4H) based on the current chart structure. After a prolonged consolidation phase marked by a broad range, EURUSD formed a clear pivot low and transitioned into a bullish recovery. From that pivot point, price established a well-defined asce

See all forex ideas
| - | - | - | - | - | - | - | ||
| - | - | - | - | - | - | - | ||
| - | - | - | - | - | - | - | ||
| - | - | - | - | - | - | - | ||
| - | - | - | - | - | - | - | ||
| - | - | - | - | - | - | - | ||
| - | - | - | - | - | - | - | ||
| - | - | - | - | - | - | - |
Trade directly on Supercharts through our supported, fully-verified, and user-reviewed brokers.


