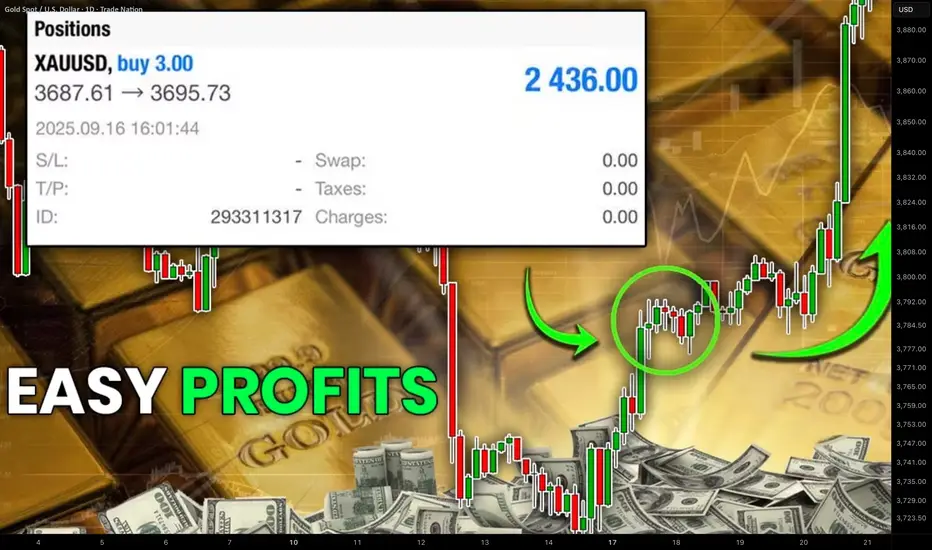
Profitable Gold XAUUSD Indicator Trading Strategy Explained
To profitably trade a massive bullish rally on Gold , you don't need a complicated system.
In this article, I will teach you an easy indicator strategy for trend-following trading XAUUSD.
It is based on 2 default technical indicators that are available on any trading platform: Mt4, Mt5, TradingView, etc.
You will get a complete trading plan:
exact entry signal,
smart stop loss placement,
trade management rules.
The first indicator that you will need to trade this strategy is Moving Average.
We will use a combination of 2 Moving Averages: Exponential Moving Average EMA with 20 length and a Simple Moving Average SMA with 9 length.
Our entry signal will be a crossover of 2 MA's on a 4H time frame.
SMA and EMA should meet first.
SMA should break through EMA to the upside to confirm a bullish signal.
With a high probability, Gold price will rise significantly then.
The main nuance of this strategy is to wait for a confirmed crossover and avoid the traps.
Patiently wait for a touch of 2 moving averages first.
After that, you will need to wait for a close of one more 4H candle to make sure that SMA stays above EMA.
You can see that though 2 Moving Averages met, SMA failed to break through EMA.
That is how a valid buy signal looks: SMA stays above EMA after a close of the next 4H candle.
After you identified a valid crossover, it is your signal to open BUY trade on Gold .
Your entry should be exactly after a close of a 4H candle.
Stop loss will be based on another popular free indicator - Average True Range ATR with default 14 length settings.
Your safe stop loss should be 2 ATR from the entry.
In our example, ATR is 145 pips.
2 ATR will be 190 pips.
That will be our stop loss.
With this trading strategy, we will not use a fixed Take Profit TP and use trailing stop loss instead.
It will help us to catch extended bullish waves on Gold.
Once the market starts rising, updating the highs, trail your stop loss based on EMA and keep it 1 ATR below that.
Make sure that you move your stop loss only when EMA and Gold price are rising . Once Gold price or EMA start moving in sideways or go down, do not lower your stop loss.
Using this strategy consistently, you will be able to catch significant bullish waves.
In Autumn trading season of 2025, this strategy provided, 3100+ pips entry signal.
What I like about this strategy is that being very simple, you can easily backtest that and measure its objective trading performance.
Easy entry, confirmation, and trade management rules make this strategy appropriate for beginners in Gold trading and will help to not miss a current extraordinary trend.
❤️Please, support my work with like, thank you!❤️
I am part of Trade Nation's Influencer program and receive a monthly fee for using their TradingView charts in my analysis.
X-indicator
YOUR JOB IS TO FIND CONFLUENCE - Here is how I do it.....All the information you need to find a high probability trade are in front of you on the charts so build your trading decisions on 'the facts' of the chart NOT what you think or what you want to happen or even what you heard will happen. If you have enough facts telling you to trade in a certain direction and therefore enough confluence to take a trade, then this is how you will gain consistency in you trading and build confidence. Check out my trade idea!!
www.tradingview.com

How to use BTC Coinbase premium index indicator on tradingview1. What is the Coinbase Premium Index?
The Coinbase Premium Index is a metric that measures the price difference between a specific cryptocurrency listed on Coinbase and the price of Bitcoin on other major exchanges (especially Binance).
⌨︎ Calculation method:
(Coinbase BTC price - Other exchange BTC price) / Other exchange BTC price * 100
Positive premium: Occurs when the Coinbase price is higher than on other exchanges.
Negative premium: Occurs when the Coinbase price is lower than on other exchanges.
📌 If this content was helpful, please show your support with a boost and comments. Your encouragement is a great motivator for creating better analysis and content.
We will continue to upload various content such as chart analysis, trading strategies, and Bitcoin short-term signals, so please follow us.
2. Causes of Coinbase Premium
✔️ The main causes of Coinbase Premium are as follows:
Institutional investor demand: Coinbase is one of the largest regulated cryptocurrency exchanges in the U.S., and many institutional investors (hedge funds, asset management firms, etc.) purchase cryptocurrencies through Coinbase.
Large-scale buy orders from institutional investors can temporarily drive up prices on Coinbase, creating a premium.
Fiat currency inflow: Coinbase primarily facilitates USD-based transactions and is the most accessible platform for U.S. investors.
When new fiat currency flows into the cryptocurrency market, a strong inflow through Coinbase can lead to a premium.
Market sentiment and liquidity: If U.S. market investor sentiment is stronger than in other regions at certain times, or if liquidity on Coinbase is temporarily low, a price difference may occur.
Restrictions on fund movement: Due to anti-money laundering (AML) regulations, there may be time and cost restrictions on fund transfers between exchanges.
This limits arbitrage opportunities and helps maintain the premium.
Network congestion and fees: During cryptocurrency network congestion, transaction speeds may slow down or fees may increase, making rapid arbitrage between exchanges difficult.
3. How to Use the Coinbase Premium Index in Trading
The Coinbase Premium Index can primarily be used to predict market trends for major cryptocurrencies like Bitcoin (BTC).
📈 Bull market signal (positive premium):
Institutional buying inflow: A consistently high positive premium may indicate sustained buying pressure from institutional investors.
This can be interpreted as a signal of an overall market uptrend.
Trend reversal: If a negative premium persists in a bear market and then suddenly turns positive or its magnitude increases, it can be seen as a signal that a trend reversal is imminent, along with the inflow of institutional investors and improved market sentiment.
Bottom buying opportunity: If the Bitcoin price is falling and the Coinbase premium starts to rise above 0%, and at the same time, the daily net inflow into ETFs like BlackRock iShares Bitcoin Trust (IBIT) or Fidelity Wise Origin Bitcoin Trust (FBTC) significantly increases, this could signal a strong buying opportunity at the bottom.
📉 Bear market signal (negative premium):
Institutional selling pressure or decreased interest: A consistently low negative premium may indicate high selling pressure from institutional investors or decreasing interest in Bitcoin.
This can be interpreted as a signal of a market downtrend.
Bearish reversal signal: If a positive premium persists in a bull market and then turns negative or its magnitude sharply increases, it could be a top signal, indicating that institutional investors are taking profits or new buying inflows are decreasing.
Overbought/Correction signal: For example, if the Bitcoin price is soaring and the Coinbase premium turns negative, and at the same time, large net outflows are observed from ETFs such as BlackRock IBIT or Fidelity FBTC, it can be judged that the market is overbought or there is a possibility of correction, and a sell position can be considered.
4. Points to Note
🚨 When using the Coinbase Premium Index, pay attention to the following:
Combination with other indicators: The Coinbase Premium Index is just one auxiliary indicator.
A comprehensive judgment should be made by analyzing other technical analysis indicators such as moving averages, RSI, MACD, trading volume, as well as on-chain data and macroeconomic indicators.
Importance of ETF inflow/outflow data: Bitcoin spot ETFs from major asset managers such as BlackRock and Fidelity are one of the most direct indicators of actual institutional investor fund flows.
Analyzing these ETF's daily net inflow/outflow data along with the Coinbase premium can provide a more accurate understanding of institutional buying/selling pressure in the market.
Short-term volatility: The premium can fluctuate rapidly due to subtle changes in the market in the short term.
It is important to observe long-term trends rather than reacting too sensitively to temporary premium changes over a short period.
Changes in market conditions: The cryptocurrency market changes very rapidly.
There is no guarantee that patterns that were valid in the past will necessarily be valid in the future.
Various factors such as regulatory environments, policy changes of major exchanges, and the emergence of new market participants can affect the premium.
Limited scope of application: The Coinbase Premium Index tends to reflect the demand of institutional investors, mainly for Bitcoin. Its influence may be limited for altcoins.
5. Using the Coinbase Premium Index in TradingView
TradingView is a popular platform that provides various technical indicators and chart analysis tools. On TradingView, there are many custom indicators that can monitor the Coinbase Premium Index in real time.
These indicators usually calculate the price difference between Coinbase and Binance spot assets (e.g., BTCUSD/BTCUSDT) and display it in a separate panel at the bottom of the chart.
📊 TradingView indicator usage tips:
Search for indicators: Click the 'Indicators' button on the TradingView chart and type keywords such as 'Coinbase premium' or 'Coinbase vs Binance' in the search bar to find relevant indicators.
Real-time monitoring: These indicators retrieve real-time Bitcoin spot price data from Coinbase and Binance, calculate the premium, and visually display it on the chart. This allows investors to instantly confirm market price differences and incorporate them into their trading strategies.
Combination with other indicators: A powerful advantage of TradingView is that multiple indicators can be overlaid on one chart.
You can add the Coinbase Premium Index indicator along with the Bitcoin price chart, and if necessary, refer to BlackRock and Fidelity ETF inflow/outflow data separately to attempt multi-faceted analysis.
Alert settings: Use TradingView's alert function to set alerts when the Coinbase premium exceeds a certain level or enters/exits a certain range.
This helps to grasp market changes in real time and respond accordingly.
In conclusion, the Coinbase Premium Index is an indicator that can offer insight into the movements of institutional investors in the U.S. market, one of the major players in the cryptocurrency space.
When combined with Bitcoin spot ETF inflow/outflow data from major asset management firms such as BlackRock and Fidelity, it can significantly help to more clearly understand the actual flow of institutional funds and to judge market strength and the possibility of trend reversals.
However, rather than blindly trusting it, it is wise to use it as a supplementary tool to enhance a comprehensive understanding of the market by utilizing it with other analysis tools.

Understanding Money Flow Index In TradingMoney Flow Index (MFI) is a volume-weighted oscillator (0–100) that blends price and volume to show where real buying or selling pressure is building. By comparing positive vs. negative money flow from the Typical Price ((H+L+C)/3) and volume, MFI acts like a volume-aware RSI .
Traders use it to spot overbought/oversold zones (commonly >80/<20), confirm trend regimes around the 50 line, and catch divergences that often precede reversals. It’s simple, fast, and works across stocks, crypto, and FX—best used with a clear market structure and disciplined risk management.
1) Why is MFI important in trading?
MFI blends price and volume into a single oscillator, helping you spot exhaustion, confirm trends, and catch divergences earlier than price-only tools. Think of it as a volume-weighted RSI that validates whether a move is backed by real participation.
Captures “true” buying/selling pressure via volume.
Flags overbought/oversold zones more selectively than RSI.
Great for divergences, regime reads, and pullback timing.
2) MFI Components
Typical Price (TP): (High + Low + Close) / 3
Raw Money Flow (RMF): TP × Volume
Positive/Negative MF: Sum RMF on up-TP vs down-TP bars
Money Flow Ratio (MFR): PMF / NMF
MFI Line (0–100): RSI-style transform of MFR
Default length: 14 (common, tweakable)
3) MFI Formula
//@version=5
// Formula sketch (not an executable script)
TP_t = (high + low + close) / 3
RMF_t = TP_t * volume
// Over N bars:
PMF = sum( RMF_t where TP_t > TP_{t-1} )
NMF = sum( RMF_t where TP_t < TP_{t-1} )
// If TP_t == TP_{t-1}, ignore bar
MFR = PMF / NMF
MFI = 100 - (100 / (1 + MFR))
4) Interpreting MFI signals
Here’s how to read the line like a pro.
Zones: Overbought > 80 (extreme > 90), Oversold < 20 (extreme < 10)
Divergences: Bearish = price HH while MFI LH; Bullish = price LL while MFI HL
Midline/Regimes: Above 50 favors bulls; below 50 favors bears
Failure swings: Overbought → pullback → lower MFI high while price retests = caution
5) Trend & Momentum Analysis
Use MFI to confirm trend strength and quality.
Bullish ranges: MFI oscillates ~40–90 in uptrends; 50 often holds on dips
Bearish ranges: MFI oscillates ~10–60; rallies stall near 50–60
Momentum bursts: Fast pushes into 80–90 after consolidation often precede breakouts
Multi-timeframe: Align higher-TF MFI regime (e.g., 1D) with lower-TF entries (e.g., 1H)
6) MFI-Based Trading Strategies
Practical, testable rules you can refine.
A) Mean Reversion (Counter-Trend)
Entry: MFI < 20 → bullish reversal candle or break of minor swing high
Invalidation: Below the setup candle’s low or last swing low
Exits: MFI back to 50–60, or retest of VWAP/mid-channel
B) Breakout Confirmation
Precondition: Sideways range, contracting volatility
Trigger: Close outside the range and MFI > 55–60 (or spike > 80)
Exits: Trail behind structure/ATR; partials at measured move of the range
C) Trend Pullback Buy
Context: Uptrend with MFI mostly > 50
Entry: Pullback drives MFI into 40–50 then curls up; enter on HH/HOC close
Exits: Prior high, Fib extensions, or when MFI loses 50 again
D) Divergence Reversal
Trigger: Clear price/MFI divergence + break of a micro trendline or last swing
Risk: Tight stop past divergence origin
Targets: Midline 50 first, then opposing extreme 80/20
Confluence ideas: Pair with RSI, OBV, Bollinger Bands, or Volume Profile; require session/time filters for intraday assets.
7) Limitations of MFI
Know where it can mislead you.
Strong trends can pin MFI at extremes (overbought can stay overbought).
Volume quality matters (tick volume ≠ , centralized exchange volume).
Parameter sensitivity: too short = noise; too long = lag.
Data irregularities (thin books, outages, rollovers) can skew readings.
8) Optimization
Smart tweaks that actually help in live markets.
Dynamic Zones: Replace fixed 80/20 with rolling percentiles (e.g., 90th/10th of last 252 bars).
Adaptive Length: Tie MFI length to ATR/realized vol to reduce whipsaws.
Session Filters: Act only during liquid sessions; avoid lunch hours/illiquid opens.
Walk-Forward Testing: Validate across regimes; don’t overfit one market.
Risk First: Size by ATR; plan partials; use time-based exits to avoid stagnation.
9) Key Takeaways
Wrapping it up with what matters most.
MFI is a volume-aware oscillator that improves on RSI in participation-heavy moves.
Use 50 as a regime filter; use 80/20 (or dynamic zones) for edges.
Best signals: divergences, trend-pullback resets, and breakouts with MFI thrust.
Respect limitations: trends can pin MFI; validate with structure and clear risk controls.
Optimize with percentile zones, adaptive lengths, and session filters—then forward-test.
Instruments for Global Trading1. Overview of Global Trading Instruments
Global trading instruments are financial assets that can be traded across international markets. They represent ownership, debt obligations, or rights to future cash flows. Their purpose is to provide liquidity, facilitate capital allocation, and enable risk management. From traditional stocks to complex derivatives and cryptocurrencies, these instruments reflect the diversity and innovation in global finance.
International investors utilize these instruments to gain exposure to various regions, sectors, and asset classes, often balancing returns against risk. For instance, a U.S. investor may hold Japanese equities, European bonds, and oil futures simultaneously to diversify globally.
2. Equities (Stocks)
Equities are one of the most popular global trading instruments. They represent ownership in a company, giving shareholders rights to profits through dividends and capital appreciation.
Types of Equities:
Common Shares: Provide voting rights and dividends.
Preferred Shares: Offer fixed dividends but usually no voting rights.
Depository Receipts: Instruments like ADRs (American Depository Receipts) and GDRs (Global Depository Receipts) allow investors to trade shares of foreign companies on domestic exchanges.
Global Equity Markets:
Leading equity markets include the New York Stock Exchange (NYSE), NASDAQ, London Stock Exchange (LSE), Tokyo Stock Exchange (TSE), and Euronext. Emerging markets such as India’s NSE and BSE, China’s Shanghai Stock Exchange, and Brazil’s B3 also play major roles.
Importance:
Equities enable companies to raise capital globally while offering investors growth potential. Through ETFs and index funds, investors can access diversified global equity portfolios.
3. Fixed Income Securities (Bonds)
Bonds are debt instruments that allow entities—governments, corporations, or institutions—to raise funds by borrowing from investors. Bondholders receive periodic interest payments (coupons) and principal repayment at maturity.
Types of Bonds:
Government Bonds: Issued by national governments (e.g., U.S. Treasuries, UK Gilts, Indian Government Securities).
Corporate Bonds: Issued by companies to finance operations or expansions.
Municipal Bonds: Issued by local governments.
Sovereign and Eurobonds: Traded internationally, often denominated in a foreign currency.
Global Bond Markets:
The bond market is much larger than the stock market in total value. Major trading hubs include the U.S. Treasury market, European government bond markets, and Asian bond markets such as Japan’s JGBs.
Role in Global Finance:
Bonds provide stability and predictable returns, making them essential for conservative investors and institutional portfolios. Global bond ETFs also allow diversification across regions and credit qualities.
4. Derivatives
Derivatives are financial instruments whose value is derived from underlying assets such as stocks, bonds, currencies, interest rates, or commodities. They are used for hedging, speculation, and arbitrage in global markets.
Types of Derivatives:
Futures: Standardized contracts to buy or sell assets at a future date and price.
Options: Provide the right, but not the obligation, to buy (call) or sell (put) an asset.
Swaps: Agreements to exchange cash flows, such as interest rate swaps or currency swaps.
Forwards: Customized contracts similar to futures but traded over-the-counter (OTC).
Global Derivatives Exchanges:
Major exchanges include the Chicago Mercantile Exchange (CME), Intercontinental Exchange (ICE), Eurex, and Singapore Exchange (SGX).
Significance:
Derivatives enhance liquidity and help manage risk. For instance, a European importer can hedge against currency fluctuations through forex futures. Similarly, investors hedge equity portfolios using index options or volatility derivatives.
5. Foreign Exchange (Forex)
The foreign exchange market is the largest and most liquid financial market in the world, with a daily trading volume exceeding $7 trillion. It involves the exchange of one currency for another, allowing international trade and investment to function smoothly.
Major Currency Pairs:
Major pairs: EUR/USD, USD/JPY, GBP/USD, USD/CHF
Minor pairs: EUR/GBP, AUD/NZD, etc.
Exotic pairs: USD/INR, USD/TRY, etc.
Participants:
Central banks, commercial banks, hedge funds, corporations, and retail traders participate in forex trading.
Instruments in Forex Trading:
Spot Transactions: Immediate exchange of currencies.
Forward Contracts: Agreements to exchange currencies at a future date.
Currency Swaps and Options: For managing exposure and speculation.
Importance:
Forex trading facilitates global commerce, cross-border investments, and monetary policy execution. It also allows investors to profit from exchange rate fluctuations.
6. Commodities
Commodities are tangible goods such as metals, energy resources, and agricultural products traded globally. Commodity markets are crucial for price discovery and risk management.
Types of Commodities:
Energy: Crude oil, natural gas, coal.
Metals: Gold, silver, copper, aluminum.
Agricultural: Wheat, coffee, sugar, soybeans.
Commodity Exchanges:
Global trading platforms include Chicago Board of Trade (CBOT), New York Mercantile Exchange (NYMEX), London Metal Exchange (LME), and Multi Commodity Exchange (MCX) in India.
Investment Methods:
Investors can trade commodities through futures contracts, ETFs, or commodity-focused mutual funds. For example, gold ETFs allow exposure without physical ownership.
Global Impact:
Commodity prices influence inflation, trade balances, and economic policies. For instance, oil price fluctuations affect energy-importing nations differently from exporters.
7. Exchange-Traded Funds (ETFs) and Mutual Funds
ETFs and mutual funds pool investor money to invest in diversified portfolios of stocks, bonds, or commodities.
ETFs: Traded on exchanges like stocks, ETFs offer liquidity and real-time pricing.
Mutual Funds: Professionally managed funds priced once daily based on net asset value (NAV).
Global ETFs track indices such as the MSCI World Index or S&P 500, giving investors exposure to multiple countries and sectors with low costs. They are among the most accessible tools for global diversification.
8. Cryptocurrencies and Digital Assets
In recent years, cryptocurrencies have emerged as a new class of global trading instruments. Digital assets like Bitcoin, Ethereum, and stablecoins operate on decentralized blockchain networks and trade 24/7 across international platforms.
Advantages: Transparency, borderless transactions, and diversification.
Risks: High volatility, regulatory uncertainty, and cybersecurity concerns.
Global Platforms: Binance, Coinbase, and Kraken facilitate crypto trading.
Institutional interest is growing, with the development of Bitcoin ETFs and central bank digital currencies (CBDCs).
9. Hybrid and Alternative Instruments
The global market also includes hybrid instruments that combine features of equity and debt, such as convertible bonds and preference shares. Additionally, real estate investment trusts (REITs) and private equity funds provide access to alternative assets beyond traditional markets.
These instruments allow investors to tailor portfolios for income, growth, or inflation protection.
10. Conclusion
Global trading instruments form the backbone of the international financial ecosystem. From stocks and bonds to currencies and commodities, they enable investors to diversify, manage risk, and seek profit across borders. The ongoing integration of financial markets, technological advancement, and innovation in products—such as ETFs and digital assets—continue to expand the range and accessibility of these instruments.
For global investors, understanding how each instrument functions, interacts, and responds to economic trends is essential. The right mix of instruments, aligned with market conditions and individual risk tolerance, helps build a balanced and resilient global portfolio—one that can thrive in the ever-evolving world of international finance.
Building a Trading System: From Idea to ExecutionEvery trader starts with an idea — a setup, a pattern, a theory that seems to work.
But until that idea becomes a structured system, it’s just intuition.
A trading system gives your ideas rules, logic, and repeatability.
That’s the difference between a trader who hopes, and a trader who executes.
Define the Core Idea
Every system begins with an observation.
Maybe you notice breakouts after volume spikes, or reversals after RSI divergence.
Whatever the logic, write it down.
A system has to be specific, if you can’t define it clearly, you can’t test it.
Set Your Entry and Exit Rules
Your system should answer three things precisely:
When to enter a trade
When to exit a trade
How much to risk
Ambiguity is the enemy.
Rules make your strategy repeatable, testable, and objective.
Backtest the Logic
Before going live, test your rules on past data.
You’re not looking for perfection, you’re looking for consistency.
If your logic survives bull, bear, and sideways markets, it’s valid.
Track win rate, drawdown, and profit factor — they’ll tell you what’s working.
Execute With Discipline
A system only works if you do.
Follow the rules exactly as tested, even when it feels uncomfortable.
Consistency turns probability into profit — emotions destroy both.
Application
Here we have a very good example from our trading signals where we executed one of our strategies for 10 days. The strategy was designed with detailed inputs, logic and executed with a precise setup in a trading bot.
Refine and Evolve
Once live, keep notes.
Track how the system performs under real conditions.
Make small, measured improvements based on data, not emotion.
A system should evolve, not change its identity.
Redefining and tuning is a part of the process, there is no strategy that lasts forever, everything needs to evolve and adjust!
MACAU PRIVATE LANDPower National Government GLOBAL WW1 WW2 WW3 MAIN BOARD bought Macau Island, which will become Lee Chee Keong's private island. BITSTAMP:BTCUSD FX:GBPUSD
JABATAN PENGUAM NEGARABursa Malaysia, Gem Development Company Group, JP Morgan and Goldman Sach, all those who recklessly dumped stocks and equity/Bitcoin in the stock market, and MUHYIDDIN YASIN transferred company funds to other people's and company accounts, will be sued by the company, leading to their complete bankruptcy, fines of 300% of the amount owed, and a potential 30-year prison sentence. MYX:BURSA

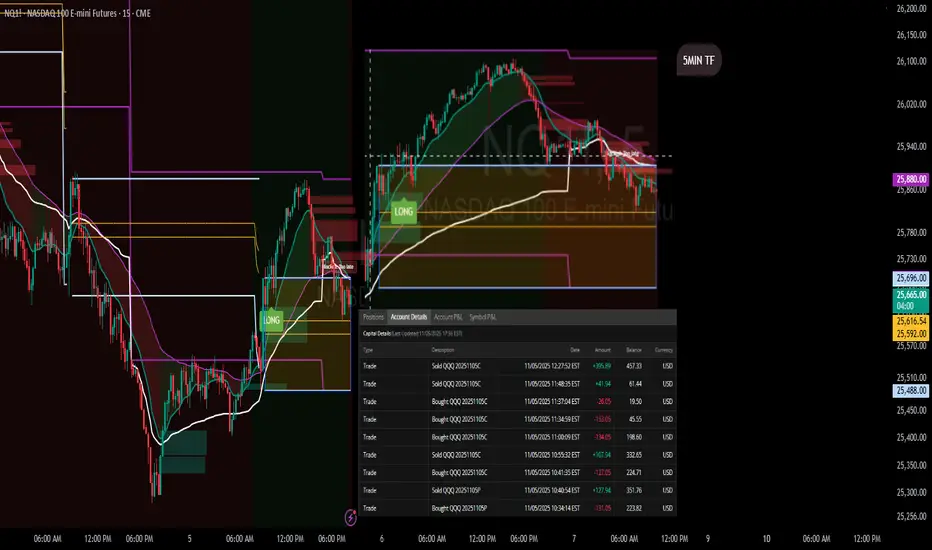
ORB Pro Signal Recap – Nov 5, 2025 | “Respect the Levels”Ticker: QQQ / NQ1! (5-min + 15-min TF)
Strategy: ORB Pro + Trendline Breakdown + Previous Day High Rejection
Focus: Signal confirmation & reaction zones
🧭 Market Context
The morning started strong, with buyers pushing off the open toward the previous day’s high (PDH) and ORB extension zone.
As price tapped the upper band, the ORB Pro system generated a clean long confirmation, aligned with the higher timeframe momentum.
But the rally quickly stalled at the PDH — a textbook reaction zone where the structure shifted.
From there, trendline breakdowns on both 5-min and 15-min charts confirmed exhaustion, and the system correctly prevented new long entries once momentum failed.
💹 Trade Breakdown
Initial Long: Taken on ORB Pro signal confirmation near the intraday retest (strong follow-through into PDH).
Profit-Take Zone: Price rejected sharply at the PDH and VWAP cluster — partials locked.
No Chasing: After the rejection, ORB Pro flagged “Blocked / Too Late,” keeping risk managed while trend flattened.
Result: Finished the day green with multiple small wins across calls — +$89.68 net on the $623C and +$15.89 on $626C.
📊 Performance Summary
Symbol Side Contracts Net Result
QQQ $623C Long 2 +$89.68
QQQ $626C Long 1 +$15.89
QQQ $622P Short hedge 1 –$3.11
Total P/L + $102.46 (Realized)
📈 Chart Recap
Price pushed through the early range with momentum but stopped exactly at the previous day’s ORB high and Fib confluence.
That rejection aligned perfectly with the HTF resistance zone on both 5-min and 15-min TFs.
The chart shows two green “LONG” entries and a clean signal fade once volume dropped —
a prime example of respecting structure over bias.
💡 Key Takeaways
PDH = Reaction Zone: Don’t ignore prior highs — they mark algorithmic defense zones.
Trust the Filters: ORB Pro prevented chasing the failed continuation after PDH rejection.
Structure First: The trendline breakdown confirmed what price was already telling us.
🧘♂️ Reflection
“The system signaled the move early, and I followed structure. PDH rejection confirmed the top, and discipline locked the profit. The goal wasn’t to predict — it was to react with control.”
Educational Video pt. 2 Found a couple trades and gave some good reasoning on why I would take them ..... 'like' this video

Educational video. Hit the 'LIKE' button if this helped you.This is my thought process on how to trade. If you would like me to post more recorded videos like this.. or even when I am in a trade , please feel free to 'COMMENT' below this video. This is my logic on the market and this is why my name is NASDAQNYK. You dont need 20 indicators on your charts, you dont need anything but your eyes and 3 confluences to determine your typical entry and exit. Trading is only hard when you make it hard.

Emotional Trading AreaBehavior Analysis combined with your price-action trading skills can help tremendously in making your trading decisions. I believe that candlestick wicks (shadow) show us where traders will act emotionally before executing their trades. These wicks indicate earlier price rejection and create and area where emotions take over before execution. Decision time.

Inflation and Interest Rates Impact in the Global Market1. Understanding Inflation and Interest Rates
Inflation refers to the sustained increase in the general price level of goods and services over time. It reduces the purchasing power of money—meaning each unit of currency buys fewer goods than before. Moderate inflation is a sign of economic growth, while excessive inflation (hyperinflation) can destabilize economies.
Interest rates, on the other hand, represent the cost of borrowing money. They are typically set by a country's central bank, such as the U.S. Federal Reserve (Fed), the European Central Bank (ECB), or the Reserve Bank of India (RBI). When inflation rises, central banks usually raise interest rates to control it; when inflation falls, they lower rates to stimulate borrowing and investment.
2. The Relationship Between Inflation and Interest Rates
The link between inflation and interest rates is both direct and inverse:
When inflation increases, central banks raise interest rates to slow down demand and stabilize prices.
When inflation decreases, interest rates are lowered to encourage spending and investment.
This balancing act aims to maintain price stability without hurting economic growth. However, in a globally connected economy, these changes affect not just domestic markets but also cross-border trade, capital flows, and investment sentiment.
3. Impact on Global Financial Markets
a. Stock Markets
Inflation and interest rates play a major role in determining stock market trends.
High Inflation: When inflation is high, companies face higher input costs (such as raw materials and wages), which reduce profit margins. Investors may anticipate lower earnings and reduce exposure to equities, causing stock prices to fall.
Rising Interest Rates: As borrowing becomes more expensive, businesses cut down on expansion plans, and consumers reduce spending. This lowers corporate revenues and earnings, leading to a bearish market.
For example, in 2022, the U.S. Federal Reserve’s aggressive rate hikes to curb inflation caused major global indices like the S&P 500 and NASDAQ to decline sharply. Technology and growth stocks were particularly affected due to their dependency on low borrowing costs.
b. Bond Markets
Bond prices and interest rates move in opposite directions.
When interest rates rise, the yields on newly issued bonds become more attractive, leading to a decline in the prices of existing bonds.
When rates fall, older bonds with higher yields gain value.
Global investors often shift between bonds and equities depending on the interest rate environment. For instance, when inflation is high and rates rise, investors may prefer short-term bonds or inflation-protected securities.
c. Currency Markets (Forex)
Inflation and interest rates significantly affect currency values.
A country with high interest rates often attracts foreign investors seeking higher returns, leading to currency appreciation.
Conversely, high inflation tends to devalue a currency, as its purchasing power erodes.
This dynamic can create volatility in foreign exchange markets. For example, the U.S. dollar typically strengthens when the Federal Reserve raises rates, as global investors move capital to dollar-denominated assets.
d. Commodity Markets
Commodities such as gold, oil, and agricultural products are closely tied to inflation trends.
High Inflation: Commodities often rise in price because investors use them as a hedge against inflation. Gold, for instance, tends to perform well when inflation is high or when real interest rates are negative.
Interest Rate Hikes: Higher interest rates can reduce demand for commodities by strengthening the currency and making holding physical assets less attractive.
In 2022–2023, oil and gold prices fluctuated heavily in response to inflationary pressures and central bank rate adjustments worldwide.
4. Impact on International Trade and Investment
a. Trade Balances
Inflation can affect a country's trade competitiveness. When domestic prices rise faster than those of trading partners, exports become more expensive, reducing demand from foreign buyers. Meanwhile, imports may become cheaper, worsening the trade balance.
Interest rates also influence trade. Higher rates tend to strengthen the domestic currency, making exports less competitive and imports cheaper—again, affecting trade dynamics.
b. Foreign Direct Investment (FDI)
Global investors closely monitor inflation and interest rate trends before committing capital.
Stable inflation and moderate interest rates attract long-term investment, as they indicate economic predictability.
High inflation and volatile rates discourage FDI due to uncertainty about future returns and exchange rate risks.
For example, emerging markets like India or Brazil attract foreign capital when inflation is under control and real interest rates are favorable.
5. Impact on Emerging and Developed Economies
a. Developed Economies
In advanced economies like the U.S., Japan, or the Eurozone, central banks use sophisticated tools to manage inflation and interest rates. However, global shocks—such as the COVID-19 pandemic or energy price spikes—can still cause inflationary surges that ripple through global markets.
Rising rates in these economies often lead to capital outflows from emerging markets as investors seek safer returns in stable currencies. This can cause volatility in developing countries’ stock and bond markets.
b. Emerging Markets
Emerging economies are more vulnerable to inflation and interest rate fluctuations because they rely heavily on foreign investment and imported goods. When global interest rates rise, these countries face higher borrowing costs and currency depreciation.
For instance, when the U.S. Federal Reserve increases rates, countries like India, Indonesia, or South Africa often experience currency pressure and foreign capital outflows. This impacts their stock markets and economic growth prospects.
6. Central Bank Strategies and Global Coordination
Central banks play a crucial role in managing inflation and interest rates. Major institutions such as the Federal Reserve, European Central Bank, Bank of England, and Bank of Japan use tools like:
Open market operations (buying or selling government bonds)
Reserve requirements
Policy interest rate adjustments
Global coordination among central banks is often necessary to avoid severe currency fluctuations or market shocks. For instance, during the 2008 financial crisis and the 2020 pandemic, major central banks collaborated to maintain global liquidity and stabilize financial systems.
7. Long-Term Implications for Global Markets
The long-term impact of inflation and interest rate movements includes:
Shift in Investment Strategies: Investors move between asset classes (equities, bonds, commodities) depending on rate trends.
Corporate Debt Management: Companies may restructure their debt portfolios to minimize interest burdens.
Economic Growth Patterns: Prolonged high rates may slow global growth, while ultra-low rates risk creating asset bubbles.
Policy Dilemmas: Central banks must balance fighting inflation with avoiding recession—a challenge seen frequently in recent years.
8. Conclusion
Inflation and interest rates act as the twin levers of the global economy. Their interplay determines the rhythm of economic growth, the flow of international capital, and the behavior of financial markets. While moderate inflation and balanced interest rates indicate a healthy economy, extreme conditions—either high inflation or rapid rate hikes—can trigger global instability.
For investors and policymakers, understanding this relationship is crucial. A rise in inflation signals the need for vigilance in portfolio management and monetary policy, while changing interest rates dictate shifts in market behavior across sectors and nations. In an interconnected world, the effects of these two forces transcend borders, shaping the future of trade, investment, and financial stability worldwide.

Key Pillars of Global Market SuccessKey Pillars of Global Market Success
In the modern interconnected world, success in the global market depends on much more than simply exporting products or services across borders. It involves mastering an ecosystem of strategies, competencies, and adaptability that allows businesses to thrive amid fierce competition, diverse consumer preferences, evolving technology, and changing regulations. Understanding the key pillars of global market success is crucial for any organization that aims to expand internationally, build a sustainable brand, and maintain long-term growth.
Below are the fundamental pillars that support success in the global marketplace.
1. Strong Market Research and Cultural Understanding
Before entering any foreign market, businesses must conduct thorough market research to understand the local culture, consumer behavior, economic environment, and regulatory structure. This goes beyond studying demographics or income levels; it involves understanding cultural nuances, preferences, and purchasing habits.
For instance, a marketing strategy that works in the United States may fail in Japan or India because of differences in communication style, color symbolism, and social norms. Companies like McDonald’s and Coca-Cola have succeeded globally because they localize their products — offering the McPaneer burger in India or tea-based beverages in China.
Effective market research also helps identify:
Consumer trends and unmet needs
Competitor strategies
Pricing expectations
Distribution challenges
Ultimately, cultural intelligence — the ability to adapt to local customs while maintaining a global identity — is one of the strongest foundations for global market success.
2. Product Innovation and Adaptability
Innovation is the lifeblood of global competitiveness. Successful global companies are those that continuously innovate to meet diverse consumer demands and rapidly changing technologies.
However, innovation must be combined with adaptability. A product that dominates one region may need to be redesigned for another. For example, automobile manufacturers often modify car designs for local road conditions, fuel quality, and climate. Similarly, software companies translate and localize their user interfaces for different languages and legal frameworks.
The key is to build a balance between standardization and customization. Standardization offers economies of scale and a unified brand identity, while customization ensures relevance in local markets.
Innovative adaptability also includes:
Sustainable product design
Integration of digital technologies
Customer-centric product development
Innovation and adaptability ensure that companies remain competitive, responsive, and resilient to global shifts in demand.
3. Effective Global Strategy and Vision
Every successful international business is built upon a clear strategic vision. This vision outlines why the company is expanding globally, where it intends to grow, and how it plans to achieve that growth.
A global strategy must align with the company’s core competencies while considering:
Market entry modes (exporting, franchising, joint ventures, acquisitions)
Localization vs. standardization decisions
Long-term investment and operational models
Supply chain and logistics networks
For instance, companies like Apple and Toyota have achieved success because of their well-defined global strategies that focus on efficiency, innovation, and customer experience.
Strategic clarity allows companies to avoid costly mistakes — such as entering markets without understanding local regulations or underestimating cultural resistance. It ensures that every move supports the company’s broader vision of global growth and brand leadership.
4. Strong Brand Identity and Reputation
A strong brand transcends borders. Global market success depends heavily on how consumers perceive and trust a brand. Reputation, once built, becomes a key competitive advantage that drives loyalty and market expansion.
Companies that consistently deliver quality, ethical practices, and transparency earn the trust of global customers. Apple, Nike, and Samsung are examples of brands that represent innovation, quality, and status — values that resonate worldwide.
Brand success in the global market also depends on:
Consistent brand messaging across cultures
Localized marketing campaigns that reflect local values
Corporate social responsibility (CSR) initiatives that enhance goodwill
Emotional connection through storytelling and authenticity
A powerful global brand acts as a bridge across cultures and markets, allowing companies to command premium prices and sustain long-term relationships.
5. Efficient Supply Chain and Operations Management
Operational efficiency and a resilient supply chain are vital for global competitiveness. The ability to source materials globally, manufacture efficiently, and deliver products on time defines a company’s success in international markets.
A robust supply chain ensures:
Cost optimization through global sourcing
Speed and flexibility in responding to market changes
Risk mitigation against disruptions such as geopolitical tensions or pandemics
Technological integration — such as blockchain for transparency or AI for demand forecasting — has revolutionized global supply chain management.
Companies like Amazon and Unilever have mastered this pillar by building logistics networks that span continents, supported by data analytics and automation. These efficiencies not only improve profitability but also enhance customer satisfaction and competitiveness.
6. Financial Strength and Risk Management
Global expansion requires significant financial resources. Success depends not only on investment capacity but also on the ability to manage risks such as currency fluctuations, inflation, political instability, and trade policy changes.
Companies must establish:
Hedging strategies for currency and interest rate volatility
Diversified revenue streams to offset regional downturns
Robust financial planning for taxation, compliance, and cost management
Financial resilience allows businesses to withstand global shocks, like the COVID-19 pandemic or trade wars, while continuing operations and maintaining investor confidence.
Additionally, access to global financing options — such as international bonds, venture capital, and foreign direct investments (FDIs) — strengthens a company’s ability to scale operations and explore new markets.
7. Talent Management and Cross-Cultural Leadership
Human capital is one of the most valuable assets in global success. Managing a diverse, cross-cultural workforce requires leadership that understands different values, work ethics, and communication styles.
Successful global firms emphasize:
Cross-cultural training for employees
Inclusive leadership that values diversity
Decentralized decision-making for regional responsiveness
Talent mobility programs to develop global leaders
For example, multinational companies like Google and IBM encourage internal global mobility, allowing employees to experience different cultures and bring innovative ideas to their roles.
Building global teams also enhances creativity, problem-solving, and adaptability — qualities essential for sustained success in international markets.
8. Technology Integration and Digital Transformation
Digital transformation is no longer optional; it is the backbone of modern global business success. Companies that leverage technology for marketing, operations, analytics, and customer engagement gain a massive advantage.
Key technological enablers include:
Artificial Intelligence (AI) for predictive analytics and automation
Big Data for consumer insight and personalized marketing
Cloud computing for scalable operations
E-commerce platforms for global reach
Digitalization allows even small and medium enterprises (SMEs) to compete internationally without the need for large physical infrastructure.
For instance, Shopify and Alibaba have enabled countless businesses to access global markets through online stores, while advanced logistics and digital payment systems simplify global trade transactions.
Thus, technology acts as both a driver of innovation and an equalizer that lowers barriers to global market entry.
9. Legal and Ethical Compliance
Operating globally requires strict adherence to international laws, trade agreements, and ethical standards. Failure to comply can lead to heavy penalties, brand damage, or even market bans.
Key compliance areas include:
Trade regulations and import/export duties
Data protection and privacy laws (e.g., GDPR in Europe)
Environmental sustainability standards
Anti-corruption and fair competition laws
Ethical conduct, corporate transparency, and sustainability practices are now essential for brand reputation and investor trust. Companies that integrate Environmental, Social, and Governance (ESG) principles attract more customers and long-term investors.
A responsible global business does not merely chase profit; it contributes to global well-being and sustainable development.
10. Customer-Centric Approach and Relationship Building
At the heart of global market success lies one universal truth — the customer is king. Businesses that place customers at the center of their strategy are more likely to succeed globally.
This involves:
Listening to customer feedback from diverse markets
Offering localized support and services
Using data analytics to personalize offerings
Building long-term trust rather than focusing solely on short-term sales
Companies like Amazon, Netflix, and Starbucks excel because they continuously adapt their customer experience using data-driven insights. A strong customer relationship not only drives loyalty but also builds powerful word-of-mouth reputation in new markets.
11. Sustainability and Social Responsibility
Modern consumers, investors, and regulators increasingly expect businesses to operate sustainably. Environmental and social responsibility is no longer a marketing choice but a business imperative.
Sustainability includes:
Reducing carbon footprint and waste
Ethical sourcing of raw materials
Supporting community development
Transparent ESG reporting
Brands that align their operations with global sustainability goals (like the UN Sustainable Development Goals) not only attract conscious consumers but also secure long-term stability by reducing regulatory risks.
Companies like Tesla, Patagonia, and Unilever have demonstrated how sustainability can be integrated into the business model while maintaining profitability.
12. Continuous Learning and Adaptation
The global market is dynamic — what works today may not work tomorrow. Continuous learning, innovation, and adaptation are the final and most enduring pillars of success.
Businesses must stay alert to:
Technological disruptions (AI, automation, blockchain)
Changing trade policies and tariffs
Evolving consumer expectations
Economic and geopolitical shifts
Agile companies that embrace change, experiment, and learn from failures can sustain success in the ever-evolving global landscape.
Conclusion
Global market success is not built overnight. It requires a combination of strategic clarity, cultural understanding, innovation, and resilience. The twelve pillars discussed above — from research and adaptability to sustainability and learning — form an integrated framework that helps businesses expand internationally while maintaining a strong competitive edge.
The global marketplace rewards those who can balance local relevance with global vision. Companies that invest in people, technology, ethics, and innovation not only achieve profitability but also become agents of positive global change.
In essence, the true measure of global market success lies in creating lasting value — for customers, employees, communities, and the planet — while navigating an ever-changing world with agility and integrity.

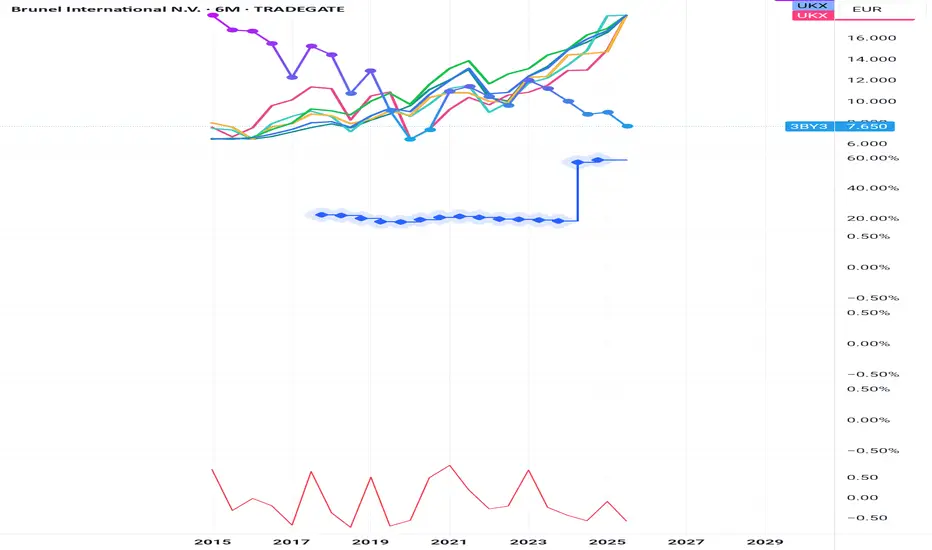
Will History Repeat Itself? NASDAQ 2025 vs 2020The NASDAQ 100 is currently showing a striking structural symmetry to the 2020 pre-crash formation.
Both phases formed a 5-wave impulsive rally, followed by tight consolidation near highs — a typical distribution top pattern.
The 20-day EMA is starting to flatten, signaling a possible loss of momentum.
If symmetry continues, the index could mirror a short- to mid-term correction, similar to early 2020’s breakdown.
While macro conditions differ today, market behavior often repeats in fractal patterns — a reminder that price structure often precedes headlines.
📊 Keep watch for a confirmed EMA rollover and breakdown below support near 25,500 — that could validate the bearish symmetry.

Risks and Opportunities in the Global Market1. Introduction: The Global Market Landscape
The global market is a dynamic system where goods, services, and capital flow freely across national borders. This system thrives on globalization — the process of increasing interdependence among nations through trade, investment, technology, and finance. Over the last few decades, international trade agreements, technological advancements, and digital transformation have made global markets more accessible.
However, with this increased connectivity comes vulnerability. A crisis in one country can ripple across continents, as seen during the 2008 financial crisis or the COVID-19 pandemic. Thus, participants in the global market must constantly balance risk management and opportunity recognition.
2. Major Risks in the Global Market
a. Economic and Financial Risks
Economic fluctuations, inflation, and interest rate volatility are among the biggest risks in the global market. For instance, a sudden rise in U.S. interest rates can trigger capital outflows from emerging markets, leading to currency depreciation and financial instability.
Global recessions or slowdowns also reduce demand for exports, affecting developing economies reliant on trade. Moreover, the interconnected nature of financial markets means that a crisis in one major economy often spreads rapidly worldwide.
b. Geopolitical Risks
Political instability, trade wars, sanctions, and conflicts can disrupt global supply chains and impact investor sentiment. Recent examples include the Russia-Ukraine war and tensions in the Middle East, both of which caused oil price volatility and uncertainty in global energy markets.
Geopolitical risks can also lead to protectionism — where countries impose tariffs or restrict trade to protect domestic industries, slowing global commerce and increasing costs.
c. Currency and Exchange Rate Risks
In global business, currency fluctuations can significantly affect profits. When a company operates across multiple countries, it earns revenue in different currencies. If one currency weakens, it can reduce the company’s overall earnings when converted back to the home currency.
For instance, exporters from Japan or Europe often face profit declines when their local currency strengthens against the U.S. dollar. Managing this risk often requires complex hedging strategies.
d. Supply Chain Disruptions
Global supply chains have become more fragile due to over-dependence on certain regions for manufacturing and raw materials. Events like natural disasters, pandemics, or geopolitical tensions can halt production and raise costs. The COVID-19 pandemic exposed how vulnerable global supply networks are, leading many companies to rethink their sourcing strategies and focus on supply chain diversification.
e. Technological and Cybersecurity Risks
While technology drives globalization, it also introduces cyber threats and data privacy issues. Hackers and cybercriminals target multinational companies, leading to financial losses and reputational damage.
Moreover, as automation and artificial intelligence (AI) reshape industries, there’s a risk of job displacement and unequal technological adoption between countries, which can widen global inequality.
f. Environmental and Regulatory Risks
Climate change and environmental degradation are becoming major global concerns. Governments worldwide are enforcing stricter environmental laws and carbon regulations. Businesses that fail to adopt sustainable practices face penalties, reputational harm, or exclusion from eco-conscious markets.
At the same time, frequent natural disasters and changing weather patterns threaten agricultural output, infrastructure, and supply stability.
3. Key Opportunities in the Global Market
a. Expansion of Emerging Markets
Emerging economies like India, Indonesia, Vietnam, and several African nations are projected to lead global growth in the coming decades. These regions have young populations, expanding middle classes, and growing consumer demand.
For investors and multinational companies, emerging markets offer new avenues for trade, infrastructure development, and technology adoption. Global brands can tap into these markets by offering affordable, localized products and services.
b. Technological Innovation and Digital Transformation
Digital technologies — from AI to blockchain and 5G — are revolutionizing how businesses operate globally. E-commerce, fintech, and cloud computing have reduced entry barriers for small and medium enterprises (SMEs) to reach international customers.
Companies that embrace digital transformation gain efficiency, lower costs, and can compete globally. Moreover, digital finance and cryptocurrencies are opening new frontiers for cross-border transactions.
c. Sustainability and Green Investments
The global shift toward sustainability presents enormous opportunities. Clean energy, electric vehicles, and carbon-neutral products are attracting massive investment. Governments and institutions are pushing for green finance and environmental, social, and governance (ESG) compliance.
Investors who focus on sustainable assets are likely to benefit as the world transitions to a low-carbon economy. This creates new markets in renewable energy, waste management, and sustainable agriculture.
d. Diversification and Strategic Alliances
Globalization allows companies to diversify their production, investment, and sourcing strategies. Instead of depending on a single region, businesses can build strategic alliances and joint ventures across countries.
For example, technology partnerships between Western and Asian firms allow access to new technologies and talent pools, enhancing innovation and competitiveness.
e. Global Talent and Knowledge Sharing
The digital era has made it possible for organizations to tap into global talent pools. Remote work and cross-border collaboration have become common, allowing firms to recruit the best minds from anywhere in the world.
Knowledge sharing across borders fosters innovation, research, and cultural exchange, enriching global productivity and creativity.
f. Rising Global Consumer Base
The global middle class is expanding rapidly — especially in Asia and Africa. This surge in purchasing power offers companies a vast consumer market. Industries like e-commerce, entertainment, finance, and healthcare are seeing strong growth due to changing lifestyles and increasing digital adoption.
4. Balancing Risks and Opportunities
To succeed in the global market, companies and investors must skillfully balance risk management with opportunity pursuit.
Some effective strategies include:
Diversification: Investing across countries, sectors, and currencies to reduce exposure to regional risks.
Hedging: Using financial instruments like futures, options, and swaps to mitigate currency and interest rate risks.
Scenario Planning: Preparing for multiple future possibilities by forecasting economic, political, and technological shifts.
Sustainability Integration: Adopting green practices not only reduces risk but also attracts conscious investors and customers.
Agile Operations: Building flexible supply chains and digital infrastructure to adapt quickly to global disruptions.
5. Conclusion
The global market is a double-edged sword — filled with unprecedented opportunities but also heightened risks. Businesses that understand this balance and adapt proactively are best positioned to thrive.
While risks such as economic volatility, geopolitical conflicts, and regulatory challenges cannot be fully eliminated, they can be managed through strategic planning and diversification.
At the same time, opportunities arising from digital transformation, sustainability, and emerging markets provide pathways to long-term growth and profitability.
In the evolving global landscape, success will depend not just on expansion but on resilience, adaptability, and foresight — the ability to navigate uncertainty while seizing the immense potential the global market offers.

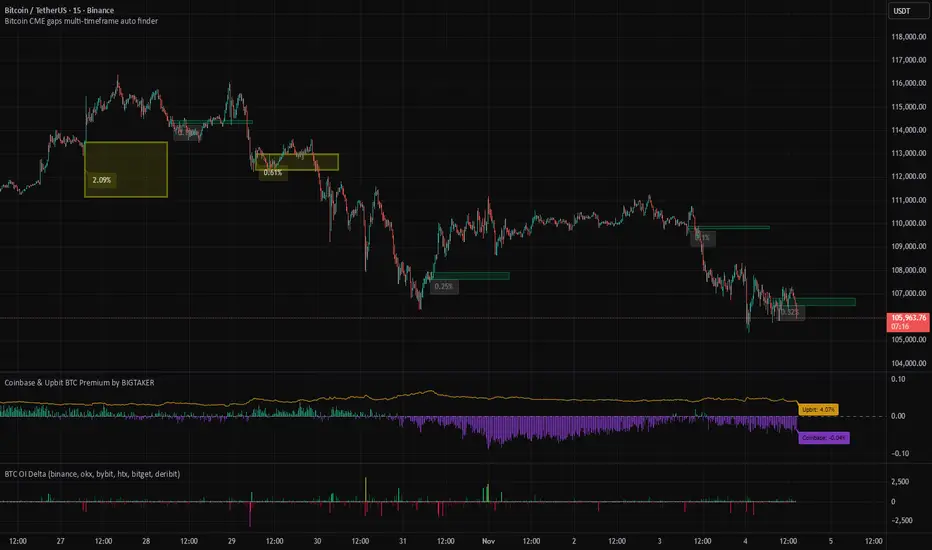
How to use bitcoin CME gap auto finder indicator on tradingview📊 Bitcoin CME Gap Auto Detection and Visualization Indicator
The Pine Script-based indicator Bitcoin CME gaps multi-timeframe auto finder is a TradingView tool designed for cryptocurrency traders and investors to automatically identify and visualize Bitcoin CME (Chicago Mercantile Exchange) futures market gaps across multiple timeframes.
The Bitcoin CME futures market often creates price gaps after weekends or holidays when trading resumes. These gaps typically represent market imbalances, and many traders believe that price levels where gaps occur are likely to be revisited in the future.
This concept is known as the "Gap Fill" theory, where such gaps are considered key price zones that may act as support or resistance levels.
Traditionally, manually identifying these gaps requires checking multiple timeframes and verifying weekend/holiday sessions, which is both tedious and time-consuming.
Indicator Link: Bitcoin CME gaps multi-timeframe auto finder
🔑 Key Features of the Indicator
Automated Gap Detection: Saves traders the time and effort of manually searching for and marking gaps.
Cross-Exchange Synchronization: CME gap boxes are displayed in sync on other Bitcoin charts such as BTCUSDT, BTCUSDT.P, and BTCUSD.
Multi-Timeframe Analysis: Displays gaps simultaneously across various timeframes (5m, 15m, 30m, 1h, 4h, 1D), providing multiple market perspectives.
Visual Clarity: Clearly highlights gap zones, with major gaps emphasized for quick trader recognition.
Strategic Trading Support: Provides essential information for developing and executing gap fill-based trading strategies.
CME Gap History: Allows users to review all past CME gaps formed in historical candles.
Alert Functionality: Sends real-time notifications when new gaps are detected, helping traders respond promptly to market changes.
⚙️ Main Functions and Usage
This indicator provides a wide range of customizable input options, allowing traders to adapt it to their specific analytical needs.
CME Gap Settings:
CME Symbol for Gaps: Specifies the symbol used to fetch CME futures data. The default is “BTC1!” (Bitcoin CME Futures).
Minimum gap percentage (%): Sets the minimum price movement recognized as a gap, allowing users to filter out minor fluctuations and focus on significant ones.
Display Timeframes:
Enables or disables gap visualization for each timeframe (5m, 15m, 30m, 1h, 4h, 1D). Users can activate only the timeframes they prefer to analyze.
Box Colors:
Customizable colors for each timeframe and gap direction (upward/downward), allowing easy visual distinction between gap types.
Box Extension Lengths (Bars):
Sets the number of bars the gap box extends to the right for each timeframe.
This visually illustrates how gap zones can remain relevant as future support/resistance levels.
Label Settings:
Show labels: Toggles the display of percentage labels for gaps.
Label position: Adjusts where the label appears inside the box.
Label text size: Controls the label font size.
Highlight Settings:
Highlight gap % (>=): Emphasizes gaps larger than a specified percentage, providing visual alerts for major gaps.
Highlight label text color: Sets the text color for highlighted gap labels.
Highlight box color: Defines the color for highlighted gap boxes.
Highlight box border width: Adds adjustable border thickness to highlighted gap boxes, making significant gaps stand out even more.
Alert Settings:
Enable Alerts: Toggles alert activation when gaps occur.
Alert Timeframe: Choose specific timeframes for receiving alerts or enable alerts for all timeframes.
🚀 How It Works
The indicator retrieves CME futures data (BTC1!) and compares the previous bar’s close/high/low with the current bar’s open across multiple timeframes to identify gaps.
It is specifically designed to detect gaps that occur when the market reopens after weekends or holidays.
Once a gap is detected, the indicator draws a box to visually mark it on the chart.
If the gap size exceeds the user-defined threshold, the box is emphasized using a highlight color and thicker border for greater visibility.
💡 Trading Strategies and Applications
Support and Resistance Identification:
CME gap zones often act as strong support or resistance levels.
Unfilled gaps may indicate potential price return zones, serving as signals for possible reversals or trend continuation.
Gap Fill Strategy:
Many traders believe that gaps tend to be filled eventually.
This indicator can help identify potential entry and exit points for gap fill trades.
For example, after a downward gap, traders might consider entering a long position when the price begins to recover toward the upper boundary of the gap and close the trade once the gap is filled.
Market Sentiment Analysis:
The size and frequency of gaps can reflect strong market movements or uncertainty.
Large gaps often indicate intense buying or selling pressure, and highlighted gaps help quickly identify these significant market events.
Multi-Timeframe Confirmation:
When gaps occur simultaneously across several timeframes, it underscores the importance of that price zone.
For instance, if a gap appears on both the 1-hour and 4-hour charts, traders should pay close attention to potential price reactions at that level.
Opportunity Detection via Alerts:
By enabling alerts, traders can monitor market changes in real time and act immediately when new gaps form — particularly useful for short-term or high-frequency strategies requiring fast decisions.
🚨 Cautions
Gap fills are not guaranteed: While gaps often tend to be filled, not all of them will, and some may take a long time.
Time zone configuration: Since the CME operates in specific trading hours, make sure the indicator’s GMT+9 timezone matches your local trading setup on TradingView.
Avoid using in isolation: Combine this indicator with other technical tools (e.g., moving averages, RSI, volume indicators) to enhance reliability and accuracy.
※ If you found the Bitcoin CME gap auto finder indicator helpful, please give it a like and follow.
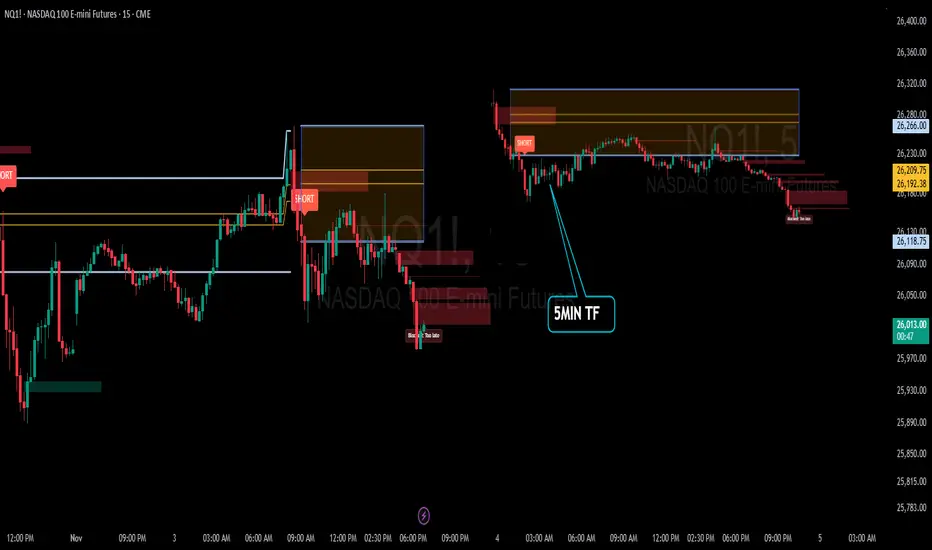
Recap: ORB Pro in Action | “Discipline > Direction”Date: November 3rd 2025
Ticker: QQQ / NQ1! (5-min TF)
Strategy: ORB Pro + Golden Pocket Retest + Volume Filter
Focus: Trend confirmation & controlled execution
🧭 Market Context
The morning opened sideways inside the ORB range — no clean conviction early on.
Around mid-morning, sellers gained control as lower highs formed beneath the EMA band and the Golden Pocket retest (0.5/0.618) failed with volume confirmation.
That break produced the clean short setup of the day, perfectly aligned with the higher-timeframe (HTF) downtrend.
🧠 Trade Review
Early Entries: Entered pre-confirmation and took initial heat.
Mid-Morning Setup: All filters aligned — EMA, volume, HTF direction. This was the textbook short that delivered follow-through.
Late Session Attempts: Momentum faded after lunch, with signals correctly blocked as “Too Late.”
Result: Several small wins offset by early losses, closing the day + $7.34 realized P/L after fees.
📊 Performance Snapshot
Metric Value
Win Rate ≈ 42 %
Best Trade + $287.94
Largest Loss – $189.05
Net Result + $7.34 (Realized)
Setup Accuracy High — execution mixed
📈 Chart Breakdown
The 5-minute chart highlighted a short trigger around 26 260 – 26 280, with smooth continuation into ORB extensions.
The ORB Pro filter marked “Blocked / Too Late” after the move — confirming that the system logic protected capital from late chases.
💡 Key Takeaways
Patience > Prediction — early entries rarely pay off.
Protect Green — partial profit lock once 1 R:R is reached.
System Strength — ORB Pro continues to validate structure when filters align.
🧘♂️ Reflection
“The system nailed the move — I jumped early. Still finished green, proving that execution discipline is the real edge. Tomorrow’s goal: one clean setup, one confident hold, and protect the profit.”
🧩 Next Steps
✅ Wait for full confirmation before entry
✅ Hold until 1:2 R:R min
✅ Avoid re-entries once HTF zone is tapped
Example of a Trading Style
Hello?
Hello, fellow traders.
Follow me to get the latest information quickly.
Have a great day.
-------------------------------------
While it's ideal to always close a trade in profit, this isn't always the case.
Therefore, you should maintain your trade by locking in profits through fractional trading.
Based on the trading information provided by the exchange, once a trade has turned into a loss, it's likely to take a considerable amount of time to turn into a profit again.
Therefore, you should trade at different buy and sell prices.
However, this is a rather tedious process, so it's not usually done that way.
-
If you were to buy near the area shown on the chart, the estimated average purchase price would be significantly higher than the current price.
Therefore, you wouldn't be able to proceed with the trade.
Therefore, we must trade by purchase price.
The purchase prices for positions 1 and 2 are quite high, so we don't pay attention to them.
Since the current price is near the purchase price for position 3, if it turns into a profit, you can sell the amount you purchased near position 3 to lock in the profit.
By subtracting this profit from the purchase price for positions 1 and 2, you can minimize your losses.
This trading method is possible because the coin market allows trading in decimals.
The key here is to trade by purchase price.
You should not trade in units of the number of coins you purchased.
For example, if you purchased $100 at point 3 (106431.68), you should sell $100 when the price rises.
Trading this way will allow you to quickly recover from losses and even generate profits even during losses.
-
You can profit whenever volatility occurs, regardless of whether the asset (coin or token) you're trading is in a loss or a profit.
You should avoid increasing the number of assets (coins or tokens) you're trading without managing them.
------------------------------------------------
To do this,
1. Mark support and resistance points on the 1M, 1W, and 1D charts.
2. Develop a basic trading strategy using these support and resistance points.
3. Avoid greed and execute split trades according to your trading strategy.
-
Thank you for reading to the end. I wish you successful trading.
--------------------------------------------------

Backtesting 101: How to Turn an Idea Into a Tested StrategyEvery trader has thought it:
“If I’d just followed that setup every time, I’d be up big.”
That’s where backtesting steps in, it separates luck from logic.
It’s how you find out whether your strategy has a real edge, or just worked in hindsight.
Most traders skip it, not because it’s useless, but because it forces them to face the truth.
But if you can handle that truth, backtesting will make you a far more confident trader.
What Backtesting Really Is
Backtesting means applying your trading rules to historical data to see how your system would have performed.
It’s not about predicting the future, it’s about proving whether your idea works in different market conditions.
When done properly, it gives you three key insights:
Profitability: does your edge actually exist?
Risk: how deep are the drawdowns, and can you handle them?
Consistency: does it work across bull, bear, and sideways markets?
A solid backtest gives you confidence, not because it guarantees profit, but because it exposes weakness before the market does.
The Most Common Mistakes
Curve-fitting: tweaking rules until the past looks perfect.
Ignoring fees and slippage: small costs that quietly erase profits.
Testing too little data: short periods create false confidence.
Focusing on one market: edges must survive different conditions.
If your backtest looks too clean, it’s probably lying to you.
Why It Matters
Backtesting builds trust in your system and discipline in yourself.
When you know your data, you stop second-guessing every trade.
Losing trades stop feeling like failure, because you understand they’re part of a proven edge.
Even bots rely on backtesting. Without it, automation is just random execution.
With it, every trade follows structure, not emotion.
All of these points make a difference between a winning or losing strategy.
From Idea to System
Every strategy starts as a hypothesis.
Backtesting turns that hypothesis into data.
Data turns into structure.
Structure turns into consistency.
That’s the real path to professional trading - logic first, emotion second.

Anatomy of a Breakaway Gap & What Happens NextAMZN is an excellent example of a Breakaway gap due to improvement of the company's fundamentals. The prior fundamental level is clearly defined on the chart and easy to see. The new fundamental level has not yet been fully established and will begin to form over the next few weeks.
Even if there is a Flash Crash, the fundamental lows of the previous level are very strong support.
What to watch for in the stock price action over the next few weeks:
1. Dark Pool accumulation in the Buy Zone.
2. Pro Trader nudges.
3. Speculative trading by Smaller funds managers.

Part 2 Support and Resistance Key Terms in Option Trading
Before diving deeper, it’s important to understand some key terms:
Underlying Asset: The financial asset on which the option is based (e.g., Nifty, Bank Nifty, Reliance Industries stock).
Strike Price: The fixed price at which the holder can buy or sell the underlying asset.
Expiry Date: The date when the option contract expires.
Premium: The price paid by the buyer to the seller (writer) of the option.
Lot Size: The minimum quantity of the underlying asset in one option contract.
In-the-Money (ITM): When exercising the option is profitable.
Out-of-the-Money (OTM): When exercising the option is not profitable.
At-the-Money (ATM): When the strike price is equal (or close) to the current market price of the underlying asset.

Commodity Futures in World Trading1. Understanding Commodity Futures
A commodity future is a standardized legal contract to buy or sell a specific quantity of a commodity at a predetermined price on a future date. Commodities can be broadly classified into hard commodities—such as crude oil, gold, and natural gas—and soft commodities like wheat, coffee, sugar, and cotton. These contracts are traded on regulated exchanges like the Chicago Mercantile Exchange (CME), London Metal Exchange (LME), Intercontinental Exchange (ICE), and the Multi Commodity Exchange (MCX) in India.
Futures differ from spot trading because they involve agreements for future delivery, though in most cases, contracts are settled financially rather than through physical delivery. Traders use futures to hedge against risk or to profit from anticipated price changes.
2. Historical Background of Commodity Futures
The origin of commodity futures can be traced back to the 17th century Japanese rice markets, where merchants and samurai used forward contracts to lock in rice prices. However, the modern system began in 1848 with the establishment of the Chicago Board of Trade (CBOT), which formalized futures trading for agricultural commodities like corn and wheat. Over time, the system expanded to include metals, energy, and financial instruments, transforming commodity futures into a sophisticated tool of global finance.
3. Key Players in the Commodity Futures Market
The commodity futures market involves several participants, each playing a distinct role:
Hedgers: Producers and consumers who use futures to protect themselves from adverse price movements. For example, an oil producer may sell crude oil futures to lock in prices, while an airline might buy fuel futures to stabilize costs.
Speculators: Traders and investors who take positions to profit from price fluctuations. They provide liquidity to the market.
Arbitrageurs: Professionals who exploit price differences across markets to earn risk-free profits.
Clearing Houses: Entities that guarantee contract performance and minimize counterparty risk.
Exchanges and Regulators: Institutions that oversee trading and ensure transparency and fairness.
4. How Commodity Futures Work
When two parties agree on a futures contract, they commit to buy or sell a commodity at a set price on a specific date. Each contract specifies:
Quantity and quality of the commodity
Delivery date and location
Standardized terms set by the exchange
Traders must deposit an initial margin, a small percentage of the contract value, as a performance guarantee. Prices are marked to market daily—profits and losses are settled based on daily price changes. This ensures that both parties maintain sufficient capital to cover their positions.
At expiration, the contract is either settled by physical delivery (actual exchange of goods) or cash settlement, where differences between the contract and market prices are paid.
5. Importance of Commodity Futures in Global Trade
Commodity futures are indispensable in global trade for several reasons:
a. Price Discovery
Futures markets provide a transparent mechanism for determining global commodity prices. Since prices are driven by collective expectations of traders worldwide, they reflect real-time supply and demand conditions.
b. Risk Management
Producers, exporters, and importers use futures to hedge against price volatility. For instance, a farmer can lock in the price of wheat before harvest, ensuring stable income despite market fluctuations.
c. Market Liquidity
Speculators and institutional traders bring liquidity to the market, enabling quick transactions without major price disruptions.
d. Global Economic Stability
By mitigating price risks and ensuring consistent supply chains, futures contribute to macroeconomic stability, especially in energy and food sectors.
e. Investment Diversification
Commodity futures allow investors to diversify portfolios beyond traditional assets like equities and bonds. Commodities often move differently from stock markets, providing a hedge during inflationary periods.
6. Major Commodity Exchanges Around the World
Several global exchanges facilitate commodity futures trading:
Chicago Mercantile Exchange (CME) – The largest futures exchange, trading in energy, metals, and agricultural commodities.
Intercontinental Exchange (ICE) – Known for energy products like crude oil and natural gas.
London Metal Exchange (LME) – Specializes in base metals like copper, aluminum, and zinc.
Tokyo Commodity Exchange (TOCOM) – Trades energy, metals, and rubber.
Multi Commodity Exchange (MCX), India – A leading exchange for gold, crude oil, and agricultural commodities in Asia.
These exchanges operate electronically, ensuring efficiency, transparency, and real-time global access.
7. Major Commodities Traded in Futures Markets
Commodity futures span across several categories:
Energy: Crude oil, natural gas, heating oil, gasoline
Metals: Gold, silver, platinum, copper, aluminum, zinc
Agriculture: Corn, wheat, soybeans, coffee, sugar, cotton
Livestock: Cattle, hogs, and poultry
Energy and metals are especially crucial to industrial economies, while agricultural futures influence food prices worldwide.
8. Economic Impact of Commodity Futures
Commodity futures influence global trade and economic policy in profound ways:
Inflation Indicator: Rising commodity prices often signal inflationary pressures.
Foreign Exchange Impact: Commodity-exporting nations’ currencies (like Canada, Australia, and Russia) often correlate with commodity prices.
Investment Tool: Institutional investors use commodity indices (like Bloomberg Commodity Index) to gain exposure to global resources.
Supply Chain Efficiency: Futures stabilize business planning for industries dependent on raw materials, ensuring smoother global supply chains.
9. Risks and Challenges in Commodity Futures
Despite their benefits, commodity futures carry inherent risks:
Price Volatility: Sharp market swings can lead to heavy losses for unhedged or speculative positions.
Leverage Risk: Since futures require only margin deposits, losses can exceed initial investments.
Market Manipulation: Large players may attempt to corner markets, influencing prices unfairly.
Regulatory Differences: Diverse rules across countries can create barriers to efficient global trading.
Geopolitical Uncertainty: Wars, sanctions, and trade disputes can disrupt global supply and impact futures prices dramatically.
10. The Future of Commodity Futures Trading
The landscape of commodity futures is evolving rapidly with technology, sustainability, and global economic shifts.
Digital Transformation: Algorithmic trading, AI-based analytics, and blockchain technology are revolutionizing trade execution and settlement processes.
Environmental Commodities: New futures contracts for carbon credits and renewable energy are emerging as sustainability becomes central to global policy.
Emerging Market Participation: Countries like India, Brazil, and China are becoming major players in commodity futures, increasing global liquidity.
Integration with Financial Markets: Commodity futures are increasingly intertwined with financial instruments, enabling broader participation from institutional investors.
Conclusion
Commodity futures are the lifeblood of the global trading system, balancing the interests of producers, consumers, and investors. They not only stabilize prices but also enable efficient allocation of resources and capital across economies. As markets evolve, driven by technology, environmental concerns, and geopolitical shifts, the role of commodity futures will become even more integral to ensuring transparency, liquidity, and resilience in world trade. For businesses, policymakers, and investors alike, understanding and leveraging commodity futures is essential for navigating the complexities of the modern global economy.
