Backtesting 101: How to Turn an Idea Into a Tested StrategyEvery trader has thought it:
“If I’d just followed that setup every time, I’d be up big.”
That’s where backtesting steps in, it separates luck from logic.
It’s how you find out whether your strategy has a real edge, or just worked in hindsight.
Most traders skip it, not because it’s useless, but because it forces them to face the truth.
But if you can handle that truth, backtesting will make you a far more confident trader.
What Backtesting Really Is
Backtesting means applying your trading rules to historical data to see how your system would have performed.
It’s not about predicting the future, it’s about proving whether your idea works in different market conditions.
When done properly, it gives you three key insights:
Profitability: does your edge actually exist?
Risk: how deep are the drawdowns, and can you handle them?
Consistency: does it work across bull, bear, and sideways markets?
A solid backtest gives you confidence, not because it guarantees profit, but because it exposes weakness before the market does.
The Most Common Mistakes
Curve-fitting: tweaking rules until the past looks perfect.
Ignoring fees and slippage: small costs that quietly erase profits.
Testing too little data: short periods create false confidence.
Focusing on one market: edges must survive different conditions.
If your backtest looks too clean, it’s probably lying to you.
Why It Matters
Backtesting builds trust in your system and discipline in yourself.
When you know your data, you stop second-guessing every trade.
Losing trades stop feeling like failure, because you understand they’re part of a proven edge.
Even bots rely on backtesting. Without it, automation is just random execution.
With it, every trade follows structure, not emotion.
All of these points make a difference between a winning or losing strategy.
From Idea to System
Every strategy starts as a hypothesis.
Backtesting turns that hypothesis into data.
Data turns into structure.
Structure turns into consistency.
That’s the real path to professional trading - logic first, emotion second.
X-indicator

Anatomy of a Breakaway Gap & What Happens NextAMZN is an excellent example of a Breakaway gap due to improvement of the company's fundamentals. The prior fundamental level is clearly defined on the chart and easy to see. The new fundamental level has not yet been fully established and will begin to form over the next few weeks.
Even if there is a Flash Crash, the fundamental lows of the previous level are very strong support.
What to watch for in the stock price action over the next few weeks:
1. Dark Pool accumulation in the Buy Zone.
2. Pro Trader nudges.
3. Speculative trading by Smaller funds managers.

Part 2 Support and Resistance Key Terms in Option Trading
Before diving deeper, it’s important to understand some key terms:
Underlying Asset: The financial asset on which the option is based (e.g., Nifty, Bank Nifty, Reliance Industries stock).
Strike Price: The fixed price at which the holder can buy or sell the underlying asset.
Expiry Date: The date when the option contract expires.
Premium: The price paid by the buyer to the seller (writer) of the option.
Lot Size: The minimum quantity of the underlying asset in one option contract.
In-the-Money (ITM): When exercising the option is profitable.
Out-of-the-Money (OTM): When exercising the option is not profitable.
At-the-Money (ATM): When the strike price is equal (or close) to the current market price of the underlying asset.

Commodity Futures in World Trading1. Understanding Commodity Futures
A commodity future is a standardized legal contract to buy or sell a specific quantity of a commodity at a predetermined price on a future date. Commodities can be broadly classified into hard commodities—such as crude oil, gold, and natural gas—and soft commodities like wheat, coffee, sugar, and cotton. These contracts are traded on regulated exchanges like the Chicago Mercantile Exchange (CME), London Metal Exchange (LME), Intercontinental Exchange (ICE), and the Multi Commodity Exchange (MCX) in India.
Futures differ from spot trading because they involve agreements for future delivery, though in most cases, contracts are settled financially rather than through physical delivery. Traders use futures to hedge against risk or to profit from anticipated price changes.
2. Historical Background of Commodity Futures
The origin of commodity futures can be traced back to the 17th century Japanese rice markets, where merchants and samurai used forward contracts to lock in rice prices. However, the modern system began in 1848 with the establishment of the Chicago Board of Trade (CBOT), which formalized futures trading for agricultural commodities like corn and wheat. Over time, the system expanded to include metals, energy, and financial instruments, transforming commodity futures into a sophisticated tool of global finance.
3. Key Players in the Commodity Futures Market
The commodity futures market involves several participants, each playing a distinct role:
Hedgers: Producers and consumers who use futures to protect themselves from adverse price movements. For example, an oil producer may sell crude oil futures to lock in prices, while an airline might buy fuel futures to stabilize costs.
Speculators: Traders and investors who take positions to profit from price fluctuations. They provide liquidity to the market.
Arbitrageurs: Professionals who exploit price differences across markets to earn risk-free profits.
Clearing Houses: Entities that guarantee contract performance and minimize counterparty risk.
Exchanges and Regulators: Institutions that oversee trading and ensure transparency and fairness.
4. How Commodity Futures Work
When two parties agree on a futures contract, they commit to buy or sell a commodity at a set price on a specific date. Each contract specifies:
Quantity and quality of the commodity
Delivery date and location
Standardized terms set by the exchange
Traders must deposit an initial margin, a small percentage of the contract value, as a performance guarantee. Prices are marked to market daily—profits and losses are settled based on daily price changes. This ensures that both parties maintain sufficient capital to cover their positions.
At expiration, the contract is either settled by physical delivery (actual exchange of goods) or cash settlement, where differences between the contract and market prices are paid.
5. Importance of Commodity Futures in Global Trade
Commodity futures are indispensable in global trade for several reasons:
a. Price Discovery
Futures markets provide a transparent mechanism for determining global commodity prices. Since prices are driven by collective expectations of traders worldwide, they reflect real-time supply and demand conditions.
b. Risk Management
Producers, exporters, and importers use futures to hedge against price volatility. For instance, a farmer can lock in the price of wheat before harvest, ensuring stable income despite market fluctuations.
c. Market Liquidity
Speculators and institutional traders bring liquidity to the market, enabling quick transactions without major price disruptions.
d. Global Economic Stability
By mitigating price risks and ensuring consistent supply chains, futures contribute to macroeconomic stability, especially in energy and food sectors.
e. Investment Diversification
Commodity futures allow investors to diversify portfolios beyond traditional assets like equities and bonds. Commodities often move differently from stock markets, providing a hedge during inflationary periods.
6. Major Commodity Exchanges Around the World
Several global exchanges facilitate commodity futures trading:
Chicago Mercantile Exchange (CME) – The largest futures exchange, trading in energy, metals, and agricultural commodities.
Intercontinental Exchange (ICE) – Known for energy products like crude oil and natural gas.
London Metal Exchange (LME) – Specializes in base metals like copper, aluminum, and zinc.
Tokyo Commodity Exchange (TOCOM) – Trades energy, metals, and rubber.
Multi Commodity Exchange (MCX), India – A leading exchange for gold, crude oil, and agricultural commodities in Asia.
These exchanges operate electronically, ensuring efficiency, transparency, and real-time global access.
7. Major Commodities Traded in Futures Markets
Commodity futures span across several categories:
Energy: Crude oil, natural gas, heating oil, gasoline
Metals: Gold, silver, platinum, copper, aluminum, zinc
Agriculture: Corn, wheat, soybeans, coffee, sugar, cotton
Livestock: Cattle, hogs, and poultry
Energy and metals are especially crucial to industrial economies, while agricultural futures influence food prices worldwide.
8. Economic Impact of Commodity Futures
Commodity futures influence global trade and economic policy in profound ways:
Inflation Indicator: Rising commodity prices often signal inflationary pressures.
Foreign Exchange Impact: Commodity-exporting nations’ currencies (like Canada, Australia, and Russia) often correlate with commodity prices.
Investment Tool: Institutional investors use commodity indices (like Bloomberg Commodity Index) to gain exposure to global resources.
Supply Chain Efficiency: Futures stabilize business planning for industries dependent on raw materials, ensuring smoother global supply chains.
9. Risks and Challenges in Commodity Futures
Despite their benefits, commodity futures carry inherent risks:
Price Volatility: Sharp market swings can lead to heavy losses for unhedged or speculative positions.
Leverage Risk: Since futures require only margin deposits, losses can exceed initial investments.
Market Manipulation: Large players may attempt to corner markets, influencing prices unfairly.
Regulatory Differences: Diverse rules across countries can create barriers to efficient global trading.
Geopolitical Uncertainty: Wars, sanctions, and trade disputes can disrupt global supply and impact futures prices dramatically.
10. The Future of Commodity Futures Trading
The landscape of commodity futures is evolving rapidly with technology, sustainability, and global economic shifts.
Digital Transformation: Algorithmic trading, AI-based analytics, and blockchain technology are revolutionizing trade execution and settlement processes.
Environmental Commodities: New futures contracts for carbon credits and renewable energy are emerging as sustainability becomes central to global policy.
Emerging Market Participation: Countries like India, Brazil, and China are becoming major players in commodity futures, increasing global liquidity.
Integration with Financial Markets: Commodity futures are increasingly intertwined with financial instruments, enabling broader participation from institutional investors.
Conclusion
Commodity futures are the lifeblood of the global trading system, balancing the interests of producers, consumers, and investors. They not only stabilize prices but also enable efficient allocation of resources and capital across economies. As markets evolve, driven by technology, environmental concerns, and geopolitical shifts, the role of commodity futures will become even more integral to ensuring transparency, liquidity, and resilience in world trade. For businesses, policymakers, and investors alike, understanding and leveraging commodity futures is essential for navigating the complexities of the modern global economy.

G7 and G20: Their Role in the Global Trading Market1. Introduction to G7 and G20
The G7 comprises seven advanced economies: the United States, the United Kingdom, Canada, France, Germany, Italy, and Japan. Originally formed in the 1970s during a period of oil crises and currency instability, the G7 served as a platform for coordinating economic policies among industrialized nations. It focuses on global economic governance, trade liberalization, and promoting free markets.
The G20, established in 1999, expanded this concept to include both advanced and emerging economies. It consists of 19 countries plus the European Union, representing around 85% of global GDP, 75% of international trade, and two-thirds of the world’s population. Members include countries such as China, India, Brazil, Russia, South Africa, and Indonesia, giving it a more representative global character.
2. G7’s Role in the Global Trading System
The G7 nations have historically dominated global trade due to their advanced industries, technological capabilities, and financial power. Their collective policies have often set the tone for global trade frameworks.
a. Promoting Free Trade and Market Liberalization
The G7 strongly advocates for open and rules-based trade systems governed by the World Trade Organization (WTO). Through summits and joint statements, the G7 emphasizes reducing trade barriers, opposing protectionism, and supporting intellectual property rights. Their influence is seen in the establishment of trade norms and the promotion of fair competition in global markets.
b. Setting Standards for Global Finance and Trade Regulation
G7 countries play a crucial role in standardizing international financial and trade regulations. They influence the International Monetary Fund (IMF), World Bank, and WTO policies. For example, during the 2008 global financial crisis, G7 discussions were key to stabilizing global markets and coordinating stimulus measures that prevented a deeper recession.
c. Driving Innovation and Technology in Trade
G7 countries are home to leading corporations in sectors like digital technology, finance, and manufacturing. Their leadership in digital trade, artificial intelligence, and green technologies shapes new trade frontiers. G7 discussions now frequently include issues like data governance, cybersecurity, and digital infrastructure—all crucial for modern trade systems.
d. Political and Strategic Influence
Beyond economics, the G7 uses trade as a geopolitical tool. Coordinated sanctions, trade agreements, and investment strategies are often employed to influence global politics. For instance, G7 sanctions against Russia in response to geopolitical conflicts demonstrate how trade policies intertwine with foreign policy and security concerns.
3. G20’s Role in the Global Trading Market
While the G7 represents industrialized powers, the G20 brings together both developed and emerging economies, offering a broader, more inclusive platform for global trade governance.
a. Balancing Global Economic Power
The G20 includes major developing economies like China, India, Brazil, and South Africa, which represent the dynamic growth engines of global trade. This inclusion has shifted global trade discussions from a Western-centric approach to a more balanced, multipolar dialogue. The G20 facilitates cooperation between the Global North and South, addressing trade inequalities and supporting sustainable growth in developing regions.
b. Managing Global Economic Crises
The G20 gained prominence during the 2008 global financial crisis. It coordinated fiscal and monetary policies, injected liquidity into the global system, and worked to reform international financial institutions. The coordinated response helped prevent a collapse of global trade and maintained confidence in international markets.
c. Trade Policy Coordination and Dispute Resolution
Through its annual summits, the G20 promotes dialogue on trade tensions, tariff disputes, and global supply chain disruptions. For example, the G20 has often served as a platform for addressing US-China trade conflicts and ensuring continued cooperation amidst protectionist tendencies. It supports a fair and transparent global trade system, aligning with the WTO framework.
d. Sustainable and Inclusive Trade Development
The G20 also emphasizes inclusive trade policies that benefit all segments of society. It advocates for sustainable trade practices, green infrastructure investments, and digital trade expansion. The G20 Osaka Summit (2019) and Rome Summit (2021) highlighted commitments to carbon neutrality, renewable energy, and digitalization—factors that redefine the future of global commerce.
e. Infrastructure and Investment Initiatives
One of the G20’s major contributions to trade is promoting global infrastructure development. The Global Infrastructure Hub and the Partnership for Global Infrastructure and Investment (PGII) aim to mobilize trillions of dollars in investments to improve trade connectivity, particularly in emerging economies. Enhanced logistics, ports, and digital networks directly contribute to global trade efficiency.
4. Impact on Global Trade Reforms
Both forums influence trade policy reforms in multiple ways:
WTO Modernization: They support WTO reforms to handle digital trade, e-commerce, and intellectual property issues.
Supply Chain Resilience: In response to pandemic disruptions, both G7 and G20 have pushed for diversification of supply chains and reducing over-dependence on single markets.
Digital and Green Trade: Their discussions set the stage for transitioning toward green economy models, promoting renewable energy trade and environmentally sustainable practices.
Fair Competition and Regulation: They push for fair taxation of multinational corporations, especially in the digital economy, ensuring balanced competition in global markets.
5. Challenges Faced by G7 and G20 in Global Trade
Despite their influence, both groups face several challenges:
Rising Protectionism: Trade wars, tariffs, and regional blocs threaten global cooperation.
Geopolitical Tensions: Conflicts among major members (e.g., US-China, Russia-West) often divide consensus.
Global South Representation: Developing countries still struggle for equal voice, especially in G7-dominated institutions.
Climate and Digital Divide: While they advocate sustainability, developing nations require financial support to meet green trade commitments.
6. The Future Outlook
The role of G7 and G20 will continue evolving as global trade dynamics shift. Emerging economies like India and Indonesia are becoming major trade powerhouses, giving the G20 increasing relevance. Meanwhile, the G7 remains a strategic body for aligning Western economic policies, particularly in technology and finance.
The future of global trade will likely depend on how these two groups cooperate to balance innovation, inclusivity, and sustainability. Their success in addressing challenges like digitalization, climate change, and inequality will define the next era of global commerce.
Conclusion
The G7 and G20 stand at the core of global economic and trade governance. The G7, with its advanced economies, provides leadership in shaping norms, innovations, and geopolitical strategies. The G20, with its broader membership, ensures inclusivity, stability, and equitable growth across developed and developing nations. Together, they act as twin pillars supporting a stable and evolving international trading system.
Their joint influence ensures that global trade remains resilient, rules-based, and oriented toward long-term prosperity, making them indispensable to the functioning of the modern world economy.

Spotting Inefficiencies in an Efficient MarketMarket Efficiency Theory;
Core Idea: Stock prices already include and reflect all available information.
Implication: It is very difficult (if not impossible) to consistently outperform the market because prices adjust quickly when new information appears.
Note: Markets are not perfectly efficient all the time — they can become inefficient in the short term due to emotions, news, or sudden events.
⚙️ Three Forms of Efficiency
Weak Form Efficiency
All past market prices and data are already reflected in current prices.
Therefore, technical analysis (chart patterns, trends) is useless because it can’t predict future prices.
Semi-Strong Form Efficiency
All public information (both technical and fundamental) is reflected in prices.
This means fundamental analysis (using financial statements, news, etc.) is also useless for gaining an edge.
Strong Form Efficiency
All information, including insider or private information, is already priced in.
So, no one can consistently outperform the market — not even insiders.
💡 Why Inefficiencies Exist
Markets aren’t perfectly efficient because human behavior and emotions often cause mispricing:
Investor emotions — Fear and greed can drive irrational buying or selling.
Market sentiment extremes — Overconfidence or panic can push prices too far.
Short-term behavioral mistakes — Herd mentality or cognitive biases lead to temporary inefficiencies.
🔍 Finding Inefficiencies
Although hard, traders can sometimes find and exploit short-lived inefficiencies:
Market sentiment indicators like VIX (volatility index) or put/call ratios signal extremes.
Seasonal trading strategies such as “Sell in May” patterns or year-end rallies.
Time arbitrage — taking advantage of short-term market overreactions.
Exploiting short squeezes when traders betting against a stock are forced to buy back.
⚠️ Difficult Markets for Traders
Some markets are naturally harder to trade efficiently:
Forex market: Highly competitive with huge volumes and professional players.
Commodities market: Often volatile and erratic due to unpredictable factors like weather, geopolitics, or demand shocks.
Conclusion:
Is it possible to find inefficiencies in the markets?
The markets are probably to a certain degree efficient, but we believe you can make good and consistent returns by using the right approach – which is to use empirical and quantified data for short-term strategies and by using common sense. Moreover, we believe the best place to start is in the stock market.
The markets are somewhat inefficient because of human folly. This is unlikely to change, which is good for the rational trader and investor. So the correct answer about inefficiencies is this: Yes, it’s possible to find inefficiencies in the markets.

Emotional Discipline and Risk Control in Trading🧠 1. Why Emotional Discipline Matters
Emotional discipline means sticking to your plan regardless of fear or greed.
Markets are designed to test your patience, confidence, and decision-making. Every losing trade tempts you to change your system — but consistency wins.
✅ Key habits of emotionally disciplined traders:
They accept losses without revenge trading.
They follow rules, not impulses.
They manage expectations — no trade will make them rich overnight.
💰 2. Risk Control — Protect Before You Profit
Your risk management defines your survival. Successful traders think in probabilities, not certainties. They never risk too much on one idea.
📏 Golden Rules of Risk Control:
Risk 1–2% of your capital per trade.
Always use a stop-loss, never a “mental” one.
Define your R:R ratio (minimum 1:2 or better).
Never add to a losing position — only to confirmed winners.
Risk control is not about avoiding losses — it’s about limiting damage and staying consistent over time.
🧩 3. How to Strengthen Emotional Discipline
Like a muscle, discipline grows with routine. Try this daily:
Pre-trade routine – review your plan before every session.
Post-trade journal – log your emotions, not just results.
Take breaks – emotional fatigue leads to poor judgment.
Detach from outcomes – focus on process, not profit.
💡 Tip: When you reduce emotional pressure, your clarity and accuracy both improve.
⚙️ 4. Professional Mindset Shift
Amateurs chase profit; professionals protect capital.
Each trade is just one data point — not a reflection of your worth. Once you start thinking like a risk manager first, your results change naturally.
🗣️ “Discipline is choosing what you want most over what you want now.”
📊 Conclusion
To grow as a trader, focus on controlling yourself before controlling the market.
Emotional stability + strict risk control = long-term success.
Be the trader who executes with logic, not emotion. 🧘♂️

Understanding Reserve Currency and Its Global RoleIntroduction: The Foundation of Global Financial Stability
In the intricate web of international finance, few concepts hold as much influence as the reserve currency. It is the lifeblood of global trade, the benchmark for economic stability, and a powerful symbol of national economic strength. A reserve currency is not merely a means of exchange—it is a cornerstone of global confidence. Countries around the world hold large quantities of certain currencies in their foreign exchange reserves to manage international trade, stabilize their domestic currencies, and meet external obligations.
Today, the U.S. dollar stands as the dominant reserve currency, though history has witnessed transitions—from the British pound sterling’s supremacy during the 19th and early 20th centuries to the dollar’s reign after World War II. However, with the world moving toward a multipolar economic system and technological innovations such as digital currencies reshaping finance, the concept and dominance of reserve currencies are being re-examined.
What Is a Reserve Currency?
A reserve currency is a foreign currency held by central banks and major financial institutions as part of their foreign exchange reserves. It is used to settle international transactions, influence exchange rates, and maintain financial stability. When a nation imports goods or services, settles debt, or intervenes in the forex market, it often uses a globally accepted currency like the U.S. dollar or the euro.
In simpler terms, it’s the currency other countries trust enough to use for global trade and as a store of value. A reserve currency must be stable, liquid (easy to buy and sell), and backed by a strong and credible economy.
Key examples of reserve currencies today include:
U.S. Dollar (USD)
Euro (EUR)
Japanese Yen (JPY)
British Pound Sterling (GBP)
Chinese Yuan (CNY) (gradually increasing in share)
Historical Evolution of Reserve Currencies
The evolution of reserve currencies mirrors global power shifts:
The British Pound Era (19th Century to Early 20th Century):
During the 1800s, the British Empire was at the height of its global influence. The pound sterling, backed by the gold standard and the vast colonial trade network, became the world’s primary reserve currency. It was trusted for its convertibility and Britain’s robust financial system.
The U.S. Dollar Ascendancy (Post-World War II):
After World War II, the Bretton Woods Agreement (1944) established the U.S. dollar as the central pillar of the global monetary system. The dollar was pegged to gold, and other currencies were pegged to the dollar. The U.S. economy’s post-war strength and stability made the dollar the most reliable global asset.
The End of the Gold Standard (1971):
In 1971, President Richard Nixon ended the dollar’s convertibility into gold—creating the modern fiat currency system. Despite this, the dollar maintained its dominance due to the size of the U.S. economy, military power, and the global acceptance of dollar-denominated assets such as U.S. Treasury bonds.
Emerging Competition (21st Century):
Over the past two decades, the euro and Chinese yuan have made gradual gains. However, no currency has yet displaced the dollar’s dominance, which remains unmatched in terms of global liquidity, trust, and network effects.
Why Reserve Currencies Matter
A reserve currency serves multiple purposes in global economics:
Facilitating International Trade:
Global trade is mostly conducted in reserve currencies. For instance, commodities like oil and gold are priced in U.S. dollars. This common currency standard simplifies transactions between countries and reduces exchange rate risk.
Store of Value for Central Banks:
Central banks hold reserve currencies to safeguard their economies from volatility. These reserves act as a financial cushion during crises—allowing countries to stabilize their currencies or pay for imports when domestic conditions are unstable.
Debt and Investment:
Governments and corporations issue bonds in reserve currencies, attracting global investors. This access to global capital reduces borrowing costs for countries whose currencies are considered stable.
Influence and Power Projection:
The nation issuing a reserve currency gains significant geopolitical leverage. The U.S., for example, can impose financial sanctions effectively because global trade and finance depend on dollar transactions.
The U.S. Dollar: The Reigning Reserve Currency
As of 2025, the U.S. dollar accounts for roughly 58–60% of global foreign exchange reserves, according to the International Monetary Fund (IMF). This dominance stems from several key factors:
Economic Strength:
The United States has the world’s largest economy, making the dollar a natural choice for trade and investment.
Deep and Liquid Financial Markets:
U.S. Treasury bonds are considered among the safest and most liquid assets in the world. Central banks and investors can buy and sell them easily, which increases confidence in the dollar.
Network Effect:
The more widely the dollar is used, the more attractive it becomes. This creates a self-reinforcing cycle that cements its dominance.
Military and Political Stability:
The U.S. government’s stability and global influence enhance trust in its currency, even in times of global uncertainty.
However, this dominance is not without challenges. The dollar’s centrality means that U.S. monetary policy—such as interest rate changes by the Federal Reserve—has global ripple effects, impacting borrowing costs, inflation, and trade balances worldwide.
The Euro and Other Contenders
The euro, introduced in 1999, was designed to rival the dollar’s supremacy. It represents a large economic bloc with a strong regulatory framework and deep capital markets. However, internal divisions among European Union members and debt crises in the region have limited its rise.
The Japanese yen and British pound remain important but secondary reserve currencies. Meanwhile, the Chinese yuan (renminbi) is gradually growing in use—thanks to China’s massive trade network and initiatives like the Belt and Road Initiative and the Asian Infrastructure Investment Bank (AIIB).
However, the yuan’s international acceptance is still constrained by capital controls, lack of full convertibility, and limited transparency in China’s financial markets.
Benefits for a Reserve Currency Issuing Nation
Holding the world’s reserve currency provides significant advantages to the issuing country:
Lower Borrowing Costs:
Global demand for U.S. Treasury securities allows the U.S. government to borrow at lower interest rates.
Trade Advantages:
The U.S. can purchase imports using its own currency, essentially creating demand for its dollars without needing foreign reserves.
Geopolitical Power:
The ability to impose sanctions, freeze assets, or cut off nations from the global dollar-based system gives the U.S. extraordinary influence in international affairs.
Financial Stability:
During crises, global investors often seek safety in dollar assets, reinforcing the U.S. financial system’s resilience.
Challenges and Criticisms of Reserve Currency Dominance
While being a reserve currency issuer has benefits, it also brings challenges:
The Triffin Dilemma:
Economist Robert Triffin highlighted that to supply the world with dollars, the U.S. must run trade deficits—exporting more dollars than it imports. However, persistent deficits can undermine confidence in the dollar’s long-term value.
Global Dependence on U.S. Policy:
When the Federal Reserve raises interest rates, capital often flows from emerging markets to the U.S., causing volatility and currency depreciation in those countries.
Weaponization of Finance:
The U.S. has increasingly used its control over the dollar-based system for sanctions. While effective politically, this has prompted other nations to seek alternative payment systems.
Emerging De-Dollarization Efforts:
Countries like China, Russia, and members of BRICS are actively exploring ways to reduce dependence on the U.S. dollar—such as bilateral trade in local currencies or creating shared digital currency systems.
The Rise of “De-Dollarization”
“De-dollarization” refers to the global movement to reduce reliance on the U.S. dollar for trade, finance, and reserves. This trend gained momentum after the U.S. imposed sweeping sanctions on Russia in 2022, freezing its dollar assets. In response, several nations began exploring alternative systems.
China and Russia have increased trade settlements in yuan and rubles.
India has initiated rupee-based trade mechanisms with select partners.
BRICS countries are discussing a potential common currency for trade and investment.
While these moves indicate gradual diversification, replacing the dollar entirely remains highly challenging due to its entrenched role in global finance and the lack of a fully equivalent alternative.
Digital Currencies and the Future of Reserve Systems
The next chapter in global currency evolution may be shaped by digital innovation. Central Bank Digital Currencies (CBDCs)—such as China’s Digital Yuan (e-CNY) and the potential Digital Euro—are being explored as tools for more efficient cross-border settlements.
These digital versions of national currencies could challenge traditional reserve systems by enabling direct international payments without intermediaries like SWIFT. If widely adopted, they could gradually reduce the dominance of traditional reserve currencies.
However, for digital currencies to serve as global reserves, they must ensure stability, convertibility, and global trust—conditions that currently remain under development.
A Multipolar Reserve Currency World
The global economy is slowly moving toward multipolarity, where several currencies share reserve roles instead of one dominant currency. This could enhance global stability by reducing overreliance on a single nation’s policies.
In such a system:
The U.S. dollar may remain dominant but with reduced share.
The euro and yuan could gain influence in regional trade.
Digital and commodity-backed currencies may emerge as alternative reserves.
However, such a transition would require decades of trust-building, regulatory cooperation, and geopolitical stability.
Conclusion: The Future of Global Monetary Balance
The concept of a reserve currency lies at the heart of global financial order. From the pound sterling’s imperial dominance to the U.S. dollar’s current reign, it has always reflected economic might, trust, and political influence.
Today, as globalization deepens and digital transformation accelerates, the future of reserve currencies may evolve beyond traditional boundaries. While the dollar’s supremacy remains intact for now, the push toward diversification, regional alternatives, and digital finance signals the dawn of a more balanced, interconnected, and resilient global monetary system.
The coming decades may not witness the fall of the dollar—but rather the rise of a more pluralistic reserve world, where power is shared, trust is distributed, and financial sovereignty becomes more evenly spread across nations.

PRICE ACTION – The True Language of the MarketIn the noisy world of trading, filled with indicators, signals, and formulas, Price Action brings you back to the core: price. When you remove all indicators, erase moving averages, and forget RSI, the only thing left on your chart is the footprint of the market – the candles telling their story.
What is Price Action – and why is it the “true language”?
Price Action is not a “magic trick” or an infallible trading system. It is the art of listening to the market, the ability to read the rhythm of money flow and human emotions reflected in every price movement. Each candle is not just data – it is a story of hope and fear, of buyers and sellers, of greed and doubt. A Price Action trader does not predict the market – they observe how the market reacts.
Price – where emotions are written in candles
Price never moves randomly. Every high and low is the result of millions of human decisions.
When price breaks a high: it’s confidence and euphoria.
When price breaks a low: it’s fear and panic.
When price moves sideways: it’s waiting and doubt.
Price Action teaches you to read the emotions behind each click, not just the shape of the candle.
Market structure – the backbone of Price Action
Behind every trend lies a clear structure. The market cycles through three phases:
Accumulation – buyers and sellers struggle, price moves sideways.
Expansion – one side dominates, trend forms.
Distribution – winners take profits, losers retreat.
Understanding market structure means knowing where you are in the cycle, avoiding blind trades, and acting with purpose.
Every candle – a small story in the bigger picture
A long lower shadow signals strong buying pressure.
A pinbar at resistance shows price rejection.
A series of small candles indicates accumulation and an impending breakout.
A Price Action trader does not see candles individually but connects them into the full story – where every move has a reason.
The power of simplicity
Price Action is simple, yet far from simplistic. It is not lagging like indicators, not dependent on false signals, and can be applied across all markets – from Forex and gold to crypto. When you read price action, you are no longer passive, waiting for a signal; you become the navigator, following the market’s heartbeat.
The mindset of a professional Price Action trader
A professional Price Action trader doesn’t ask, “When should I enter?” Instead, they ask:
Who is controlling the market?
Where is the money flowing?
Has this price area reversed before?
Am I moving with the money or against it?
The difference lies not in technique, but in mindset and reaction. The market doesn’t need you to win. It rewards those who understand how it operates.
When you read price, you understand people
Price Action is not a tool; it is a living perspective on market psychology. It doesn’t promise perfection, but it gives you profound understanding. When you read price – you are reading human psychology. When you understand structure – you grasp the rhythm of emotional cycles. And when you immerse yourself in Price Action, you are no longer guessing prices – you move with the market, heartbeat by heartbeat, move by move, opportunity by opportunity.

Halloween Special: The Risk “Treats” That Keep You Alive!🧠 If October has a lesson, it’s this: fear is useful, panic is fatal. Great traders don’t fight the monsters; they contain them.
Here’s my Halloween mindset & risk playbook:
🧪 Keep your “lifeline” small: Risk a fixed 1% per trade until your balance moves ±10%, then recalibrate. This makes loss streaks survivable and hot streaks meaningful.
⏰ Set a nightly curfew: a max daily loss (e.g., 3R or 3%). Hit it? Close the platform. No “one last trade.” Curfews save accounts.
🛑 Define your invalidation before you enter: If that level prints, you’re out, no arguments, no “maybe it comes back.” Plans beat feelings.
🎯 Hunt asymmetry: If you can’t see at least 2R cleanly (preferably 3R), pass. You don’t need more trades; you need better trades.
🧟 Kill the zombie trade: the one you’re babysitting, nudging stops, praying. If you’re managing hope more than risk, exit and reset.
🧘 Protect your mind equity: Two back-to-back losses? Take a 20-minute break. After a big win? Journal before you click again. Calmness compounds.
📜 Make a ritual: pre-trade checklist → position size → entry → stop → targets → log. Rituals turn uncertainty into routine, and routine into consistency.
What’s your #1 rule that keeps the “revenge-trading demon” out of your account❓
⚠️ Disclaimer: This is not financial advice. Always do your own research and manage risk properly.
📚 Stick to your trading plan regarding entries, risk, and management.
Good luck!
All Strategies Are Good; If Managed Properly!
~Richard Nasr

How Currency Valuations Impact Exporters and ImportersIntroduction
Currency valuation is one of the most powerful forces shaping global trade dynamics. Every day, trillions of dollars’ worth of goods, services, and investments cross borders, and the exchange rates between currencies determine how much value each participant gains or loses. A small shift in the rupee, dollar, euro, or yen can have a massive impact on exporters’ earnings, importers’ costs, and even a country’s overall trade balance.
For exporters and importers, understanding currency valuation is not just a financial technicality — it is a survival strategy. Whether a company sells machinery to Europe, imports raw materials from China, or outsources services to the U.S., fluctuations in exchange rates directly affect profitability, competitiveness, and strategic planning.
This essay explores how currency valuations influence exporters and importers, the mechanisms behind exchange rate movements, their implications on pricing, profitability, and policy decisions, and how businesses can manage the risks associated with currency fluctuations.
Understanding Currency Valuation
Currency valuation refers to the market-determined worth of one currency relative to another. It is usually expressed as an exchange rate — for example, ₹83 per U.S. dollar means that one dollar can be exchanged for 83 Indian rupees.
Exchange rates fluctuate due to a combination of factors such as:
Inflation differentials
Interest rate variations
Trade balances
Foreign investment flows
Central bank policies
Market speculation
When a currency appreciates, its value rises compared to others, meaning it can buy more foreign currency. When it depreciates, it loses value, meaning more domestic currency is needed to buy the same amount of foreign currency.
These movements, while often subtle on a daily basis, can have profound effects on international trade.
Impact on Exporters
Exporters earn revenue in foreign currencies but often bear costs in their home currency. Therefore, currency depreciation usually benefits exporters, while currency appreciation tends to hurt them. Let’s explore both situations.
1. Currency Depreciation: A Competitive Advantage
When a country’s currency depreciates, its goods and services become cheaper in foreign markets. For example, if the Indian rupee weakens from ₹75 to ₹85 per U.S. dollar, an American buyer can now buy more Indian products for the same amount of dollars.
This creates several benefits for exporters:
Price Competitiveness: Products appear cheaper abroad, boosting demand.
Higher Profits: Exporters earn more in domestic currency when converting foreign sales revenue.
Market Expansion: Depreciation can help penetrate new markets or outcompete suppliers from stronger-currency nations.
For instance, India’s textile and IT service exporters often benefit when the rupee weakens against the dollar. Their revenues in dollars translate into higher rupee earnings, improving margins even if prices remain constant.
2. Currency Appreciation: A Profit Squeeze
When a domestic currency strengthens, exporters face a dual challenge:
Their products become more expensive for foreign buyers, reducing competitiveness.
Their foreign revenues shrink in domestic terms.
For example, if the rupee appreciates from ₹85 to ₹75 per dollar, the same $1 million export sale now converts into ₹75 million instead of ₹85 million — a clear loss in rupee terms.
Unless exporters hedge their exposure or increase prices (which may hurt demand), their profit margins shrink significantly.
Industries that rely heavily on exports — such as automobiles, textiles, or pharmaceuticals — are particularly sensitive to such changes.
3. Long-Term Effects on Export Strategy
Persistent currency appreciation can force exporters to rethink their strategy:
Shift production abroad to reduce currency exposure.
Focus on higher value-added goods where price sensitivity is lower.
Increase use of financial hedging instruments.
On the other hand, a consistently weak currency can encourage export-led growth but might raise inflation due to costlier imports (like energy or components).
Impact on Importers
Importers face the opposite situation. They pay for foreign goods and services in foreign currencies but sell them domestically in their local currency. Hence, currency appreciation generally benefits importers, while currency depreciation hurts them.
1. Currency Appreciation: Lower Import Costs
When the domestic currency strengthens, importers gain purchasing power. They can buy more goods from abroad for the same amount of domestic currency.
For example, if the rupee appreciates from ₹83 to ₹78 per dollar, a $10,000 machine from the U.S. costs ₹7.8 lakh instead of ₹8.3 lakh.
The benefits include:
Reduced Import Costs: Lower costs for raw materials, equipment, or finished goods.
Lower Inflation: Cheaper imports can reduce overall price pressures in the domestic economy.
Improved Margins: Importers or retailers can either lower their selling prices or increase profit margins.
Industries such as electronics, oil, and automobiles — which rely heavily on imports — often welcome currency appreciation.
2. Currency Depreciation: Costly Imports
Depreciation has the opposite effect. The domestic currency buys fewer foreign goods, increasing import costs.
For example, if the rupee depreciates from ₹83 to ₹88 per dollar, that same $10,000 machine now costs ₹8.8 lakh.
This can lead to:
Higher Input Costs: Import-dependent manufacturers face rising costs of raw materials or components.
Inflationary Pressure: Costlier imports can push up consumer prices, especially for fuel or food.
Profit Margin Squeeze: Importers may struggle to pass higher costs to consumers, hurting profitability.
A prolonged depreciation phase can thus make it difficult for import-driven sectors like energy, technology, and healthcare to maintain stable pricing structures.
Exchange Rate Pass-Through: Linking Valuation to Pricing
The concept of exchange rate pass-through (ERPT) explains how much of the currency movement is reflected in the final price of goods.
Full Pass-Through: Exporters/importers adjust prices completely in line with exchange rate changes.
Partial Pass-Through: Companies absorb part of the exchange rate impact to remain competitive.
For example, if the rupee weakens 10% but an exporter only raises prices abroad by 5%, the remaining 5% is absorbed in margins.
The degree of pass-through depends on market conditions, demand elasticity, and brand power. Highly competitive markets (like garments) show low pass-through, while niche products or monopolistic services show higher pass-through.
Case Examples
1. Indian IT and Pharmaceutical Exporters
When the rupee depreciates, these sectors thrive because they earn in dollars but spend in rupees. During 2020–2023, rupee weakness benefited companies like Infosys, TCS, and Sun Pharma, improving operating margins despite global volatility.
2. Oil and Gold Importers
India imports most of its crude oil and gold. When the rupee weakens, import bills rise sharply, widening the current account deficit and creating inflationary pressure. This shows how currency valuation directly influences macroeconomic stability.
3. Japanese Yen and Export Competitiveness
Japan has long relied on a weak yen to maintain export competitiveness in automobiles and electronics. When the yen strengthens sharply, companies like Toyota or Sony face reduced foreign earnings, prompting shifts in production to other regions.
Macroeconomic Implications
1. Trade Balance Effects
Currency depreciation tends to boost exports and reduce imports, improving the trade balance. Conversely, appreciation may widen trade deficits.
However, the J-Curve effect suggests that after depreciation, the trade deficit may initially worsen (as import bills rise before export volumes adjust) before eventually improving.
2. Inflation and Interest Rates
A weaker currency can stoke inflation through higher import costs, prompting central banks to raise interest rates. A stronger currency can have a disinflationary effect, allowing for looser monetary policy.
Hence, exporters and importers must watch not just exchange rates but also central bank reactions.
3. Investment Flows
Stable currency values attract foreign investment, while volatile or overvalued currencies deter it. Export-oriented economies like China and South Korea often manage currency levels strategically to maintain competitiveness.
Risk Management and Hedging Strategies
Given the volatility in currency markets, exporters and importers use various tools to manage risk:
Forward Contracts: Lock in future exchange rates to avoid uncertainty.
Options and Futures: Provide flexibility to benefit from favorable moves while limiting losses.
Natural Hedging: Matching foreign currency revenues and expenses (e.g., using dollar earnings to pay dollar liabilities).
Diversification: Expanding trade across multiple markets to reduce dependency on one currency.
A disciplined hedging strategy protects profit margins and ensures financial stability despite volatile exchange rates.
Policy and Central Bank Interventions
Governments and central banks often intervene in foreign exchange markets to prevent excessive currency swings.
Managed Float Systems: Authorities allow market forces to determine exchange rates but step in during volatility.
Reserve Management: Buying or selling foreign reserves to influence currency supply.
Export Incentives and Import Duties: Used to balance the impact of currency movements on trade sectors.
For example, the Reserve Bank of India (RBI) actively manages rupee liquidity to avoid sharp fluctuations that could harm exporters or spike import costs.
The Balance Between Exporters and Importers
While a weaker currency aids exporters, it hurts importers and raises inflation. Conversely, a stronger currency benefits importers and consumers but reduces export competitiveness.
Thus, an optimal exchange rate — not too strong, not too weak — is crucial. The goal for policymakers is to maintain stability rather than favor one side.
In the long run, productivity, innovation, and diversification are more sustainable sources of competitiveness than currency manipulation.
Conclusion
Currency valuation stands at the crossroads of global trade, linking the fortunes of exporters, importers, investors, and entire economies. A fluctuating exchange rate is more than a number on a financial screen — it is a reflection of economic strength, investor confidence, and trade competitiveness.
For exporters, a weaker domestic currency can mean opportunity; for importers, it can mean challenge — and vice versa. But those who understand the mechanics of currency valuation, hedge their risks, and adapt strategically can turn volatility into advantage.
In a globalized era, exchange rate literacy is as essential as market knowledge. Whether you’re shipping goods overseas or sourcing materials from abroad, managing currency exposure is not merely financial prudence — it’s the foundation of resilient international business.

What Is CPI and Why It Matters GloballyIntroduction: The Pulse of the Global Economy
In the complex world of economics, few indicators hold as much influence and significance as the Consumer Price Index (CPI). Whether it’s a policymaker setting interest rates, an investor predicting market movements, or an ordinary consumer noticing rising grocery bills, CPI plays a role in everyone’s financial life. It acts as a mirror reflecting changes in the cost of living and inflation, shaping everything from global monetary policies to household budgets.
Simply put, CPI measures how much prices have increased or decreased for a basket of goods and services that consumers typically buy. However, behind this simple concept lies a powerful tool that helps nations assess economic stability, business competitiveness, and the real purchasing power of their citizens.
Understanding CPI: The Basics
The Consumer Price Index (CPI) is an economic indicator that measures the average change in prices of a fixed basket of goods and services over time. This basket includes everyday items such as food, housing, clothing, healthcare, transportation, and education — essentially capturing the spending habits of urban consumers.
CPI as a Measure of Inflation
CPI is the most widely used tool to measure inflation — the general increase in prices and fall in the purchasing power of money.
When CPI rises steadily, it indicates inflation; when it falls, it suggests deflation.
Inflation can be both a sign of growth and a warning signal. Moderate inflation encourages spending and investment, as people prefer to buy now rather than later. But excessive inflation — as seen in countries like Argentina or Turkey in recent years — erodes savings, raises borrowing costs, and destabilizes economies.
Conversely, deflation (a sustained drop in prices) might sound appealing but can trigger economic stagnation. Falling prices reduce business revenues and wages, discouraging spending and investment.
Thus, tracking CPI helps governments strike a delicate balance between economic growth and price stability.
Types of CPI
Economists often use different versions of CPI to capture varied aspects of price changes:
Headline CPI:
This is the broadest measure, including all goods and services in the consumer basket. It reflects the overall inflation rate but can be volatile due to changes in food and energy prices.
Core CPI:
Excludes food and energy components, as they are prone to short-term fluctuations. Core CPI gives a clearer picture of long-term inflation trends.
CPI-W and CPI-U (in the U.S.):
CPI-W tracks the spending habits of urban wage earners and clerical workers.
CPI-U includes all urban consumers and is considered the official measure of inflation.
HICP (Harmonized Index of Consumer Prices):
Used by the European Union, this version allows for consistent inflation comparisons across member states.
Each variation of CPI serves a specific policy or analytical purpose, allowing economists to monitor inflation more accurately across different sectors and regions.
CPI and Global Monetary Policy
CPI plays a central role in shaping global monetary policy.
Central banks like the Federal Reserve (U.S.), European Central Bank (ECB), Bank of England, and the Reserve Bank of India (RBI) rely on CPI trends to make key decisions about interest rates and money supply.
When CPI shows rising inflation, central banks often raise interest rates to cool down spending and borrowing.
When CPI indicates deflation or weak inflation, they lower rates to stimulate economic activity.
For instance, during the COVID-19 pandemic, global CPI levels dropped as demand collapsed. Central banks responded with historically low interest rates and massive stimulus packages.
However, post-pandemic supply chain disruptions and energy shortages sent CPI soaring globally — prompting rapid interest rate hikes in 2022–2023.
These fluctuations show how closely CPI data influences global financial stability, currency values, and investment decisions.
CPI and Purchasing Power
CPI also helps determine changes in purchasing power — how much goods and services a unit of currency can buy.
If wages rise slower than CPI, real income effectively decreases, meaning consumers can buy less with the same money.
For example:
If CPI rises by 6%, but wages increase by only 3%, then real wages have fallen by 3%.
This erosion in purchasing power can reduce consumer confidence and spending — key drivers of economic growth.
Governments and labor unions often use CPI data to adjust wages, pensions, and social benefits (a process called indexation) to maintain people’s living standards.
CPI as a Global Benchmark
CPI data is not just a domestic concern — it has international ramifications.
Global investors, financial institutions, and multinational corporations all monitor CPI across different countries to assess economic health and currency risks.
Here’s how:
Exchange Rates:
High inflation (rising CPI) typically weakens a nation’s currency because it erodes purchasing power. Investors may move money to countries with lower inflation and higher returns, affecting foreign exchange markets.
Investment Flows:
CPI trends help guide foreign direct investment (FDI) and portfolio investment decisions. For instance, a stable CPI and moderate inflation attract investors seeking predictable returns.
Trade Competitiveness:
Countries with lower inflation maintain price stability in exports, making their goods more competitive globally. Conversely, high CPI growth can make exports expensive and hurt trade balances.
Thus, CPI serves as a universal barometer for comparing economic conditions across nations.
CPI and the Financial Markets
The stock market, bond market, and commodity markets react strongly to CPI reports.
Traders and investors treat CPI announcements as key economic events because they directly influence interest rate expectations and corporate profitability.
Equity Markets:
Rising CPI may hurt company profits by increasing input costs. However, certain sectors — like energy, commodities, and consumer staples — often benefit during inflationary periods.
Bond Markets:
Bonds are highly sensitive to inflation. When CPI rises, bond yields increase because investors demand higher returns to offset the loss of purchasing power. This inversely affects bond prices.
Commodity Markets:
Commodities such as gold and crude oil often act as inflation hedges. A high CPI can push investors toward tangible assets that retain value when currencies lose purchasing power.
Thus, CPI data can trigger short-term volatility and long-term investment strategy shifts across asset classes.
Limitations of CPI
While CPI is an essential tool, it’s not without flaws. Economists often debate its accuracy and representativeness due to several factors:
Substitution Bias:
Consumers tend to switch to cheaper alternatives when prices rise, but CPI assumes a fixed basket — overstating inflation.
Quality Adjustments:
Technological improvements often increase product quality (e.g., smartphones), but CPI may not fully capture this added value.
Geographical Variations:
Price changes differ between regions. Urban CPI may not accurately reflect rural cost-of-living changes.
Lagging Indicator:
CPI measures inflation after it has occurred, meaning policymakers are often reacting to past data.
Exclusion of Certain Costs:
CPI may exclude investment assets like real estate or stocks, even though they significantly affect household wealth.
Despite these limitations, CPI remains the most reliable and widely accepted inflation measure because of its consistency and comparability.
Case Studies: CPI in Action
1. United States: Inflation and Federal Reserve Policy
In 2022, U.S. CPI surged above 9%, the highest in four decades. Rising food, fuel, and housing costs prompted the Federal Reserve to raise interest rates aggressively throughout 2022–2023. This decision cooled inflation but also slowed economic growth and rattled stock markets.
It showcased how CPI data can reshape monetary strategy and ripple through global markets.
2. India: Balancing Growth and Inflation
India’s CPI basket is heavily weighted toward food and housing. When food prices rise due to poor monsoon or supply shortages, CPI spikes quickly.
The RBI uses CPI as its main inflation target, aiming to keep it between 2–6%. By adjusting repo rates based on CPI trends, the RBI manages both growth and price stability.
3. Eurozone: The Battle with Deflation and Energy Prices
For years, the Eurozone struggled with low inflation and deflation risks, prompting the ECB to maintain ultra-low interest rates. However, after the Ukraine conflict in 2022, energy-driven CPI spikes forced the ECB to tighten policy sharply.
This swing illustrated CPI’s impact on regional economic integration and fiscal coordination.
CPI in the Context of Global Challenges
Today’s world faces unprecedented inflationary pressures due to factors like:
Geopolitical conflicts (e.g., Russia–Ukraine)
Supply chain disruptions
Energy market volatility
Climate change impacting agriculture
Post-pandemic demand surges
As a result, global CPI data has become a critical early warning system for potential recessions, stagflation, or monetary tightening cycles.
International institutions such as the IMF and World Bank rely on CPI trends to forecast global growth and recommend policy adjustments.
Future of CPI: Adapting to a Changing Economy
As consumption habits evolve, CPI calculations must also adapt. The rise of digital goods, subscription services, and AI-driven economies is reshaping how statisticians define the “consumer basket.”
Future CPI methodologies may include:
Real-time price tracking using big data and AI
Regional CPI dashboards for urban and rural contrasts
Inclusion of environmental costs and green inflation (the impact of climate policies on prices)
Better adjustments for technological improvements
Such innovations will make CPI a more accurate, dynamic, and inclusive measure of global inflation.
Conclusion: The Global Significance of CPI
The Consumer Price Index is more than just a number; it is the heartbeat of the world economy. It influences how central banks set interest rates, how investors allocate capital, how governments plan budgets, and how families manage their daily expenses.
Understanding CPI is crucial not only for economists but for anyone navigating an interconnected global economy. Whether inflation is surging or stabilizing, CPI tells the story of how value, consumption, and confidence move together in shaping our economic future.
In a world of shifting trade patterns, volatile energy markets, and evolving digital economies, CPI remains the compass that helps policymakers, businesses, and citizens alike find direction amid economic uncertainty.

Origins of Modern Trade Wars in the World MarketIntroduction
The term trade war refers to an economic conflict between nations characterized by the imposition of tariffs or other trade barriers against each other. In essence, it is a battle for economic dominance fought through policy, not arms. While trade wars have existed since the rise of mercantilism in the 16th century, the modern trade war is a more complex phenomenon, deeply rooted in globalization, technological advancement, and national security concerns.
In today’s interconnected world, trade wars affect not just the warring nations but also global supply chains, financial markets, and consumer prices. The origins of modern trade wars can be traced to a combination of historical protectionism, geopolitical rivalry, and the changing structure of the global economy. This essay explores the evolution of trade wars, their causes, major examples, and the underlying forces shaping them in the 21st century.
Historical Background: From Protectionism to Globalization
Trade conflicts have long been tools of economic strategy. In the early centuries of global commerce, nations viewed trade surpluses as a measure of power. The 17th and 18th centuries saw the rise of mercantilism, where colonial powers such as Britain, France, and Spain imposed trade barriers to protect their domestic industries and accumulate wealth.
In the 19th century, industrial revolutions and colonial expansion spread free trade ideas, most notably through the British-led global trade system. However, the Great Depression of the 1930s reversed this progress. The U.S. Smoot-Hawley Tariff Act (1930), which raised tariffs on thousands of goods, triggered a global retaliatory cycle, deepening the depression.
After World War II, world leaders sought to prevent such destructive economic nationalism. They created institutions like the General Agreement on Tariffs and Trade (GATT) in 1947, which later evolved into the World Trade Organization (WTO) in 1995. These institutions aimed to promote global trade liberalization, reducing tariffs and establishing dispute resolution mechanisms.
Yet, even as globalization accelerated, protectionist instincts never disappeared. By the early 21st century, trade wars had transformed from simple tariff conflicts into strategic economic weapons, targeting technology, security, and intellectual property.
The Rise of the Modern Trade War
Modern trade wars differ from historical ones in both scale and motivation. They are not merely about tariffs or market access — they reflect deeper struggles over technological supremacy, economic sovereignty, and geopolitical power.
The post-Cold War world initially saw unprecedented economic cooperation. The 1990s and early 2000s were marked by open markets, rapid global trade growth, and the rise of multinational corporations. Countries like China and India emerged as manufacturing powerhouses, while the U.S. and Europe focused on innovation and services.
However, the same globalization that integrated economies also created vulnerabilities. Wealth inequality widened, industrial jobs in developed economies disappeared, and dependency on foreign supply chains increased. These developments laid the groundwork for nationalist economic movements and the resurgence of trade conflicts.
Key Triggers of Modern Trade Wars
1. Globalization’s Backlash
Globalization, once hailed as a force for prosperity, became politically controversial. Many Western workers felt displaced by cheaper imports and outsourcing. Factories in the U.S. and Europe shut down as companies moved production to low-cost countries like China and Vietnam. This economic discontent fueled protectionist policies, with leaders promising to “bring back jobs” and “protect national industries.”
2. The U.S.–China Rivalry
No relationship defines the modern trade war era more than the rivalry between the United States and China. For decades, the U.S. supported China’s integration into the world economy, hoping economic liberalization would lead to political openness. However, as China’s technological and military strength grew, Washington began viewing Beijing as a strategic competitor.
In 2018, under President Donald Trump, the U.S. imposed tariffs on over $360 billion worth of Chinese goods, accusing China of unfair trade practices, currency manipulation, and intellectual property theft. China retaliated with tariffs on American products like soybeans, automobiles, and chemicals. The conflict disrupted global supply chains and forced multinational companies to rethink their dependence on China.
The U.S.–China trade war marked a turning point: trade policy was now a tool of geopolitical containment rather than mere economic correction.
3. Technology and National Security
Another defining feature of modern trade wars is the fusion of technology with national security concerns. Nations increasingly view technology — particularly in areas like semiconductors, 5G, and artificial intelligence — as strategic assets.
For instance, the U.S. imposed sanctions on Huawei, China’s leading telecom firm, citing espionage risks. It also restricted semiconductor exports to China, aiming to curb its access to advanced chips. In response, China accelerated its “Made in China 2025” policy, seeking self-sufficiency in high-tech sectors.
This represents a shift from tariffs to tech-based trade restrictions, signaling that modern trade wars are as much about digital dominance as about trade balances.
4. Supply Chain Security and Reshoring
The COVID-19 pandemic and subsequent global disruptions exposed how dependent nations had become on foreign suppliers. Shortages of essential goods, from medical equipment to microchips, triggered a wave of economic nationalism. Countries began promoting reshoring (bringing production home) and friend-shoring (trading with allies instead of rivals).
This policy direction — seen in the U.S. CHIPS Act and India’s Production-Linked Incentive (PLI) schemes — reflects the idea that economic independence is a form of security, even if it reduces efficiency.
5. Energy and Resource Control
Energy politics also play a major role in modern trade wars. The Russia–Ukraine conflict (2022) led to Western sanctions against Moscow, which retaliated by cutting energy supplies to Europe. This sparked global price surges in oil, gas, and food commodities, proving that trade and geopolitics are inseparable.
Resource nationalism — countries restricting exports of vital minerals like lithium, rare earths, or fertilizers — has become another front in trade conflicts, particularly as nations race to secure green energy resources.
Major Examples of Modern Trade Wars
1. U.S.–China Trade War (2018–Present)
This remains the most significant trade conflict of the 21st century. It began with tariffs but expanded into technology bans, export controls, and investment restrictions. While both nations signed a Phase One Trade Agreement in 2020, tensions persist, especially in technology and defense sectors. The conflict has reshaped global trade flows, encouraging companies to diversify production to countries like Vietnam, India, and Mexico.
2. U.S.–European Union Disputes
Though allies, the U.S. and EU have engaged in repeated trade disputes — from Boeing vs. Airbus subsidies to digital taxes on U.S. tech giants like Google and Apple. Tariffs on steel, aluminum, and agricultural goods have also flared intermittently, reflecting underlying competition for global industrial leadership.
3. Japan–South Korea Trade Restrictions (2019)
In Asia, Japan and South Korea clashed when Japan restricted exports of key materials used in semiconductors, citing national security. The dispute was partly rooted in historical grievances but had serious consequences for tech industries worldwide.
4. Russia and Western Sanctions
Following the annexation of Crimea in 2014 and the 2022 invasion of Ukraine, Western countries imposed unprecedented economic sanctions on Russia. Moscow retaliated by banning exports and redirecting trade to Asia. This confrontation effectively created a bifurcated global trading system, dividing economies along political lines.
Economic and Market Impacts
Modern trade wars have profound consequences for the world economy:
Rising Costs and Inflation:
Tariffs increase the cost of imported goods, leading to inflation. Consumers ultimately bear the burden through higher prices.
Disrupted Supply Chains:
Global manufacturing relies on integrated networks. Trade barriers force companies to relocate or diversify production, often at higher costs.
Market Volatility:
Stock markets react sharply to trade tensions. For example, during the 2018–2019 U.S.–China dispute, global equities saw major sell-offs amid uncertainty.
Shifting Investment Patterns:
Countries like India, Vietnam, and Mexico have gained foreign investment as companies seek alternatives to China, illustrating the realignment of global supply chains.
Reduced Global Growth:
The International Monetary Fund (IMF) estimates that prolonged trade wars could shave off 0.5–1% of global GDP, dampening investment and productivity.
Geopolitical Dimensions
Trade wars are increasingly intertwined with geopolitical rivalries. Economic measures have replaced traditional warfare as a tool of statecraft. Sanctions, export bans, and tariffs are now used to coerce adversaries or reward allies.
For example, the U.S. uses trade policy to contain China, while China leverages its dominance in rare earth minerals to influence global industries. Similarly, Europe’s green transition policies also carry a strategic dimension — reducing dependence on Russian energy and Chinese solar components.
The emergence of trade blocs like BRICS, ASEAN, and the Indo-Pacific Economic Framework reflects nations’ attempts to secure regional economic influence in a multipolar world.
The Role of the WTO and Global Governance
The World Trade Organization (WTO), once the central arbiter of global trade disputes, has struggled to keep pace with modern challenges. Its mechanisms are slow, and its rules were designed for a different era — one dominated by goods, not digital or technology trade.
The paralysis of the WTO’s Appellate Body since 2019 has allowed nations to act unilaterally, bypassing multilateral dispute resolution. This vacuum has emboldened major economies to engage in aggressive trade policies without fear of meaningful retaliation through international law.
The Future of Global Trade Relations
Looking ahead, trade wars are unlikely to disappear — they are evolving. The new era of “geo-economic competition” will revolve around:
Technology control: Chip manufacturing, AI, and green tech will be the new battlegrounds.
Economic security: Nations will prioritize resilience over efficiency.
Regional trade networks: Supply chains will become more localized and politically aligned.
Digital trade rules: The next frontier of regulation will involve data sovereignty and cyber-exports.
While globalization will not end, it is shifting toward fragmented globalization, where countries trade selectively based on security and political alignment.
Conclusion
The origins of modern trade wars lie in a complex interplay of history, politics, and economics. What began as a quest to protect domestic industries has evolved into a multidimensional struggle for technological dominance, national security, and geopolitical power.
In today’s world, trade wars are not just about tariffs or deficits — they are about who controls the future of global innovation, energy, and information. The challenge for policymakers is to balance national interests with global stability, ensuring that competition does not destroy cooperation.
Ultimately, while trade wars may bring short-term political victories, history shows that economic nationalism rarely produces lasting prosperity. True progress will depend on rebuilding trust, reforming global trade institutions, and recognizing that in a deeply interconnected world, economic conflict anywhere can trigger consequences everywhere.

How to enter a successful futures tradeDrop everything and let me show you how to enter a successful long position with the lowest possible risk.
You need to understand that the market maker usually acts against us at major support areas on the chart — like the 100 EMA, 0.618 Fibonacci level, or a trendline.
To make this clearer, let’s take TAO as an example and I’ll explain why.
TAO has strong momentum and a large market cap,
so don’t apply what I’m about to say to meme coins, for example.
Now let’s go step by step on how to enter a futures position after choosing the coin 👇
1. First, wait for a bullish pattern to form — like a triangle — and for the coin to break it upwards with increasing long momentum.
2. The price will then retest the trendline, encouraging people to enter with larger positions, and those who missed the first breakout will likely place buy orders at the retest zone.
3. Then, the market surprises them — it drops back inside the triangle, giving a small bounce at the lower side.
4. But it doesn’t stop there — it continues dropping, breaking below the triangle and closing below the 100 EMA on the 4-hour chart.
This makes you panic and close your long position.
Others start entering shorts thinking it’s a real breakdown.
5. That’s when the market reverses sharply upward,
trapping short traders in losses,
while long traders who exited too early also lose.
In the end, only those who placed buy orders slightly below the strong support level (not directly on it, like under the 100 EMA) — and of course the market maker — end up winning.
So basically, the long traders lose, the short traders lose,
and only a small percentage of smart traders and the market maker win.
Small things to pay attention to 👇
-Your entry point should be slightly below the support, not too far below it.
(That support could be the 100 EMA, below the triangle pattern, or the 0.618 Fibonacci level, as we mentioned.)
-Don’t use high leverage — x5 should be your maximum.
-Place your stop loss 5% below your entry zone,
which equals about 25% loss if you’re using x5 leverage.
And with that, you’ve got yourself a long setup with over a 90% success rate,
and you can apply the same logic in reverse when taking a short position.
Best Regards:
Ceciliones🎯
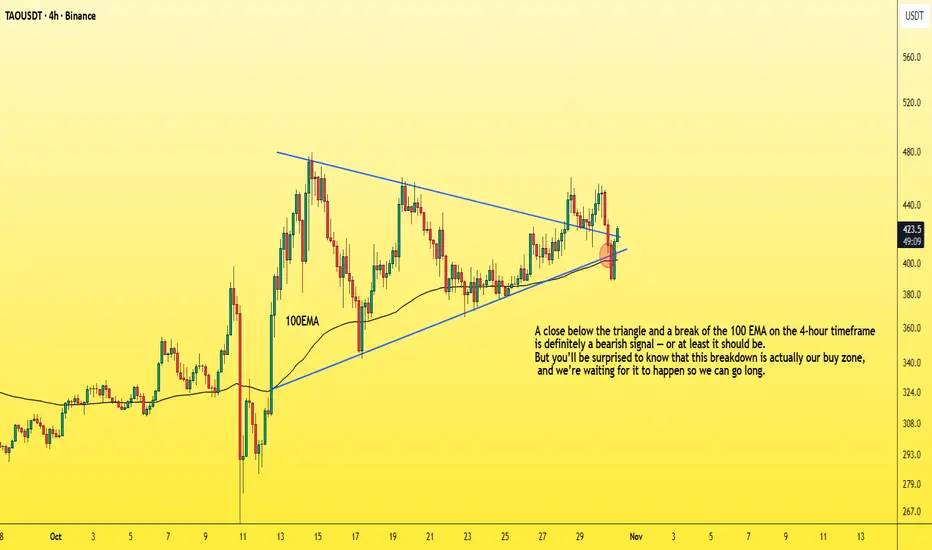
A Lesson in Patience and structure - ORB waited till 2pm todayFellow traders,
Today tested patience more than precision.
The morning was a maze — choppy price action, overlapping candles, and zero conviction. The ORB range between 9:30–9:45 never gave clean confirmation. Buyers held the low, sellers pressed the top, but neither could gain control. Every candle said, “not yet.”
Then came midday compression. From 11 AM to 1:30 PM, QQQ coiled tightly under the EMAs and VWAP. That silence wasn’t random — it was the market loading energy. The moment VWAP was lost for good, the floodgates opened.
Finally, around 2 PM, the breakdown came: a clean retest rejection of the ORB box and an accelerated drop through 629. The move I had been watching all day finally unfolded — only this time, discipline said don’t chase.
And that’s the point of today’s session.
Not every move is yours to catch. Sometimes your biggest win is not forcing a trade that forms too late or breaks your system’s timing window.
Patience is part of the strategy.
The setup played out exactly as it should — I just didn’t have to be in it to learn from it.
Stay disciplined. Stay sharp.
— Trades with B ⚡
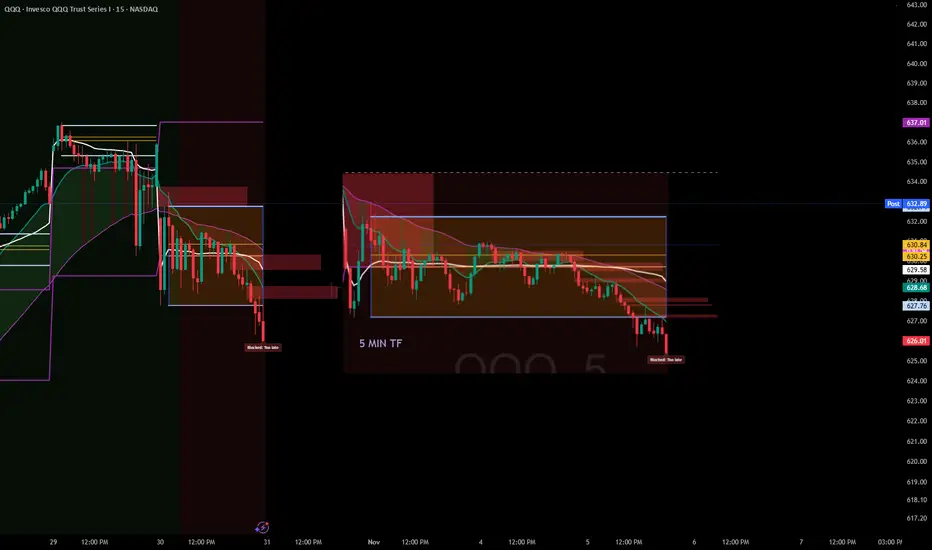
Trading Bots: The Future of the Markets?Let’s be real, the idea of a trading bot sounds like the holy grail.
Set it up, go to bed, and wake up to profit.
If only it were that simple.
Most bots don’t fail because of bad code, they fail because of bad logic.
A bot is only as good as the rules you give it.
What a Trading Bot Actually Does
A bot doesn’t predict the market, it reacts to it.
It follows a defined strategy:
Buy when X happens, sell when Y is confirmed, cut losses if price breaks Z.
That’s all.
No fear. No greed. No “maybe I’ll wait for one more candle.”
The power of bots isn’t in magic,it’s in consistency.
They do what most traders can’t: follow the plan exactly as written, every single time.
Why Most Bots Fail
The truth?
Most traders plug in random bots they find online without understanding what’s inside.
They win a few trades, feel invincible… and then lose it all when volatility spikes.
The reason isn’t the bot, it’s the lack of testing and understanding.
If you don’t know your system’s weak spots, you’ll eventually find them the hard way.
That’s why backtesting matters.
Backtesting: Your First Line of Defense
Backtesting shows how your logic performs over hundreds of trades — across bull, bear, and sideways markets.
It reveals your system’s strengths, weaknesses, and drawdowns before you risk a dollar.
A good backtest should tell you:
Your average win rate and risk/reward ratio.
How your system handles volatility.
How often it hits consecutive losses.
Whether your edge actually holds over time.
If your bot looks good in backtests and performs similarly in live conditions — you’re onto something real.
*Example of one of our indicator
How Bots Can Enhance Your Trading
You don’t have to hand everything over to automation.
In fact, many great traders use bots to handle the mechanical side, while keeping the decision-making human.
Here are a few examples:
Trade Execution: Let the bot enter trades instantly after your setup triggers.
Risk Management: Bots can move stop-losses, take partial profits, or scale positions automatically.
Signal Filtering: Use automation to scan hundreds of pairs and alert you only when conditions align.
Backtesting Sandbox: Test new ideas safely with data before deploying them live.
Bots don’t replace traders, they multiply efficiency.
They free your mind from execution so you can focus on refinement.
The Real Lesson
A trading bot isn’t a shortcut.
It’s a mirror, it reflects your discipline, your rules, and your logic.
If your plan is solid, a bot will make it unstoppable.
If your plan is weak, it’ll just lose money faster.
Automation doesn’t fix bad habits, it exposes them.
So learn the logic, test it hard, then let the system do what humans struggle with most: follow the plan.

Lessons Learned from Past Meltdowns (2008, 2020, etc.)1. The 2008 Financial Crisis: A Wake-Up Call for Systemic Risk
The 2008 Global Financial Crisis (GFC) was triggered by the collapse of the U.S. housing bubble, excessive leverage in financial institutions, and the widespread use of complex derivatives such as mortgage-backed securities (MBS) and collateralized debt obligations (CDOs). When Lehman Brothers filed for bankruptcy in September 2008, panic spread globally. The crisis led to trillions in lost wealth, millions of job losses, and the deepest recession since the Great Depression.
Key Lessons from 2008:
a. Importance of Transparency and Regulation:
The 2008 crisis revealed how opaque financial products and inadequate oversight can destabilize the entire financial ecosystem. Banks took excessive risks without sufficient capital buffers, while rating agencies failed to assess true risk levels. Post-crisis reforms, such as Basel III norms, Dodd-Frank Act, and stress testing frameworks, were introduced to improve capital adequacy, liquidity, and accountability.
b. Systemic Risk Can Spread Rapidly:
The interconnection of global banks turned what began as a housing market issue into a worldwide meltdown. The concept of “too big to fail” became central to financial discourse. The lesson: monitoring systemic risk is as important as regulating individual institutions. Financial contagion can cross borders instantly, necessitating global cooperation among central banks and regulators.
c. Moral Hazard and Bailouts:
Massive government bailouts (e.g., TARP in the U.S.) saved the system but raised questions about moral hazard—whether saving reckless institutions encourages future risk-taking. The lesson was clear: regulation should prevent risk-taking before it requires taxpayer-funded rescues.
d. The Role of Monetary Policy:
Central banks realized their power and limitations. The U.S. Federal Reserve’s near-zero interest rate policy and quantitative easing (QE) became critical tools to stabilize markets. However, these also laid the groundwork for future inflationary pressures and asset bubbles. Lesson: monetary easing is effective but must be balanced with fiscal prudence and structural reforms.
e. Behavioral Economics Matters:
Investor psychology—greed during booms and fear during crashes—played a decisive role. Overconfidence, herd behavior, and the illusion of endless housing price appreciation fueled the bubble. Behavioral finance emerged as a crucial field for understanding and mitigating irrational market behavior.
2. The 2020 Pandemic Crash: A Crisis Like No Other
Unlike 2008, which was a financial crisis rooted in excess and mismanagement, the 2020 crash was a health crisis turned economic catastrophe. When COVID-19 spread globally in early 2020, lockdowns halted production, trade, and travel, triggering a sudden and sharp global recession. Stock markets collapsed, oil prices turned negative, and unemployment soared. Yet, recovery was surprisingly swift—thanks to unprecedented fiscal and monetary interventions.
Key Lessons from 2020:
a. Speed and Scale of Policy Response Matter:
Governments and central banks acted far faster in 2020 than in 2008. The U.S. Federal Reserve slashed rates to zero within weeks and launched unlimited QE, while fiscal packages like the CARES Act pumped trillions into the economy. Similarly, India announced the Atmanirbhar Bharat stimulus. The lesson: speed and magnitude of support can prevent temporary shocks from becoming long-term depressions.
b. Technology as an Economic Lifeline:
The digital economy emerged as a savior. Remote work, e-commerce, fintech, and cloud computing allowed many sectors to survive and even thrive. The pandemic accelerated the digital transformation of business and finance, leading to greater adoption of digital payments, virtual collaboration, and online education. Lesson: digital infrastructure is not optional—it is a core pillar of economic resilience.
c. The Fragility of Global Supply Chains:
The shutdown of manufacturing hubs in China and other countries exposed how deeply global supply chains were interconnected and vulnerable. The shortage of semiconductors, medical supplies, and essential goods highlighted the risk of over-dependence on a few suppliers. Lesson: economies must build supply chain diversification and strategic self-reliance.
d. Inequality and Social Resilience:
The pandemic widened existing inequalities. While asset prices recovered quickly, millions of small businesses and low-income workers faced lasting damage. Lesson: inclusive recovery must be prioritized; safety nets and targeted fiscal support are crucial for societal stability.
e. Investor Behavior and Market Resilience:
The 2020 crash also showcased how investor psychology had evolved. Retail investors, aided by trading apps and social media, became a dominant force. Markets rebounded sharply, partly due to liquidity and optimism about vaccines and technology. Lesson: information flow, sentiment, and social media can now move markets faster than ever.
3. Common Threads Between 2008 and 2020
Though different in origin, both crises shared key characteristics that reveal the vulnerabilities of modern capitalism.
a. Interconnected Global Systems:
Both crises demonstrated how local shocks quickly became global due to financial, trade, and psychological linkages. Whether it was mortgage-backed securities in 2008 or supply chain disruptions in 2020, the globalized economy magnifies contagion. The lesson: resilience depends on diversification—not isolation.
b. Central Bank Dominance:
In both crises, central banks played an unprecedented role. The Federal Reserve, European Central Bank, and others became the “market backstop.” Their actions stabilized confidence but also increased dependence on monetary intervention. This dependence raises long-term concerns about asset bubbles and debt sustainability.
c. The Importance of Communication and Trust:
Both meltdowns showed that trust is the ultimate currency in a crisis. When financial institutions, governments, or investors lose confidence, panic sets in faster than any policy can react. Transparent communication by policymakers can anchor expectations and prevent spirals of fear.
d. Innovation Follows Crisis:
Both periods triggered innovation. After 2008, fintech and blockchain rose from the ashes of mistrust in traditional banks. After 2020, remote work tech, digital health, and AI-driven analytics became mainstream. History proves: crises often accelerate technological and structural evolution.
4. Lessons for Policymakers
a. Build Buffer Capital and Fiscal Space:
Governments and banks must maintain sufficient reserves for emergencies. High fiscal deficits and excessive leverage before a crisis reduce the ability to respond later. Prudent fiscal management and healthy capital ratios are essential for resilience.
b. Develop Counter-Cyclical Tools:
Automatic stabilizers—such as unemployment benefits and targeted stimulus—can cushion economic shocks. Regulators must enforce counter-cyclical lending and investment practices to prevent overheating during booms.
c. Strengthen Global Coordination:
Global problems require global responses. The 2008 and 2020 crises both highlighted how coordination among G20 nations, IMF, and World Bank was vital. Shared frameworks for debt relief, liquidity swaps, and vaccine distribution illustrate the power of cooperation.
d. Invest in Data and Predictive Systems:
Early warning systems using AI and real-time data could help detect vulnerabilities before they escalate. Governments and financial regulators must embrace data-driven policy frameworks for crisis prevention.
5. Lessons for Financial Institutions
a. Risk Management Must Be Dynamic:
Traditional models failed to predict both crises. Stress testing must account for low-probability, high-impact events like pandemics or geopolitical disruptions. Banks must integrate climate risk, cyber risk, and behavioral risk into their frameworks.
b. Liquidity Is King:
Both meltdowns reinforced that liquidity dries up first in a panic. Institutions must maintain adequate short-term funding buffers. Central banks’ liquidity facilities are a lifeline, but dependence should be reduced through prudent planning.
c. ESG and Sustainable Finance:
The 2020 crisis emphasized environmental and social resilience. Firms with strong ESG principles fared better, reflecting investor preference for sustainability. Lesson: ethics and responsibility are now financial imperatives, not optional ideals.
6. Lessons for Investors
a. Stay Rational Amid Panic:
The biggest losses occur when investors react emotionally. Those who stayed invested or bought during the 2020 crash witnessed record recoveries. Lesson: time in the market often beats timing the market.
b. Diversification Works:
Diversified portfolios—across asset classes, sectors, and geographies—performed better in both crises. Lesson: never rely solely on one market or theme.
c. Long-Term Vision Pays Off:
Both crises produced winners—innovative companies that adapted early. Investors who focused on fundamentals and long-term growth stories reaped massive returns. Lesson: focus on quality, adaptability, and innovation.
7. Structural Shifts Triggered by Crises
a. Rise of Alternative Finance:
Post-2008, distrust in banks led to the growth of fintech, crypto assets, and decentralized finance (DeFi). These innovations democratized finance but also created new regulatory challenges.
b. Work and Consumption Redefined:
After 2020, remote work, digital payments, and online services became embedded in everyday life. Businesses now prioritize resilience over efficiency—shifting from “just-in-time” to “just-in-case” models.
c. Inflation and Monetary Reckoning:
Massive stimulus in 2020 eventually fueled inflationary pressures by 2022–23. This underscored that liquidity without productivity creates long-term imbalances. Lesson: monetary expansion must be matched with real economic output.
8. Preparing for the Next Crisis
While we can’t predict the next meltdown, we can prepare for it. Future shocks might stem from climate change, AI-driven job disruptions, or cyber warfare. The lessons from 2008 and 2020 teach us that flexibility, coordination, and foresight are the best defenses.
Anticipate the Unthinkable: Stress testing and scenario modeling must include black swan events.
Prioritize Human Capital: Education, healthcare, and social safety nets ensure societies rebound faster.
Embrace Sustainable Growth: Over-leverage and short-term gains always backfire.
Enhance Financial Literacy: Empowering individuals to understand risk and debt reduces systemic vulnerability.
Conclusion
The crises of 2008 and 2020 were vastly different in origin—one financial, the other biological—but they shared a common truth: economic systems are only as strong as the trust, transparency, and adaptability they embody. The lessons learned from these meltdowns go beyond economics—they speak to governance, ethics, and collective responsibility.
In both cases, the world witnessed immense pain but also extraordinary recovery and innovation. As we move deeper into an era of digital finance, geopolitical shifts, and environmental challenges, these lessons form the blueprint for building a resilient, equitable, and sustainable global economy—one that learns from its scars and grows stronger after every crisis.
Shifts in Global Trade Patterns and Supply ChainsIntroduction: The New Dynamics of Global Trade
The 21st century has witnessed an unprecedented transformation in global trade patterns and supply chains. From the post–World War II dominance of Western industrial economies to the rise of Asia as the global manufacturing hub, and now to an era shaped by digitalization, sustainability, and geopolitical realignment, trade is no longer just about goods crossing borders—it’s about interconnected systems, data flows, and strategic dependencies.
The COVID-19 pandemic, escalating trade wars, and regional conflicts like the Russia–Ukraine war have further reshaped the global trade map, compelling nations and corporations to rethink where and how they source, produce, and distribute goods. Today’s supply chains are not just economic instruments but also political, environmental, and technological battlegrounds.
This essay explores how global trade patterns and supply chains are shifting—highlighting the key forces driving these changes, the regions gaining and losing influence, and the implications for the future of global commerce.
1. Historical Context: From Globalization to Strategic Localization
In the decades following the 1990s, globalization reached its peak. Corporations sought efficiency through offshoring—relocating production to countries with cheaper labor and favorable trade policies. China, in particular, became the “world’s factory,” while emerging economies like Vietnam, Bangladesh, and Mexico grew as secondary manufacturing centers.
However, this model also created vulnerabilities. The overdependence on a few key suppliers and logistical routes meant that any disruption—whether a natural disaster, pandemic, or political tension—could paralyze entire industries. The 2008 global financial crisis and the 2020 pandemic both exposed these structural weaknesses, sparking a paradigm shift from efficiency-driven globalization to resilience-driven regionalization.
This historical backdrop set the stage for today’s reconfiguration of global trade and supply chains.
2. The Decline of Traditional Globalization
The forces of globalization—free trade, open markets, and integrated supply networks—are no longer the sole organizing principles of world commerce. Instead, nations are turning inward or aligning with regional blocs.
Key drivers of this shift include:
Trade Protectionism: The US–China trade war initiated in 2018 marked a turning point. Tariffs on hundreds of billions of dollars’ worth of goods disrupted established supply chains and forced firms to reconsider sourcing strategies.
National Security Concerns: Sensitive technologies, semiconductors, and critical minerals are now treated as strategic assets. Countries are restricting exports and promoting domestic production to avoid dependency.
Pandemic Disruptions: COVID-19 halted global logistics, revealed the fragility of “just-in-time” supply chains, and accelerated the adoption of “just-in-case” models emphasizing inventory buffers and regional diversification.
As a result, global trade growth has slowed. According to the World Trade Organization (WTO), the share of global trade in GDP has plateaued since 2015, signaling a structural slowdown in hyper-globalization.
3. Regionalization and the Rise of New Trade Hubs
A major trend reshaping global trade is the regionalization of supply chains. Instead of sourcing components from far-flung regions, companies are building shorter, more localized networks to reduce risk and improve resilience.
Key examples include:
Asia-Pacific Integration: While China remains central, production is increasingly distributed across ASEAN nations—Vietnam, Indonesia, Malaysia, and Thailand. This “China + 1” strategy helps reduce dependency on Chinese manufacturing while keeping access to its vast ecosystem.
North American Reshoring: Under the USMCA (United States–Mexico–Canada Agreement), companies are bringing manufacturing closer to home, especially in sectors like electronics, autos, and semiconductors. Mexico, benefiting from proximity to the US, has emerged as a major reshoring destination.
European Realignment: The EU is striving for “strategic autonomy” by strengthening internal supply networks, investing in renewable energy, and reducing reliance on Russian gas and Chinese raw materials. Eastern European nations like Poland, Hungary, and the Czech Republic are gaining traction as nearshoring hubs.
Regionalization doesn’t mean de-globalization—it represents a reconfiguration where trade flows become more concentrated within strategic clusters rather than globally dispersed.
4. The Digital Revolution and Smart Supply Chains
Technology is fundamentally transforming how global supply chains operate. Digital tools—ranging from artificial intelligence (AI) and blockchain to the Internet of Things (IoT) and advanced data analytics—are making supply chains smarter, more transparent, and adaptive.
Key technological impacts include:
AI-driven demand forecasting: Firms now predict market shifts with greater precision, reducing overproduction and wastage.
Blockchain for traceability: This ensures transparency across complex multi-tier supplier networks, particularly vital in industries like pharmaceuticals, food, and luxury goods.
Automation and robotics: Advanced robotics and 3D printing are reducing the cost differential between developed and developing countries, encouraging some industries to “reshore” production.
Digital trade platforms: Cloud-based trade management systems are facilitating faster customs clearance and cross-border documentation.
Digitalization thus acts as a “force multiplier,” enabling efficiency even within shorter, regional supply chains.
5. Geopolitical Tensions and Strategic Supply Chains
Geopolitics now plays a decisive role in shaping global trade patterns. The rivalry between major powers—particularly the US and China—has spilled into areas like technology, finance, and infrastructure.
Examples of this geopolitical fragmentation include:
The US–China Tech War: Restrictions on semiconductor exports, Huawei’s global ban, and supply chain decoupling efforts in critical tech sectors.
The Russia–Ukraine Conflict: Disruption in global energy and food supplies led Europe to accelerate diversification away from Russian dependence and invest in renewable alternatives.
Taiwan’s Semiconductor Dominance: Taiwan’s TSMC produces over 60% of the world’s advanced chips, making it a geopolitical flashpoint. Nations are now racing to build domestic semiconductor capabilities.
Governments worldwide are responding with industrial policies—such as the US CHIPS Act and the EU’s Green Deal Industrial Plan—to strengthen domestic supply resilience and reduce strategic vulnerabilities.
6. Sustainability and Green Supply Chains
Sustainability has become another key pillar shaping global trade. Corporations and countries are now judged not just by efficiency but by environmental and social responsibility.
Emerging sustainability trends include:
Carbon Border Adjustments: The EU’s Carbon Border Adjustment Mechanism (CBAM) will impose tariffs on carbon-intensive imports, encouraging cleaner production methods globally.
Circular Supply Chains: Companies are reusing materials, recycling components, and designing products for longevity—reducing dependency on raw material imports.
Renewable Energy Integration: Nations are aligning trade policies with green energy goals, influencing logistics routes and energy-intensive production locations.
This “green reindustrialization” is creating new opportunities for economies investing in clean manufacturing and renewable technologies, while penalizing those relying heavily on fossil fuels.
7. Emerging Markets: The New Centers of Trade Gravity
While developed economies are reshaping strategies for security and sustainability, emerging markets are becoming the new growth engines of global trade.
India: With its large labor force, pro-manufacturing policies (like “Make in India”), and digital infrastructure, India is positioning itself as a credible alternative to China for global manufacturers.
Vietnam and Indonesia: Both are attracting massive FDI inflows in electronics, apparel, and automotive sectors as part of the “China + 1” diversification strategy.
Africa: The African Continental Free Trade Area (AfCFTA) is creating a single market of over a billion people, opening new avenues for intra-African trade and global partnerships.
Latin America: Mexico and Brazil are emerging as nearshoring hubs for North America and Europe respectively.
These shifts mark a rebalancing of global economic power, where trade is less dominated by a single country or region and more evenly distributed across multiple growth centers.
8. The Logistics Revolution: Ports, Corridors, and Connectivity
Global trade depends not only on production but also on transport and logistics. Recent developments show a massive reorientation of global transport networks.
Alternative Shipping Routes: The Russia–Ukraine war and tensions in the Red Sea have redirected maritime traffic toward longer but safer routes, impacting global shipping costs.
India–Middle East–Europe Economic Corridor (IMEC): Announced in 2023, this new trade corridor aims to counterbalance China’s Belt and Road Initiative by linking India with Europe via the Middle East.
Automation in Ports: Smart ports and AI-based logistics management are reducing turnaround times and improving efficiency in global trade routes.
The next phase of trade will rely on infrastructure intelligence—where logistics are powered by data, automation, and alternative energy.
9. Supply Chain Resilience: From Just-in-Time to Just-in-Case
The traditional “just-in-time” model—minimizing inventory to cut costs—proved fragile under recent crises. Today, supply chain resilience has become a corporate priority.
Resilience strategies include:
Diversification of suppliers and locations to avoid overreliance on one country.
Inventory buffers for critical materials like semiconductors, lithium, and rare earths.
Multi-shoring and friend-shoring—favoring trade with politically aligned or nearby nations.
Scenario planning and stress testing to anticipate disruptions.
Resilience no longer means inefficiency—it is an investment in stability and strategic independence.
10. The Future of Global Trade: Multipolar, Digital, and Sustainable
The future of global trade will be multipolar, digital, and sustainability-driven. Power will no longer be concentrated in one global hub like China or the US, but spread across multiple regional clusters—each specializing in distinct industries.
Key trends for the next decade include:
Expansion of digital trade agreements (like the Digital Economy Partnership Agreement, DEPA).
Integration of AI and data analytics for predictive supply chain management.
Growth of sustainable trade finance linked to ESG (Environmental, Social, Governance) metrics.
The rise of cross-border e-commerce as small businesses join global trade through digital platforms.
In essence, globalization is not disappearing—it is evolving into a more complex, technology-enabled network of regional and digital ecosystems.
Conclusion: The Great Reconfiguration
The global trade system is undergoing its most profound transformation in decades. The twin forces of geopolitical realignment and technological innovation are redrawing the map of commerce. Efficiency is no longer the sole metric of success—resilience, sustainability, and strategic autonomy now define the new era of global trade.
Nations that adapt to these shifts—by investing in technology, building sustainable industries, and forging resilient partnerships—will lead the next chapter of globalization. Meanwhile, those clinging to old models of cost-driven offshoring may find themselves sidelined in an increasingly fragmented but interconnected world.
The global trade landscape of the 2030s will thus be characterized not by the dominance of any single power, but by the emergence of a networked, multipolar world—where innovation, adaptability, and trust define the flow of goods, data, and ideas.

Strategies for Investors in Emerging Markets1. Understanding Emerging Markets: The Opportunity and the Risk
Emerging markets are nations transitioning from low-income to middle-income status with improving infrastructure, industrial capacity, and governance. They typically exhibit higher GDP growth rates compared to developed economies but are also prone to fluctuations due to external shocks, commodity cycles, and policy uncertainty.
Opportunities:
High Growth Potential: Economic expansion driven by demographics, technology, and urbanization.
Rising Middle Class: Increasing disposable incomes create strong demand for goods, housing, and financial services.
Untapped Markets: Sectors like renewable energy, digital payments, healthcare, and logistics are still underpenetrated.
Diversification: Adding emerging markets exposure helps investors reduce overreliance on developed market cycles.
Risks:
Political Instability: Policy reversals and corruption can disrupt business environments.
Currency Volatility: Exchange rate fluctuations can erode returns for foreign investors.
Liquidity Risk: Many emerging market stocks and bonds are thinly traded.
Regulatory Uncertainty: Sudden capital controls or taxation changes may impact investments.
The challenge is balancing these opportunities and risks through intelligent portfolio design and disciplined execution.
2. Strategic Approach: Building an Investment Framework
Before diving into specific markets or sectors, investors must establish a framework that defines their objectives, time horizon, and risk tolerance.
A. Long-Term Orientation
Emerging markets tend to be volatile in the short term but rewarding over longer periods. A 7–10 year investment horizon allows investors to ride out short-term turbulence and benefit from structural growth trends like digitization, infrastructure expansion, and industrial modernization.
B. Top-Down vs. Bottom-Up Analysis
Top-Down Approach: Focuses on macroeconomic indicators like GDP growth, fiscal health, inflation, interest rates, and political stability to identify attractive countries or regions.
Bottom-Up Approach: Focuses on identifying fundamentally strong companies within those economies that are capable of delivering consistent earnings growth regardless of external volatility.
A blend of both approaches ensures that investors capture macroeconomic upside while remaining selective at the micro level.
3. Geographic Diversification: Don’t Bet on a Single Country
One of the core principles in emerging market investing is diversification. No two emerging markets move in the same direction at the same time. For example, India’s tech-led growth story differs from Brazil’s commodity-driven economy or Vietnam’s export manufacturing model.
Key Diversification Strategies:
Regional Balance: Spread exposure across Asia, Latin America, Eastern Europe, and Africa.
Economic Model Diversification: Combine consumer-driven economies (India, Indonesia) with export-driven ones (Vietnam, Mexico).
Political Diversity: Mix stable democracies with reform-driven autocracies to spread political risk.
Exchange-Traded Funds (ETFs) like iShares MSCI Emerging Markets ETF (EEM) or Vanguard FTSE Emerging Markets ETF (VWO) provide diversified exposure across multiple markets, reducing country-specific volatility.
4. Sectoral Allocation: Focus on Structural Growth Themes
Emerging markets often lead global trends in specific sectors. Identifying high-growth industries within these regions helps investors capture sustainable long-term returns.
Promising Sectors:
Technology & Digital Infrastructure: The explosion of fintech, e-commerce, and AI startups in India, Indonesia, and Latin America.
Renewable Energy: Transition toward solar, wind, and green hydrogen projects in India, Brazil, and South Africa.
Healthcare & Pharmaceuticals: Growing middle-class populations are demanding better healthcare access and quality.
Consumer Goods & Retail: Expanding domestic consumption supports strong demand for FMCG and retail companies.
Financial Services: Low financial penetration opens vast opportunities for banking, insurance, and digital finance firms.
Investors should look for sectors aligned with long-term development trends and domestic reforms rather than short-term cyclical plays.
5. Currency and Inflation Management
One of the most overlooked risks in emerging market investing is currency fluctuation. Even if local asset prices rise, depreciation in the local currency against the U.S. dollar can wipe out gains for foreign investors.
Strategies to Manage Currency Risk:
Hedged ETFs: Use instruments that neutralize foreign exchange exposure.
Dollar-Cost Averaging: Regular investments over time reduce the impact of exchange rate timing.
Local Currency Bonds: Some investors use local bonds to balance currency exposure since yields often compensate for risk.
Stable Country Selection: Prioritize countries with credible central banks and stable monetary policies (e.g., India or Chile).
Inflation, too, can erode real returns. Investing in inflation-resilient assets such as commodities, real estate, or dividend-paying equities helps offset purchasing power loss.
6. Active vs. Passive Investment Strategies
Passive Investing
Investors can use index funds or ETFs tracking emerging market indices for cost-effective diversification. These instruments provide broad exposure and reduce single-country or single-stock risk.
However, passive strategies may miss out on specific outperformers or structural changes in certain markets.
Active Investing
Active fund managers can exploit inefficiencies in emerging markets by selecting undervalued companies, timing entries, and managing risk dynamically.
Successful active investing requires local knowledge, deep research, and a long-term view.
Blended Approach
Many investors use a core-satellite strategy:
Core portfolio: Passive exposure to broad emerging markets.
Satellite portfolio: Active bets on select countries or sectors with strong upside potential.
This combination provides balance between stability and opportunity.
7. Incorporating ESG and Governance Factors
Environmental, Social, and Governance (ESG) considerations have become integral to investment decisions worldwide. In emerging markets, ESG risks—such as corruption, labor practices, or environmental degradation—can directly affect returns.
ESG Strategies:
Screening Out High-Risk Firms: Avoid companies with poor governance or environmental violations.
Engagement: Encourage companies to improve transparency and sustainability practices.
ESG-Focused Funds: Many global asset managers now offer emerging market ESG ETFs and funds.
ESG adoption is not only ethically sound but also improves long-term performance as well-governed companies often enjoy lower borrowing costs and better investor confidence.
8. Timing and Entry Strategy
Emerging markets are highly sensitive to global liquidity cycles. When interest rates in developed markets rise, capital often flows out of emerging economies, leading to currency depreciation and market corrections.
Timing Tips:
Avoid Herd Behavior: Don’t chase rallies driven by short-term sentiment.
Buy During Corrections: Use market pullbacks to accumulate high-quality stocks at attractive valuations.
Follow Global Monetary Trends: Emerging markets typically perform better when the U.S. dollar weakens and global liquidity expands.
Technical Indicators: Use support levels and moving averages to identify favorable entry points.
Investors who remain disciplined and patient tend to benefit from long-term uptrends following temporary volatility.
9. Using Local Expertise and Partnerships
Investing directly in foreign markets can be complex due to legal, taxation, and information asymmetry challenges.
Collaborating with local fund managers, research firms, or regional ETFs provides better access to data, understanding of cultural nuances, and insight into domestic market behavior.
For example:
Joint ventures with local asset managers can open doors to private equity opportunities.
Local advisory services help navigate regulations and currency repatriation rules.
10. Risk Management and Hedging Tools
Emerging market investors must prioritize capital preservation as much as growth. Key risk management measures include:
Position Sizing: Avoid concentrating too much in a single country or sector.
Stop-Loss and Rebalancing: Regularly review portfolios to lock in gains and cut losses.
Derivatives and Hedging Instruments: Use currency futures or options to mitigate exchange risk.
Fixed Income Allocation: Pair equity exposure with sovereign or corporate bonds for income stability.
Liquidity Buffer: Maintain cash reserves to take advantage of opportunities during volatility spikes.
Effective risk management separates disciplined investors from speculative traders.
11. Case Studies: India and Vietnam
India: The Digital and Consumption Story
India represents one of the strongest long-term emerging market stories, driven by digital transformation, manufacturing expansion under “Make in India,” and a rising young population.
Sectors like IT services, fintech, renewable energy, and capital goods have delivered consistent returns. The government’s focus on infrastructure and fiscal reforms adds structural strength.
Vietnam: The Manufacturing Powerhouse
Vietnam benefits from trade diversification, young labor force, and foreign investment inflows as companies relocate from China. Its export-oriented economy, stable governance, and strategic location make it a regional favorite. However, investors must watch for banking sector vulnerabilities and currency management challenges.
These examples highlight the importance of aligning investment strategy with each country’s unique growth narrative.
12. Long-Term Vision: Compounding in High-Growth Economies
Emerging markets reward investors who think in decades, not quarters. Compounding works best when capital remains invested during both upcycles and corrections. Reinvesting dividends, staying informed on macroeconomic trends, and maintaining a disciplined approach can create exponential growth over time.
Global investors like BlackRock, Fidelity, and Franklin Templeton have consistently emphasized that emerging markets are no longer speculative bets — they are essential components of global portfolios.
Conclusion: Balancing Risk and Reward in the New Global Order
The next wave of global economic growth will likely come from emerging markets. With technological innovation, demographic dividends, and economic reforms, these nations are shaping the new world order.
However, investing in them requires a careful balance between optimism and prudence.
Successful investors in emerging markets:
Diversify broadly.
Focus on long-term structural growth themes.
Actively manage currency and political risks.
Blend passive exposure with active conviction plays.
Stay disciplined during volatility.
Emerging markets are not for the faint-hearted, but for those with patience, research, and strategy — they offer some of the most rewarding opportunities in global investing today.
Blockchain’s Role in Different Trading Segments1. Introduction: Redefining Trust in the Trading World
The modern trading ecosystem — spanning financial markets, commodities, forex, and digital assets — relies heavily on trust, transparency, and speed. For decades, intermediaries such as brokers, clearing houses, and central depositories have played a vital role in ensuring smooth settlements and recordkeeping. However, this system is often plagued by inefficiencies, high transaction costs, and occasional lapses in security or accountability.
Enter blockchain technology — a decentralized ledger system that offers immutable, transparent, and secure recordkeeping. By eliminating the need for traditional intermediaries, blockchain has the potential to revolutionize how trades are executed, verified, and settled across different segments of the global financial market.
Blockchain’s role in trading is not confined to cryptocurrencies. Its applications now extend to stock markets, commodity exchanges, forex trading, derivatives, and even carbon credit and energy trading. Each of these sectors can benefit from blockchain’s ability to automate trust and reduce systemic inefficiencies.
2. Understanding Blockchain in the Context of Trading
At its core, blockchain is a distributed database shared among a network of participants. Once data — such as trade details or payment confirmations — is recorded on the blockchain, it cannot be altered without the consensus of the network. This ensures that all trading participants operate from a single, verified source of truth.
In trading terms:
Each transaction (buy or sell order) is a “block.”
These transactions are chained together chronologically.
The system is decentralized, meaning no single entity can manipulate data.
This architecture has far-reaching implications for global markets:
Instant settlements instead of multi-day clearing cycles.
Elimination of counterparty risk, as smart contracts execute automatically.
Lower transaction costs due to reduced intermediary dependence.
Enhanced auditability, since all data is time-stamped and verifiable.
3. Blockchain in Stock Market Trading
The traditional equity trading system involves multiple intermediaries — brokers, stock exchanges, clearing corporations, and custodians — all performing specific functions such as matching orders, confirming trades, and settling securities. While effective, this system is slow and costly.
How Blockchain Transforms Stock Trading
Real-Time Settlement: Blockchain can reduce the settlement period from the current T+2 (trade date plus two days) to near-instantaneous settlement (T+0). This significantly reduces liquidity risk and capital lock-in.
Tokenization of Assets: Shares can be represented as digital tokens on a blockchain. This enables fractional ownership, making high-value stocks accessible to smaller investors.
Decentralized Exchange Platforms: Decentralized stock trading platforms can facilitate peer-to-peer transactions without intermediaries, ensuring transparency and reducing costs.
Immutable Recordkeeping: Corporate actions such as dividends, bonus issues, and stock splits can be recorded permanently and automatically distributed using smart contracts.
Examples
Nasdaq Linq: One of the early adopters of blockchain, Nasdaq used the Linq platform to record private securities transactions, demonstrating efficiency and transparency.
India’s NSE pilot programs: The National Stock Exchange of India has experimented with blockchain for know-your-customer (KYC) data and settlement tracking.
4. Blockchain in Forex (Foreign Exchange) Trading
The foreign exchange market is the world’s largest financial market, with daily volumes exceeding $7 trillion. Yet, it remains fragmented, opaque, and reliant on central intermediaries like banks and payment processors.
Blockchain’s Advantages in Forex
Cross-Border Settlement: Blockchain enables direct peer-to-peer currency exchange without intermediaries, drastically cutting transfer times and fees.
Transparency and Auditability: All trades recorded on a blockchain are verifiable, reducing manipulation and fraud risks.
Smart Contracts for FX Swaps: Automated execution of forex swaps and forward contracts ensures minimal counterparty risk.
24/7 Accessibility: Unlike traditional systems, blockchain-based FX networks can operate continuously without downtime.
Example
RippleNet and Stellar Lumens use blockchain to enable instant cross-border currency transfers with minimal costs, challenging the dominance of SWIFT.
5. Blockchain in Commodity Trading
Commodity trading — involving oil, metals, and agricultural goods — often suffers from documentation delays, supply chain opacity, and settlement inefficiencies. Blockchain brings trust and traceability to this sector.
Applications
Smart Contracts for Trade Settlement: Automatically execute trades once contractual conditions are met (e.g., delivery confirmation triggers payment).
Supply Chain Transparency: Blockchain can trace commodities from extraction or production to final sale, ensuring authenticity and sustainability.
Tokenization of Commodities: Commodities like gold, crude oil, or carbon credits can be represented digitally, making them easier to trade and fractionalize.
Reduction in Paperwork: Blockchain eliminates the need for multiple physical documents like bills of lading, inspection certificates, and letters of credit.
Example
Vakt, a blockchain-based platform supported by BP and Shell, digitizes the post-trade processes in oil markets, improving efficiency and reducing fraud.
6. Blockchain in Derivatives and Futures Markets
Derivatives — including futures, options, and swaps — are complex instruments often involving multiple intermediaries. Blockchain’s smart contracts can automate these trades and settlements with precision.
Benefits
Instantaneous Settlement: Reduces the time gap between contract execution and settlement, minimizing counterparty and liquidity risks.
Automated Margin Calls: Smart contracts can automatically adjust margin requirements based on real-time price movements.
Transparency: Blockchain’s shared ledger ensures all participants view the same data, reducing disputes.
Regulatory Compliance: Blockchain enables real-time reporting to regulators, improving oversight.
Example
DTCC (Depository Trust & Clearing Corporation), which handles trillions in derivatives, has explored blockchain for trade reporting and settlement to enhance efficiency.
7. Blockchain in Cryptocurrency Trading
Cryptocurrency trading is the first and most obvious area where blockchain has already established dominance. Cryptos like Bitcoin and Ethereum are themselves blockchain-native assets, and their trading happens entirely on blockchain-based exchanges.
Innovations
Decentralized Exchanges (DEXs): Platforms like Uniswap and PancakeSwap allow traders to exchange tokens directly from their wallets without intermediaries.
Liquidity Pools: Smart contracts automatically match buyers and sellers, ensuring market liquidity.
Transparency and Security: Every trade is publicly recorded on the blockchain, ensuring full auditability.
Challenges
High volatility, lack of regulation, and scalability limitations still pose obstacles to mainstream adoption.
8. Blockchain in Energy and Carbon Credit Trading
The rise of sustainability-focused finance has introduced new markets like carbon credits and renewable energy certificates. Blockchain ensures authenticity and prevents double-counting in these emerging asset classes.
Applications
Tokenized Energy Certificates: Renewable energy output (solar, wind, hydro) can be tokenized and traded on blockchain platforms.
Carbon Credit Trading: Blockchain ensures each credit is unique, traceable, and not resold multiple times.
Peer-to-Peer Energy Trading: Consumers with solar panels can directly sell surplus energy to others through blockchain-enabled microgrids.
Example
Power Ledger (Australia) uses blockchain to enable P2P renewable energy trading, giving consumers control over energy distribution and pricing.
9. Blockchain in Real Estate and Asset Tokenization
Although not traditionally viewed as a “trading” sector, real estate is rapidly evolving into a digital trading marketplace through blockchain tokenization.
Benefits
Fractional Ownership: High-value properties can be divided into digital tokens, allowing small investors to participate.
Instant Liquidity: Instead of lengthy paperwork, property tokens can be traded instantly on secondary markets.
Transparency and Authenticity: Land titles and ownership histories recorded on blockchain reduce fraud.
Example
Platforms like RealT and Propy are pioneering blockchain-based real estate trading with tokenized assets.
10. Blockchain’s Role in Regulatory Compliance and Risk Management
Beyond execution and settlement, blockchain plays a crucial role in compliance, auditing, and risk management.
Regulatory Advantages
Real-Time Monitoring: Regulators can access immutable records of trades in real-time.
KYC/AML Integration: Blockchain-based identity systems simplify customer verification while maintaining data privacy.
Reduced Fraud and Errors: Tamper-proof records and automated reconciliations enhance overall market integrity.
Example
The European Securities and Markets Authority (ESMA) has studied blockchain-based trade reporting to enhance transparency across the EU markets.
11. Challenges and Limitations
Despite its immense potential, blockchain adoption in trading faces practical and regulatory hurdles:
Scalability Issues: Large exchanges process millions of transactions daily; most blockchains still struggle with high throughput.
Regulatory Uncertainty: Many governments have yet to create clear frameworks for blockchain-based trading systems.
Integration Complexity: Legacy financial infrastructure is deeply entrenched, making transition costly and time-consuming.
Privacy Concerns: While transparency is valuable, full data visibility may conflict with confidentiality requirements in institutional trading.
Energy Consumption: Proof-of-work systems like Bitcoin consume significant power, though newer consensus models (e.g., proof-of-stake) are more efficient.
12. The Future of Blockchain in Global Trading
As the technology matures, blockchain is expected to become the backbone of next-generation trading infrastructure. The future may see:
Fully tokenized stock exchanges, where equities, bonds, and derivatives exist as digital assets.
Interoperable blockchains, allowing seamless transfers between different networks and asset classes.
AI and blockchain integration, combining data-driven trading strategies with transparent execution.
Central Bank Digital Currencies (CBDCs) simplifying settlement between global financial institutions.
The convergence of blockchain, AI, and IoT will lead to hyper-efficient, transparent, and inclusive trading ecosystems — reshaping how capital, commodities, and data flow across borders.
13. Conclusion
Blockchain’s entry into the trading world represents a paradigm shift — from trust-based intermediaries to trustless digital verification. Whether in stock markets, forex, commodities, or emerging asset classes like carbon credits, blockchain introduces unmatched levels of transparency, efficiency, and inclusiveness.
While challenges persist, the direction is clear: blockchain is not just a supporting technology; it is the new foundation of global trading architecture. The world’s markets are moving steadily toward an era where every trade, every asset, and every participant is digitally connected in a decentralized, verifiable, and borderless network of trust.
Predicting Intraday CRASHES 10%+ w/ 5 Easy Steps1️⃣ Daily imbalance above has been rebalanced.
2️⃣ Price is rejecting from premium arrays (above equilibrium of the daily dealing range).
3️⃣ Intraday displacement (#4) aligns perfectly with that macro rejection.
4️⃣ Volume and spread expand on the breakdown — that’s real order-flow, not stop-hunts.
5️⃣ There’s untouched liquidity resting below the daily lows. That’s where the algorithm’s draw is.

A few important steps for creating robust and winning StrategiesAs the title says, I want to share knowledge & important insights into the best practices for creating robust, trustworthy and profitable trading Strategies here on TradingView.
These bits of information that my team I have gathered throughout the years and have managed to learn through mostly trial and error. Costly errors too .
Many of these points more professional traders know, however, there are some that are quite innovative for all levels of experience in my opinion. Please, feel free to correct me or add more in the comments.
There are a few strategic and tactical changes to our process that made a noticeable difference in the quality of Strategies and Indicators immediately.
Firstly and most importantly, we have all heard about it, but it is having the most data available. A good algorithm, when being built NEEDS to have as many market situations in its training data as possible. Choppy markets, uptrends, downtrends, fakeouts, manipulations - all of these are necessary for the strategy to learn the possible market conditions as much as possible and be prepared for trading on unknown data.
Many may have heard the phrase "History doesn't repeat itself but rhymes well" - you need to have the whole dictionary of price movements to be able to spot when it rhymes and act accordingly.
The TradingView Ultimate plan offers the most data in terms of historical candles and is best suited for creating robust strategies.
___
Secondly, of course, robustness tests. Your algorithm can perform amazingly on training data, but start losing immediately in real time, even if you have trained it on decades of data.
These include Monte-carlo simulations to see best and worst scenarios during the training period. Tests also include the fundamentally important out-of-sample checks . For those who aren’t familiar - this means that you should separate data into training sets and testing sets. You should train your algorithm on some data, then perform a test on unknown to the optimization process data. It's common practice to separate data as 20% training / 20% unknown / 20% training etc. to build a data set that will show how your algorithm performs on unknown to it market movements. Out of sample tests are crucial and you can never trust a strategy that has not been through them.
Walk-forward simulations are similar - you train your algorithm on X amount of data and simulate real-time price feeds and monitor how it performs. You can use the Replay function of TradingView to do walk-forward tests!
When you are doing robustness tests, we have found that a stable strategy performs around 90% similarly in terms of win rate and Sortino ratio compared to training data. The higher the correlation between training performance and out of sample performance, the more risk you can allocate to this algorithm.
___
Now lets move onto some more niche details. Markets don’t behave the same when they are trending downward and when they are trending upwards. We have found that separating parameters for optimization into two - for long and for short - independent of each other, has greatly improved performance and also stability.
Logically it is obvious when you look at market movements. In our case, with cryptocurrencies, there is a clear difference between the duration and intensity of “dumps” and “pumps”. This is normal, since the psychology of traders is different during bearish and bullish periods. Yes, introducing double the amount of parameters into an algorithm, once for long, once for short, can carry the risk of overfitting since the better the optimizer (manual or not), the better the values will be adjusted to fit training data. But if you apply the robustness tests mentioned above, you will find that performance is greatly increased by simply splitting trade logic between long and short. Same goes for indicators.
Some indicators are great for uptrends but not for downtrends. Why have conditions for short positions that include indicators that are great for longs but suck at shorting, when you can use ones that perform better in the given context?
___
Moving on - while overfitting is the main worry when making an algorithm, underoptimization as a result of fear of overfitting is a big threat too . You need to find the right balance by using robustness tests. In the beginning, we had limited access to software to test our strategies out of sample and we found out that we were underoptimizing because we were scared of overfitting, while in reality we were just holding back the performance out of fear. Whats worse is we attributed the losses in live trading to what we thought was overfitting, while in reality we were handicapping the algorithm out of fear.
___
Finally, and this relates to trading in general too, we put in place very strict rules and guidelines on what indicators to use in combination with others and what their parameter range is. We went right to theory and capped the values for each indicator to be within the predefined limits.
A simple example is MACD . Your optimizer might make a condition that includes MACD with a fast length of 200, slow length of 160 and signal length of 100. This may look amazing on backtesting and may work for a bit on live testing, but these values are FUNDAMENTALLY wrong (Investopedia, MACD). You must know what each indicator does and how it calculates its values. Having a fast length bigger than the slow one is completely backwards, but the results may show otherwise.
When you optimize any strategy, manually or with the help of a software, be mindful of the theory. Mathematical formulas don’t care about the indicator’s logic, only about the best combination of numbers to reach the goal you are optimizing for - be it % Return, Profit Factor or other.
Parabolic SAR is another one - you can optimize values like 0.267; 0.001; 0.7899 or the sort and have great performance on backtesting. This, however, is completely wrong when you look into the indicator and it’s default values (Investopedia, Parabolic SAR).
To prevent overfitting and ensure a stable profitability over time, make sure that all parameters are within their theoretical limits and constraints, ideally very close to their default values.
Thank you for reading this long essay and I hope that at least some of our experience will help you in the future. We have suffered greatly due to things like not following trading theory and leaving it all up to pure mathematical optimization, which is ignorant of the principles of the indicators. The separation between Long / Short logic was also an amazing instant improvement.
View the linked idea where we explain the psychology of risk management and suggest a few great ways to calculate and manage your risk when trading - just as important as the strategy itself!
What do you think? Do you use any of these methods; Or better ones?
Let us know in the comments.
Position Sizing: The Math That Separates Winners from LosersMost traders blow up their accounts not because of bad entries, but because of terrible position sizing. You can have a 60% win rate and still go broke if you risk too much per trade.
The 1-2% Rule (And Why It Works)
Never risk more than 1-2% of your account on a single trade.
Here's why this matters:
Risk 2% per trade → You can survive 50 consecutive losses
Risk 10% per trade → 10 losses = -65% drawdown (you need +186% just to break even)
Risk 20% per trade → 5 losses = game over
The Position Sizing Formula
Position Size = (Account Size × Risk %) / (Entry Price - Stop Loss)
Real Example:
Account: $10,000
Risk per trade: 2% = $200
Entry: $50
Stop loss: $48
Risk per share: $2
Position Size = $200 / $2 = 100 shares
If stopped out → You lose exactly $200 (2%)
If price hits $54 → You make $400 (4% gain, 2:1 R/R)
Different Risk Frameworks
Conservative (1% risk)
Best for: Beginners, volatile markets, high-frequency trading
Survivability: Can take 100+ losses
Growth: Slower but steady
Moderate (2% risk)
Best for: Experienced traders, tested strategies
Survivability: 50 consecutive losses
Growth: Balanced risk/reward
Aggressive (3-5% risk)
Best for: High conviction setups, smaller accounts trying to grow
Survivability: 20-33 losses
Growth: Faster but dangerous
Warning: Never go above 5% unless you're gambling, not trading.
The Kelly Criterion (Advanced)
For traders with significant backtested data:
Kelly % = Win Rate -
Example:
Win rate: 55%
Avg win: $300
Avg loss: $200
Win/Loss ratio: 1.5
Kelly % = 0.55 - = 0.55 - 0.30 = 25%
But use 1/4 Kelly (6.25%) or 1/2 Kelly (12.5%) - Full Kelly is too aggressive for real markets.
Common Position Sizing Mistakes
❌ Revenge trading larger after a loss
✅ Keep position size constant based on current account value
❌ Risking the same dollar amount regardless of setup quality
✅ Risk 0.5% on B-setups, 2% on A+ setups
❌ Ignoring correlation risk
✅ If you have 5 tech stocks open, you're really risking 10% on one sector
❌ Not adjusting after drawdowns
✅ If account drops 20%, your 2% risk should recalculate from new balance
The Volatility Adjustment
In high volatility (VIX > 30):
Cut position sizes by 30-50%
Widen stops or risk less per trade
Market can gap past your stops
In low volatility (VIX < 15):
Can use normal position sizing
Tighter stops possible
More predictable price action
My Personal Framework
I use a tiered approach:
High conviction setups (A+): 2% risk
Good setups (A): 1.5% risk
Decent setups (B): 1% risk
Experimental/learning: 0.5% risk
Maximum combined risk: Never more than 6% across all open positions.
The Bottom Line
Position sizing is the only thing you have complete control over in trading. You can't control:
Where price goes
Market volatility
News events
But you CAN control how much you risk.
The traders who survive long enough to get good are the ones who master position sizing first.
What's your current risk per trade? Drop it in the comments. If it's above 5%, we need to talk.