Global Equity TrendsIntroduction
Global equity markets serve as the heartbeat of the world economy. They represent ownership in publicly traded companies, providing investors with opportunities for wealth creation, diversification, and long-term growth. Over the decades, global equity trends have evolved through technological innovation, globalization, regulatory reforms, and changing investor behavior. The past few years—especially post-COVID-19—have seen dramatic shifts in market dynamics, valuations, and sectoral leadership. Understanding global equity trends is essential for investors, policymakers, and economists to navigate the ever-changing financial landscape.
1. The Evolution of Global Equity Markets
Historically, equity markets were dominated by a few developed economies like the United States, United Kingdom, Germany, and Japan. However, over the last three decades, globalization and liberalization of capital markets have expanded participation to emerging economies such as China, India, Brazil, and South Korea.
In the 1980s and 1990s, major structural reforms and the integration of technology revolutionized stock trading, making global equities more accessible and transparent. The rise of electronic trading, online brokerages, and exchange-traded funds (ETFs) further democratized participation. Today, investors can access global equities at the click of a button, enabling cross-border diversification and global asset allocation strategies.
2. Post-Pandemic Recovery and Market Resilience
The COVID-19 pandemic marked one of the most volatile periods in financial history. Equity markets crashed in early 2020 but rebounded swiftly, driven by unprecedented fiscal stimulus and ultra-loose monetary policies by central banks. The recovery was uneven—technology and healthcare sectors surged, while travel, energy, and traditional manufacturing lagged behind.
By 2021, global markets reached record highs, fueled by optimism over digital transformation, renewable energy, and e-commerce growth. However, 2022 brought renewed challenges as inflation surged, interest rates rose sharply, and geopolitical tensions—particularly the Russia-Ukraine war—disrupted supply chains and energy markets. Despite these shocks, equity markets have shown remarkable adaptability, demonstrating the long-term resilience of the global economy.
3. Regional Market Performance
a. United States
The U.S. remains the anchor of the global equity landscape, accounting for over 60% of global market capitalization. The S&P 500, NASDAQ, and Dow Jones indices have led global performance, driven by technology giants like Apple, Microsoft, Nvidia, and Alphabet. The U.S. equity trend has been characterized by strong innovation, corporate profitability, and deep capital markets. However, valuation concerns and interest rate sensitivity remain key challenges going forward.
b. Europe
European equities have underperformed relative to the U.S., primarily due to slower economic growth, demographic challenges, and political fragmentation. Nonetheless, markets like Germany, France, and the Netherlands remain strong in industrials, luxury goods, and renewable energy. The United Kingdom, post-Brexit, has experienced both volatility and opportunity, particularly in financial services and energy sectors.
c. Asia-Pacific
Asia has emerged as the growth engine of global equities. China, Japan, India, and South Korea have become crucial drivers of market performance. China’s rise was spectacular through the 2010s, led by technology and manufacturing. However, recent regulatory crackdowns and real estate sector weakness have slowed momentum. India, in contrast, has become a standout performer, attracting foreign investment through policy reforms, a booming startup ecosystem, and a rapidly growing consumer base. Japan’s renewed corporate reforms and governance improvements have also revitalized investor confidence.
d. Emerging Markets
Emerging market equities offer diversification and high growth potential but are prone to volatility. Latin America, Africa, and Southeast Asia have benefited from commodity booms and favorable demographics, though they remain exposed to currency risk, political instability, and inflation. The long-term outlook remains promising, especially for economies focusing on industrialization and digital innovation.
4. Sectoral Shifts in Global Equities
Equity trends are increasingly defined by sectoral transformations:
a. Technology Dominance
The technology sector continues to lead global equity growth. Artificial intelligence, cloud computing, semiconductors, and digital platforms have driven exponential gains. Companies like Apple, Microsoft, Amazon, and Nvidia dominate global valuations. The “tech megatrend” is supported by ongoing digitalization across industries, making technology not just a sector, but the foundation of modern economic growth.
b. Renewable Energy and ESG Investing
Environmental, Social, and Governance (ESG) principles have reshaped global equity allocations. Investors now prioritize sustainability, clean energy, and ethical governance. Renewable energy companies—solar, wind, and electric vehicle producers—are gaining prominence. ESG-themed ETFs and funds are attracting trillions in inflows, transforming how corporations are valued and managed.
c. Healthcare and Biotechnology
The pandemic accelerated investment in healthcare innovation. Biotechnology, telemedicine, and pharmaceutical research have become vital equity themes. Aging populations in developed nations and rising healthcare demand in emerging markets continue to drive this sector’s growth trajectory.
d. Financial Services Transformation
The financial sector is evolving with the rise of fintech, digital banking, and blockchain technology. Traditional banks face disruption from agile startups offering digital wallets, online lending, and decentralized finance (DeFi). Nonetheless, rising interest rates have revived profitability for major banks, especially in the U.S. and Europe.
e. Commodities and Industrials
With global infrastructure spending increasing, industrial and commodity-related equities are regaining attention. Energy transition metals like lithium, copper, and nickel are vital to the EV revolution, attracting investors seeking exposure to the “green economy.”
5. The Role of Institutional and Retail Investors
The composition of equity investors has transformed dramatically. Institutional investors—pension funds, sovereign wealth funds, and mutual funds—continue to dominate in size, but retail participation has surged. The rise of zero-commission trading platforms and social investing communities has empowered individuals globally.
The “meme stock” phenomenon of 2021, driven by platforms like Reddit, demonstrated the influence of retail investors. Meanwhile, institutional investors are increasingly adopting quantitative and algorithmic strategies, relying on big data and AI for trading decisions. This blend of technology and democratization has increased liquidity but also amplified short-term volatility.
6. Globalization, Integration, and Interdependence
Equity markets today are more interconnected than ever. A policy shift by the U.S. Federal Reserve can ripple through Asia and Europe within hours. Cross-border listings, dual-traded stocks, and global ETFs have deepened financial integration. However, this interconnectedness also increases systemic risk. Global crises—whether economic, geopolitical, or environmental—can trigger synchronized market reactions.
At the same time, globalization has led to the rise of multinational corporations whose revenues are not confined to domestic borders. For example, companies like Apple, Nestlé, and Samsung derive the majority of their income from international markets, blurring the line between “local” and “global” equities.
7. Impact of Geopolitical and Economic Factors
Geopolitical tensions significantly influence equity trends. The U.S.–China trade war, the Russia-Ukraine conflict, and Middle East instability all shape investor sentiment. Sanctions, supply chain disruptions, and shifts in energy policy affect specific sectors and regional equities.
Macroeconomic policies also play a central role. Inflation trends, interest rate decisions, and fiscal spending directly impact equity valuations. Central banks, particularly the U.S. Federal Reserve and the European Central Bank, are the key arbiters of global liquidity. The transition from an era of cheap money (2010–2021) to a higher-rate environment post-2022 has reshaped risk appetite and capital flows.
8. Technological Innovation and Market Structure
Technology has transformed not only which companies succeed but also how markets function. High-frequency trading, blockchain-based settlement systems, and artificial intelligence-driven analysis are redefining efficiency and transparency. Global stock exchanges are embracing digital transformation to attract international listings and facilitate faster execution.
Decentralized trading platforms and tokenized assets may represent the next frontier. Although still in early stages, blockchain technology could one day enable direct trading of fractional equity shares globally without intermediaries, further expanding market accessibility.
9. ESG and Sustainable Investing as a Core Trend
ESG has moved from the periphery to the mainstream of equity investing. Investors are increasingly aware that sustainability reduces long-term risk and enhances resilience. Governments and regulators are enforcing stricter disclosure requirements on carbon emissions, labor practices, and governance standards. As a result, companies with strong ESG performance often enjoy lower capital costs and better investor confidence. The global shift toward green finance will continue to shape equity trends for decades.
10. Valuation Trends and Market Cycles
Valuation trends vary across regions and sectors. U.S. equities trade at relatively higher price-to-earnings ratios due to strong earnings growth expectations. European markets are generally undervalued, reflecting lower growth prospects but offering potential for value investors. Emerging markets often trade at discounts due to perceived risks but can deliver outsized returns during expansion cycles.
Market cycles—bull and bear phases—are natural in equities. After years of stimulus-driven bull markets, recent corrections have reintroduced discipline and selectivity. Investors are now focusing on fundamentals, earnings quality, and balance sheet strength rather than speculative momentum.
11. The Future of Global Equities
The next decade will likely bring both opportunities and disruptions. Key future trends include:
Artificial Intelligence and Automation: AI will revolutionize productivity, profit margins, and equity valuations across multiple sectors.
Decarbonization and Energy Transition: Companies aligned with net-zero goals will attract greater capital inflows.
Demographic Shifts: Aging populations in developed economies and youthful demographics in emerging nations will reshape consumption and investment patterns.
Financial Inclusion and Tokenization: Blockchain-based equity systems could make investing more accessible worldwide.
Reshoring and Supply Chain Realignment: As nations seek resilience over efficiency, industrial and logistics equities will see renewed focus.
The long-term outlook remains optimistic. Despite cyclical volatility, equities continue to outperform most asset classes over extended horizons due to innovation, productivity gains, and corporate adaptability.
12. Conclusion
Global equity trends mirror the evolution of the world economy itself—dynamic, interconnected, and resilient. From the dominance of U.S. technology firms to the rapid growth of Asian markets and the rise of ESG investing, equities reflect both opportunity and transformation.
Investors navigating this complex landscape must adapt to structural changes, remain diversified across regions and sectors, and embrace innovation while managing risk. As globalization, technology, and sustainability redefine economic priorities, global equity markets will continue to be the central pillar of wealth creation, capital formation, and economic progress in the 21st century.
X-indicator
Developed Market and Emerging MarketIntroduction
The global economy is an interconnected network of nations at different stages of economic development. These stages are generally categorized into developed markets, emerging markets, and frontier markets. Among them, developed and emerging markets play the most significant roles in shaping international trade, investment flows, and financial stability. Understanding these two categories is essential for investors, policymakers, and economists who analyze global financial dynamics, risk profiles, and growth opportunities.
Developed markets represent mature, advanced economies with strong industrial bases, high income per capita, and stable political systems. Emerging markets, on the other hand, are countries in the process of industrialization and modernization, showing rapid growth but also facing economic volatility and structural challenges. This distinction helps investors gauge risk, return potential, and diversification strategies in global portfolios.
1. Definition and Concept
Developed Market
A developed market (also known as an advanced or mature market) refers to a country with a highly industrialized economy, well-established financial systems, and high living standards. These nations have robust infrastructure, sophisticated regulatory frameworks, and stable political environments that promote predictable business operations. Their economic activities are primarily driven by services and advanced manufacturing rather than agriculture or basic industries.
International organizations such as the International Monetary Fund (IMF), World Bank, and United Nations classify developed markets based on indicators like:
Gross Domestic Product (GDP) per capita
Human Development Index (HDI)
Financial market sophistication
Industrial diversification
Institutional strength and governance quality
Examples of developed markets include:
United States
Canada
United Kingdom
Germany
France
Japan
Australia
South Korea
Switzerland
These economies form the backbone of global financial systems and often host major stock exchanges such as the NYSE, NASDAQ, London Stock Exchange, and Tokyo Stock Exchange.
Emerging Market
An emerging market is a nation transitioning from a developing to a developed economy. These countries experience rapid industrialization, urbanization, and integration into the global economy, leading to substantial growth potential. However, they also face higher risks, including political instability, inflation volatility, and weaker institutional frameworks.
The term "emerging market" was popularized by economist Antoine van Agtmael in the 1980s to describe countries with growing capital markets that were becoming attractive to foreign investors.
Criteria defining emerging markets include:
Moderate to high GDP growth rates
Expanding middle class
Increasing foreign investment
Developing infrastructure and technology
Improving governance and market reforms
Prominent emerging markets include:
China
India
Brazil
Russia
Mexico
Indonesia
South Africa
Turkey
Thailand
These countries often form part of groupings such as BRICS (Brazil, Russia, India, China, South Africa) or MINT (Mexico, Indonesia, Nigeria, Turkey).
2. Key Characteristics
Developed Markets
High Income Levels:
Developed economies have high GDP per capita, reflecting widespread wealth and purchasing power. For example, countries like the U.S. and Switzerland boast per capita incomes exceeding $60,000 annually.
Mature Financial Systems:
Their banking systems, capital markets, and insurance sectors are well-established and transparent, governed by strong regulatory frameworks.
Low Political and Economic Risk:
Stable governments, rule of law, and consistent economic policies create confidence among investors.
Advanced Infrastructure:
Efficient transportation, communication, and energy networks support productivity and competitiveness.
Technological Leadership:
Developed nations are at the forefront of innovation in industries such as IT, biotechnology, and renewable energy.
Stable Currency and Inflation:
Their central banks, such as the U.S. Federal Reserve or the European Central Bank, maintain price stability and sound monetary policy.
Emerging Markets
High Growth Potential:
Emerging economies often record faster GDP growth, sometimes exceeding 5–8% annually, driven by industrialization and rising domestic consumption.
Expanding Middle Class:
Economic development leads to a growing middle-income population, which boosts demand for goods, housing, and financial services.
Reform-Driven Economies:
Structural reforms, such as privatization and liberalization, make these markets more attractive to foreign investors.
Developing Financial Systems:
Their capital markets are growing but may still lack depth, transparency, and liquidity compared to developed markets.
Currency and Political Volatility:
Exchange rates and government policies can fluctuate significantly, affecting investor confidence.
Urbanization and Industrialization:
Rapid city expansion and manufacturing growth drive job creation and export competitiveness.
3. Economic Indicators Comparison
Indicator Developed Markets Emerging Markets
GDP per capita High (> $40,000) Moderate ($5,000–$20,000)
Growth rate Moderate (1–3%) High (4–8%)
Inflation Low and stable Moderate to high
Infrastructure Advanced Developing
Political stability Strong Varies widely
Currency stability High Often volatile
Industrial base Services and high-tech Manufacturing and agriculture
Income inequality Relatively low Often high
Financial markets Deep and liquid Expanding but less liquid
4. Role in Global Economy
Developed Markets’ Role
Developed economies act as the anchors of global finance and trade. They host the largest multinational corporations, reserve currencies, and financial hubs. The U.S. dollar, euro, and yen serve as international mediums of exchange, influencing global monetary policy. Their advanced financial systems provide capital to the rest of the world through foreign direct investments (FDI) and institutional funds.
They also drive technological innovation and research & development, setting global standards in production and governance. Developed markets’ consumer demand fuels global exports from emerging and developing nations, linking their prosperity to world trade flows.
Emerging Markets’ Role
Emerging economies represent the engine of global growth in the 21st century. They contribute a significant share of global GDP expansion due to large populations, rapid industrialization, and consumption growth. For instance, China and India alone account for over one-third of global economic growth.
They are crucial suppliers of raw materials, manufactured goods, and increasingly digital services. Moreover, they offer investment diversification opportunities, as their growth cycles may differ from developed economies. Emerging markets also play an essential role in addressing global challenges such as energy demand, environmental sustainability, and digital transformation.
5. Investment Perspective
From an investment standpoint, both developed and emerging markets present distinct risk-reward profiles.
Developed Market Investments
Investing in developed economies offers stability, transparency, and lower risk. Their stock markets are highly liquid and regulated, making them ideal for long-term investors seeking steady returns. However, growth opportunities may be limited because of market maturity and slower GDP expansion.
Common investment vehicles include:
Blue-chip equities (e.g., Apple, Microsoft, Nestlé)
Government bonds (e.g., U.S. Treasuries)
Index funds tracking major benchmarks (e.g., S&P 500, FTSE 100)
Emerging Market Investments
Emerging markets provide higher growth potential but also higher volatility. Investors are attracted to the potential for strong returns from sectors like infrastructure, consumer goods, and technology. However, risks include political instability, currency depreciation, and weaker governance.
Investment opportunities include:
Local equities and bonds
Exchange-traded funds (ETFs) tracking emerging indices (e.g., MSCI Emerging Markets Index)
Direct investment in infrastructure or start-ups
Diversifying portfolios across both markets helps balance stability and growth potential.
6. Challenges Faced by Each Market Type
Challenges in Developed Markets
Slow Growth:
Mature economies experience limited GDP expansion due to market saturation and aging populations.
High Debt Levels:
Many developed nations carry large public debts, creating fiscal pressures.
Technological Disruption:
Automation and AI may lead to job displacement and inequality.
Geopolitical Risks:
Trade disputes and policy shifts (e.g., Brexit, U.S.–China tensions) can affect global stability.
Challenges in Emerging Markets
Political Instability:
Government changes and weak institutions can disrupt economic policy.
Inflation and Currency Risk:
Volatile exchange rates can deter foreign investment.
Dependence on Commodities:
Many emerging economies rely heavily on exports like oil or minerals, making them vulnerable to price swings.
Infrastructure Deficits:
Inadequate roads, power supply, and communication networks limit industrial efficiency.
Capital Flight:
When global interest rates rise, investors often withdraw funds from riskier emerging markets.
7. Interdependence Between Developed and Emerging Markets
Globalization has woven developed and emerging markets into a mutually dependent economic fabric. Developed nations invest heavily in emerging markets for higher returns and resource access, while emerging markets rely on developed economies for technology, capital, and demand.
For example:
U.S. and European companies outsource manufacturing to Asia to reduce costs.
China and India import advanced machinery and software from developed countries.
Financial crises or interest rate changes in the U.S. can ripple across emerging economies.
Thus, while they differ in structure and stability, both market types are interlinked in global trade, investment, and policy networks.
8. The Future Outlook
The future of global growth is expected to be driven increasingly by emerging markets. By 2050, countries like China, India, and Indonesia are projected to become the world’s largest economies in purchasing power parity (PPP) terms. Their rising consumer bases, technological adoption, and urbanization will reshape global demand patterns.
However, developed markets will continue to dominate in innovation, finance, and governance standards. They will serve as models of economic stability and sustainability, influencing the global economic architecture through institutions such as the IMF, World Bank, and G7.
The key to a balanced global economy lies in cooperation between developed and emerging markets, focusing on trade fairness, technology transfer, and sustainable development.
Conclusion
Developed and emerging markets represent two distinct yet complementary pillars of the global economic system. Developed markets embody stability, efficiency, and innovation, while emerging markets offer dynamism, growth, and transformation. Together, they shape the rhythm of global finance, trade, and investment.
For investors and policymakers alike, understanding the interplay between these markets is crucial. Developed economies provide safe, predictable environments for steady returns, whereas emerging markets offer the promise of high growth with commensurate risks. As globalization deepens and digital technologies blur traditional boundaries, the collaboration and balance between these two market categories will define the future of global prosperity.
CBDCs as Digital AssetsIntroduction
In the rapidly evolving landscape of global finance, digitalization is redefining how value is created, stored, and exchanged. Among the most transformative innovations in this domain is the Central Bank Digital Currency (CBDC) — a digital form of sovereign money issued by a nation’s central bank. Unlike cryptocurrencies such as Bitcoin or Ethereum, CBDCs are centralized, fully regulated, and backed by the monetary authority of a country. As financial systems shift toward more digital and decentralized infrastructures, CBDCs are emerging not only as new payment tools but also as significant digital assets that may redefine global trade, investment, and monetary policy.
This essay explores the concept of CBDCs as digital assets, their structure, design models, global adoption trends, potential benefits, risks, and their future implications for economies and financial systems worldwide.
Understanding CBDCs: Concept and Structure
A Central Bank Digital Currency (CBDC) is a digital version of a country’s fiat currency, representing a direct liability of the central bank. It can be used by individuals, businesses, and financial institutions as a means of payment, store of value, and unit of account — the three fundamental functions of money. Unlike commercial bank deposits or cryptocurrencies, CBDCs are risk-free because they are backed by the full faith and credit of the issuing government.
CBDCs typically exist in two primary forms:
Retail CBDCs: Designed for public use, enabling citizens and businesses to conduct transactions directly with the central bank through digital wallets.
Example: The Bahamian Sand Dollar, Nigeria’s eNaira, and China’s e-CNY.
Wholesale CBDCs: Used primarily by financial institutions for interbank settlements, cross-border transfers, and clearing operations.
Example: Project Helvetia by the Swiss National Bank and Project Jura by the Banque de France.
As digital assets, CBDCs are tokenized representations of sovereign money that exist in digital form on a secure ledger — either centralized or distributed. They can integrate with blockchain technology or function on traditional centralized databases, depending on the design choice of the issuing central bank.
CBDCs vs. Cryptocurrencies and Stablecoins
To understand CBDCs as digital assets, it is essential to distinguish them from other digital currencies:
Cryptocurrencies (e.g., Bitcoin, Ethereum) are decentralized, not backed by any authority, and rely on market demand for valuation.
Stablecoins (e.g., USDT, USDC) are privately issued tokens pegged to fiat currencies but not directly guaranteed by central banks.
CBDCs, on the other hand, combine the trust and stability of fiat currencies with the efficiency and speed of digital technology.
This hybrid nature positions CBDCs as state-backed digital assets that can bridge the gap between traditional financial systems and the emerging digital economy.
The Economic Rationale Behind CBDCs
Central banks worldwide are exploring CBDCs for several economic and strategic reasons:
Enhancing Payment Efficiency:
Traditional payment systems, especially cross-border transactions, are slow and costly. CBDCs can streamline these processes by enabling real-time settlements and reducing dependency on intermediaries.
Financial Inclusion:
CBDCs can extend financial services to unbanked populations by allowing anyone with a mobile phone to access digital payment systems, especially in developing nations.
Maintaining Monetary Sovereignty:
The rapid rise of private digital currencies and foreign stablecoins poses a challenge to national monetary control. CBDCs enable central banks to retain authority over the money supply and ensure economic stability.
Reducing Transaction Costs:
With blockchain or distributed ledger technology (DLT), CBDCs can minimize clearing and settlement costs, promoting more transparent and efficient financial ecosystems.
Combating Illicit Activities:
Digital traceability enables better monitoring of transactions, helping authorities curb money laundering, tax evasion, and terrorism financing.
CBDCs as Digital Assets in Financial Markets
As digital assets, CBDCs possess unique attributes that can transform both domestic and international finance. Their programmable nature and compatibility with other tokenized assets open the door to new financial models and asset ecosystems.
1. Tokenization and Programmability
CBDCs can be programmed with smart contracts, enabling automated execution of financial transactions — such as interest payments, tax collection, or subsidy distribution — without intermediaries. This programmable feature turns CBDCs into intelligent digital assets capable of interacting with decentralized finance (DeFi) systems, digital bonds, and other tokenized securities.
2. Integration with Digital Asset Markets
CBDCs can serve as the foundation layer for broader digital asset ecosystems. They can facilitate instant settlement of tokenized assets, streamline securities trading, and enhance liquidity management. For example, central banks could use wholesale CBDCs to settle government bond trades in real time, reducing counterparty risks.
3. Cross-Border Payments
In global trade, CBDCs could eliminate the inefficiencies of correspondent banking. Multi-CBDC arrangements, such as the mBridge project (involving Hong Kong, China, Thailand, and the UAE), are testing platforms where multiple CBDCs interact seamlessly. This could create a new class of digital reserve assets, enabling faster, cheaper, and more transparent cross-border settlements.
Global Adoption and Case Studies
Central banks across more than 130 countries — representing over 98% of global GDP — are exploring or piloting CBDC initiatives. Some notable examples include:
China (Digital Yuan / e-CNY):
The People’s Bank of China has been a pioneer in retail CBDCs, using the e-CNY for domestic transactions, public salaries, and pilot programs in major cities.
European Union (Digital Euro):
The European Central Bank aims to launch a digital euro to complement physical cash, ensuring privacy, security, and monetary stability in the Eurozone.
India (Digital Rupee / e₹):
The Reserve Bank of India launched pilot programs for wholesale and retail CBDCs in 2022, exploring use cases in interbank settlements, government payments, and retail transactions.
United States (Digital Dollar):
The Federal Reserve is researching potential frameworks for a digital dollar, emphasizing privacy, interoperability, and financial stability.
Bahamas (Sand Dollar):
The world’s first fully deployed retail CBDC, launched in 2020, aimed at improving financial inclusion across remote islands.
These global experiments highlight CBDCs’ potential as national digital assets that could reshape the structure of global payments and reserves.
Benefits of CBDCs as Digital Assets
Trust and Stability:
Being issued by central banks, CBDCs are backed by government guarantees, making them a more stable form of digital money compared to volatile cryptocurrencies.
Interoperability:
CBDCs can act as a universal settlement asset across various financial systems, improving coordination between banks, fintechs, and digital platforms.
Transparency and Traceability:
Digital ledgers enable authorities to monitor money flows in real time, enhancing fiscal transparency and reducing corruption.
Resilience and Innovation:
By introducing programmable features, CBDCs foster innovation in payment systems, encouraging new fintech products and digital services.
Cost Reduction:
The elimination of intermediaries lowers transaction fees and settlement times, particularly in international trade and remittances.
Support for Digital Transformation:
CBDCs align with broader trends toward digital economies, e-governance, and data-driven policy-making.
Risks and Challenges
While CBDCs offer vast potential, they also introduce new complexities and risks that central banks must manage carefully.
1. Privacy Concerns
CBDCs could enable governments to track every transaction, raising concerns about surveillance and data privacy. Designing systems that balance transparency with anonymity is critical.
2. Cybersecurity Risks
As digital assets, CBDCs are vulnerable to cyberattacks, data breaches, and technological failures. Ensuring secure, resilient, and tamper-proof systems is essential.
3. Financial Disintermediation
If individuals hold CBDCs directly with central banks, it may reduce the role of commercial banks in deposit-taking, potentially destabilizing credit markets.
4. Technological Inequality
Not all citizens have equal access to digital infrastructure. Poor connectivity and lack of digital literacy could limit CBDC adoption.
5. Global Fragmentation
Different technological standards and regulatory frameworks across nations could create fragmented CBDC ecosystems, hindering cross-border interoperability.
6. Monetary Policy Complexity
Introducing programmable money could complicate the transmission of monetary policy and raise new questions about interest rates on digital assets.
CBDCs and the Future of Monetary Policy
CBDCs provide central banks with new tools for implementing and monitoring monetary policy. For instance:
Direct Stimulus Distribution: Governments could issue programmable CBDCs for targeted economic aid, ensuring efficient and transparent delivery.
Interest-bearing CBDCs: Central banks could adjust interest rates directly on CBDC holdings, influencing spending and saving behavior more precisely.
Real-time Economic Data: Digital transaction data could provide policymakers with real-time insights into economic activity, enabling faster responses to inflation or recession.
However, this also raises concerns about excessive control and the need for robust governance frameworks to prevent misuse of power.
CBDCs and the Digital Asset Ecosystem
The emergence of CBDCs is not occurring in isolation. They are expected to interact with other components of the digital asset ecosystem, including:
Tokenized securities and commodities
Decentralized finance (DeFi) protocols
Blockchain-based identity systems
Digital wallets and payment gateways
By enabling secure settlement and universal interoperability, CBDCs could become the anchor of the global digital asset infrastructure — ensuring stability in a marketplace otherwise characterized by volatility and fragmentation.
The Future Outlook
The evolution of CBDCs represents more than a technological upgrade — it signifies a shift in the philosophy of money. As digital assets, CBDCs have the potential to transform the global financial order by:
Redefining the role of central banks in the digital economy
Enhancing global financial inclusion and efficiency
Introducing programmable, transparent, and instantaneous financial systems
In the coming decade, the success of CBDCs will depend on how well central banks address privacy, security, interoperability, and governance challenges while ensuring public trust and economic stability.
Conclusion
CBDCs, as digital assets, stand at the intersection of technology, economics, and policy. They combine the reliability of state-backed money with the innovation of blockchain and digital finance. By doing so, they promise to modernize financial systems, expand inclusion, and strengthen monetary sovereignty. Yet, their implementation requires careful balancing between innovation and regulation, privacy and oversight, and efficiency and stability.
Ultimately, CBDCs are more than just a new form of currency — they are the next evolution of money in the digital era. As nations continue experimenting and refining their models, CBDCs will likely play a pivotal role in shaping the future of the global financial system — transforming how we perceive, use, and store value in an increasingly digital world.
Fluctuation Effects on the Global EconomyIntroduction
The global economy is a dynamic and interconnected system that continuously experiences fluctuations due to various internal and external factors. Economic fluctuations — often referred to as business cycles — involve alternating periods of expansion and contraction in economic activity, influenced by changes in market forces, monetary policies, trade dynamics, technological innovations, and geopolitical developments. These fluctuations impact every aspect of the world economy, including employment levels, inflation rates, investment flows, international trade, and overall economic stability. Understanding how these fluctuations affect the global economy is crucial for investors, policymakers, and businesses seeking to navigate uncertainty and maintain stability.
1. Understanding Economic Fluctuations
Economic fluctuations refer to the unpredictable variations in key macroeconomic indicators such as GDP growth, inflation, interest rates, and employment. These fluctuations are not always harmful; they represent natural movements in response to supply-demand shifts, innovation cycles, and consumer confidence.
1.1 Business Cycles
Business cycles typically include four phases:
Expansion: Characterized by increasing production, employment, and consumer spending.
Peak: The economy operates at full capacity, often leading to inflationary pressures.
Contraction (Recession): Decline in output, demand, and investment, often resulting in job losses.
Trough: The lowest point before recovery begins.
1.2 Causes of Economic Fluctuations
Economic fluctuations are caused by multiple factors:
Monetary and fiscal policy shifts
Commodity price volatility (especially oil and gas)
Technological disruptions
Global trade imbalances
Financial crises and capital flows
Geopolitical tensions
Natural disasters or pandemics
These elements interact in complex ways, creating ripple effects across the world economy.
2. Impact on Global Trade and Investment
One of the most direct consequences of economic fluctuations is their effect on global trade and investment. When major economies experience instability, their trading partners face repercussions as well.
2.1 Trade Volume Volatility
During periods of expansion, demand for imports rises as consumers and industries require more goods and raw materials. Conversely, recessions reduce purchasing power and decrease international trade. For instance, the 2008 global financial crisis caused global trade to contract by nearly 12% in 2009, marking one of the steepest declines in modern history.
2.2 Foreign Direct Investment (FDI)
Fluctuations influence investor confidence. During booms, foreign investors channel funds into emerging markets, seeking higher returns. However, in uncertain times, investors retreat to safe-haven assets like gold, U.S. Treasury bonds, or stable currencies such as the U.S. dollar and Swiss franc. Such movements create capital flight from developing economies, reducing growth potential.
2.3 Exchange Rate Instability
Economic fluctuations often trigger exchange rate volatility. For example, when a country experiences inflation or a balance of payment deficit, its currency value declines. This impacts export competitiveness and import costs, influencing inflation and consumption globally. Exchange rate fluctuations thus act as both a symptom and a catalyst of broader economic cycles.
3. Employment and Income Inequality
Economic fluctuations deeply influence labor markets and income distribution across countries.
3.1 Employment Cycles
In expansionary phases, companies hire more workers to meet rising demand, reducing unemployment and increasing wages. However, recessions often lead to layoffs, wage cuts, and higher job insecurity. Millions of workers globally lost their jobs during the COVID-19 pandemic recession, highlighting how fluctuations can rapidly alter employment landscapes.
3.2 Wage and Income Inequality
Fluctuations tend to worsen income inequality. High-skilled workers and capital owners recover quickly during upturns, while low-skilled laborers face longer unemployment spells. Moreover, automation and digitization, which often accelerate during downturns, can replace labor-intensive jobs, widening wage disparities within and across nations.
4. Inflation, Deflation, and Price Instability
Fluctuations have a direct impact on price stability, which is essential for economic predictability.
4.1 Inflationary Pressures
During economic expansions, strong demand can outpace supply, leading to inflation. Moderate inflation encourages spending and investment, but excessive inflation — like the hyperinflation seen in Zimbabwe or Venezuela — erodes purchasing power and destabilizes the economy.
4.2 Deflationary Risks
Conversely, during recessions, falling demand can cause deflation — a sustained drop in prices. Deflation discourages consumption and investment, as people delay purchases expecting further price falls. Japan’s “Lost Decade” (1991–2001) is a prime example of prolonged deflation stalling economic growth.
4.3 Commodity Price Fluctuations
Oil, gas, metals, and agricultural products often experience sharp price swings. These fluctuations affect both producers and consumers globally. For instance, a sudden spike in oil prices increases transportation and manufacturing costs, leading to inflationary pressures worldwide.
5. Effects on Financial Markets
Financial markets are extremely sensitive to economic fluctuations. Investors continuously adjust their portfolios based on perceived risks and returns.
5.1 Stock Market Volatility
Economic uncertainty increases volatility in global stock indices. During downturns, corporate earnings decline, leading to market sell-offs. For example, the 2020 pandemic crash wiped out trillions in global market capitalization within weeks. Conversely, strong recovery expectations can drive rapid market rallies, as seen in 2021.
5.2 Bond Markets
Interest rate fluctuations, driven by central bank policy responses, affect bond yields. In times of recession, central banks cut rates to stimulate borrowing, pushing bond prices up. During inflationary periods, higher interest rates cause bond prices to fall.
5.3 Currency and Crypto Markets
Exchange rates and digital currencies also reflect economic fluctuations. Investors flock to stable currencies during uncertainty, while risk appetite during recoveries often boosts speculative assets like cryptocurrencies.
6. Policy Responses to Economic Fluctuations
Governments and central banks play crucial roles in mitigating the adverse impacts of economic fluctuations.
6.1 Monetary Policy
Central banks use tools such as interest rate adjustments, quantitative easing (QE), and reserve requirements to stabilize the economy. Lowering rates encourages borrowing and investment during recessions, while raising rates helps control inflation during booms. For instance, during the 2008 financial crisis, the U.S. Federal Reserve implemented QE to inject liquidity and support recovery.
6.2 Fiscal Policy
Governments use spending and taxation to influence economic activity. During downturns, expansionary fiscal policy — such as infrastructure spending and tax cuts — stimulates demand. Conversely, contractionary fiscal measures help control overheating during rapid expansions.
6.3 International Coordination
Because modern economies are interconnected, international institutions like the IMF, World Bank, and G20 play key roles in coordinating responses to global fluctuations. During the COVID-19 crisis, global stimulus packages totaling over $14 trillion were deployed to stabilize financial systems and support recovery.
7. Sectoral Impacts of Fluctuations
Different sectors of the economy respond differently to fluctuations.
7.1 Manufacturing and Trade
Manufacturing and trade sectors are highly sensitive to demand shifts. Recessions reduce exports and industrial production, whereas recovery phases trigger rapid rebounds in supply chains and production.
7.2 Technology and Innovation
Economic uncertainty often accelerates technological innovation, as companies seek efficiency. For example, digital transformation and automation surged during the pandemic as businesses adapted to remote operations.
7.3 Real Estate
Fluctuations impact property values, mortgage rates, and construction activity. Booming economies raise housing prices, while recessions lead to declines in real estate demand and construction investments.
7.4 Energy and Commodities
Commodity-based economies, such as those of Russia, Saudi Arabia, or Brazil, experience strong cyclical effects due to volatile global prices of oil, metals, and agricultural products.
8. Global Inequality and Regional Divergence
Economic fluctuations often exacerbate global inequality. Developed economies typically have stronger institutions, diversified industries, and better fiscal capacity to absorb shocks. In contrast, developing countries rely heavily on exports or commodities, making them more vulnerable to downturns.
8.1 Emerging Markets Vulnerability
When global interest rates rise, emerging markets face capital outflows, currency depreciation, and higher borrowing costs. For example, when the U.S. Federal Reserve tightens policy, many emerging markets experience economic slowdowns.
8.2 Regional Recovery Gaps
The pace of recovery also varies by region. Advanced economies often rebound faster due to stimulus support and technological strength, while low-income nations face delayed recoveries due to limited fiscal space and debt burdens.
9. Psychological and Behavioral Effects
Economic fluctuations also have psychological consequences for consumers and investors.
Consumer Confidence: People spend less when they feel uncertain about the future, deepening recessions.
Investor Sentiment: Fear and speculation drive market volatility. Behavioral biases often cause overreactions to news and policy changes.
Corporate Behavior: Companies may delay expansions, acquisitions, or R&D investments due to uncertainty, affecting long-term innovation and productivity.
10. Future Outlook: Managing Global Economic Fluctuations
As globalization deepens, economic fluctuations are likely to become more interdependent. The future global economy will be influenced by factors such as:
Technological transformation (AI, automation, digital finance)
Climate change and green energy transition
Geopolitical realignments
Debt sustainability and financial regulation
Policymakers must adopt forward-looking strategies, including:
Strengthening financial safety nets
Promoting inclusive growth
Enhancing transparency and international coordination
Diversifying economies to reduce vulnerability to global shocks
The world needs resilient systems that can withstand fluctuations without causing widespread human and economic hardship.
Conclusion
Fluctuations are an inevitable feature of the global economic landscape. While they bring challenges such as unemployment, inflation, and inequality, they also create opportunities for innovation, reform, and structural transformation. The key lies in how nations, institutions, and individuals respond to these changes. Effective policy coordination, sound financial management, and adaptive business strategies can mitigate adverse impacts and harness positive momentum. Ultimately, understanding and managing economic fluctuations is essential for achieving long-term stability, sustainable growth, and global prosperity.

Global Finance Control on Central BanksIntroduction
Central banks are the cornerstone of a nation’s monetary and financial stability. They regulate the money supply, manage interest rates, maintain price stability, and act as lenders of last resort during crises. Examples include the Federal Reserve (U.S.), the European Central Bank (ECB), the Bank of Japan (BoJ), and the Reserve Bank of India (RBI). However, in today’s deeply interconnected global economy, the autonomy of central banks is not absolute. They operate within a global financial system heavily influenced by international capital flows, global trade dynamics, foreign exchange markets, and powerful multinational institutions.
The control of global finance over central banks is a topic of major debate among economists and policymakers. While central banks are officially independent, their actions are shaped by the pressures and movements within global markets. Understanding this interplay is critical to analyzing how global economic policies are formed and how nations maintain financial sovereignty.
1. The Role and Functions of Central Banks
Central banks serve several core functions within national economies:
Monetary Policy Implementation – They regulate interest rates and control money supply to achieve economic stability.
Price Stability and Inflation Control – Ensuring that inflation remains within target levels protects the value of money and public confidence.
Financial Stability and Regulation – Central banks oversee financial institutions to prevent systemic crises.
Foreign Exchange Management – They manage exchange rates, foreign reserves, and currency interventions.
Lender of Last Resort – During financial distress, central banks provide emergency liquidity to banks and financial institutions.
Economic Growth Promotion – By influencing credit availability and investment, central banks indirectly promote growth and employment.
In theory, these functions are carried out independently from political or external influences. However, in the era of globalized finance, maintaining such independence has become increasingly difficult.
2. The Global Financial System and Its Influence
The global financial system is a web of interconnected markets and institutions, including international banks, hedge funds, multinational corporations, and supranational organizations such as the International Monetary Fund (IMF) and World Bank. It is characterized by:
Cross-border capital flows
Global investment funds and currency trading
Interconnected banking networks
International debt and credit markets
Global rating agencies and financial intermediaries
These elements create a financial ecosystem in which no central bank can act in isolation. The decisions made by one major central bank—particularly the U.S. Federal Reserve—can ripple across the globe, influencing exchange rates, asset prices, and borrowing costs in multiple countries.
3. The U.S. Federal Reserve’s Global Dominance
The U.S. dollar is the world’s primary reserve currency, accounting for nearly 60% of global reserves and the majority of international trade settlements. As a result, the Federal Reserve (Fed) exerts substantial indirect control over global financial conditions.
When the Fed changes its interest rates or monetary policy stance, the effects are immediate and widespread:
Emerging markets experience capital inflows or outflows based on the attractiveness of U.S. yields.
Currency values fluctuate as investors shift between the dollar and other currencies.
Global borrowing costs rise or fall depending on U.S. Treasury yields.
For example, the 2013 "Taper Tantrum" occurred when the Fed announced it would reduce its quantitative easing program. This led to a massive outflow of capital from emerging markets, causing currency depreciation and market volatility worldwide. Central banks in countries like India, Brazil, and Indonesia were forced to raise interest rates or intervene in currency markets to stabilize their economies.
Thus, while national central banks manage their domestic economies, their room for maneuver is constrained by decisions made in Washington.
4. The Role of the IMF and World Bank
Institutions such as the International Monetary Fund (IMF) and the World Bank play a central role in influencing the monetary policies of developing and emerging nations. While these institutions provide financial assistance and development loans, their programs often come with policy conditionalities.
For instance, countries seeking IMF loans during balance-of-payment crises are required to implement austerity measures, fiscal discipline, and structural reforms, which often restrict the central bank’s ability to conduct independent monetary policy.
Examples include:
The Asian Financial Crisis (1997–1998), where IMF intervention imposed tight monetary and fiscal controls on countries like Thailand, Indonesia, and South Korea.
Latin American debt crises of the 1980s, where IMF programs demanded strict monetary policies and privatization measures.
Such conditions reflect how global financial institutions can indirectly control the policy framework of central banks, particularly in financially vulnerable nations.
5. Global Capital Flows and Market Pressures
Modern financial markets operate on a 24-hour global cycle, with trillions of dollars moving across borders daily. These massive flows of “hot money” can destabilize currencies and bond markets, forcing central banks to adjust their policies even if they conflict with domestic economic needs.
For instance:
A sudden capital outflow can devalue a country’s currency, raise import costs, and fuel inflation.
To counter this, the central bank may need to raise interest rates, which can slow economic growth.
Conversely, large capital inflows can create asset bubbles and inflationary pressures, requiring monetary tightening.
In this sense, global financial markets act as a disciplinary mechanism, rewarding or punishing central banks based on their policies. Nations with high fiscal deficits or loose monetary policies often face downward pressure on their currency or increased borrowing costs in global bond markets.
6. Exchange Rate Systems and Dependence
Exchange rate management is another area where global finance limits central bank independence. Most countries today operate under floating exchange rates, meaning their currency value is determined by market forces. However, even floating currencies are vulnerable to speculative attacks and global shocks.
Countries that peg their currency to the dollar or euro must align their monetary policies with the anchor currency’s central bank, effectively surrendering policy control.
For example, countries in the Eurozone have ceded national control to the European Central Bank (ECB), which sets a unified monetary policy for 20 diverse economies.
Similarly, economies with dollar pegs, like Hong Kong or Saudi Arabia, must follow U.S. interest rate trends to maintain currency stability.
Thus, through exchange rate mechanisms, global finance exerts control over domestic policy decisions.
7. The Power of Global Financial Institutions and Rating Agencies
Global credit rating agencies such as Moody’s, Standard & Poor’s, and Fitch Ratings have significant influence on national monetary conditions. A downgrade in a country’s sovereign rating can lead to higher borrowing costs, reduced investor confidence, and currency depreciation.
Central banks must often take preemptive actions—such as tightening monetary policy or maintaining high reserves—to maintain favorable credit ratings. This dependence on external validation further diminishes true policy autonomy.
Similarly, international investment banks and hedge funds influence global liquidity conditions. Their collective actions can amplify or counteract central bank policies, shaping market expectations and financial stability.
8. The Challenge of Central Bank Independence
Central bank independence is designed to prevent political interference and maintain policy credibility. However, true independence is a relative concept. Central banks must balance domestic economic objectives with global realities, including:
Exchange rate volatility
Global interest rate movements
Commodity price fluctuations
Investor sentiment and risk appetite
For smaller or developing economies, these external pressures can severely constrain policy options. Even advanced economies are not immune—consider the European Central Bank, which must balance the interests of both strong economies like Germany and weaker ones like Greece or Italy.
9. Global Crises and Central Bank Coordination
During periods of global crisis, such as the 2008 Global Financial Crisis or the COVID-19 pandemic, central banks often act in coordination. The Federal Reserve, ECB, Bank of Japan, and others engaged in synchronized interest rate cuts and quantitative easing programs to inject liquidity into global markets.
While such cooperation stabilized financial systems, it also highlighted the growing interdependence of global central banks. The Fed’s swap lines—temporary currency exchanges with other central banks—became essential tools to ensure global dollar liquidity, reinforcing U.S. dominance over international finance.
This global coordination is beneficial during crises but underscores the reality that national policies are now part of a global financial ecosystem dominated by major economies and institutions.
10. The Digital Era and Future of Central Banking
The rise of digital currencies, blockchain technology, and decentralized finance (DeFi) introduces new challenges to central banks’ control. Central Bank Digital Currencies (CBDCs) are being developed to maintain monetary sovereignty in an era of financial globalization.
However, even with digital innovation, global finance remains interconnected. A digital dollar or euro could enhance the global influence of their respective central banks, while smaller nations could find their financial systems further marginalized.
11. Implications for Developing Economies
For developing nations, dependence on foreign investment, external debt, and imported inflation makes them particularly vulnerable to global financial forces. When major central banks tighten policy, capital flows reverse, currencies weaken, and debt servicing costs rise.
This “financial dependency” limits the ability of central banks in emerging markets to pursue independent monetary policy. The solution often lies in:
Strengthening domestic financial markets
Diversifying reserves
Promoting local currency settlements
Building policy credibility and transparency
Such measures can help shield national economies from excessive global influence.
Conclusion
Central banks were originally established to safeguard national monetary stability, but in the 21st century, their independence is constrained by the immense power of global finance. International capital flows, financial institutions, rating agencies, and dominant currencies—especially the U.S. dollar—shape the policy space available to even the most powerful central banks.
Global financial control is not always direct or conspiratorial—it operates through market mechanisms, investor sentiment, and institutional interdependence. The challenge for modern central banks is to balance national economic priorities with global financial realities.
In an increasingly integrated world, complete autonomy is impossible. Yet, by fostering transparency, coordination, and prudent macroeconomic management, central banks can navigate these global pressures effectively. The key lies not in resisting globalization but in managing interdependence wisely, ensuring that the pursuit of global stability does not come at the expense of national sovereignty and economic justice.

Investors, Traders, and Policy Makers in the World MarketImportance and Difference.
Introduction
The global financial market is an intricate ecosystem where capital flows seamlessly across borders, industries, and sectors. Within this ecosystem, three fundamental participants play distinct yet interconnected roles — investors, traders, and policy makers. Each group contributes to the market’s structure, functioning, and stability in different ways.
Investors provide the long-term capital necessary for growth and innovation; traders ensure market liquidity and efficiency through short-term operations; and policy makers establish the regulatory and economic framework that governs both.
Understanding their importance and differences is essential for comprehending how the world market operates and responds to global financial dynamics.
1. Role and Importance of Investors
1.1 Who are Investors?
Investors are individuals or institutions that allocate capital to assets such as stocks, bonds, mutual funds, real estate, or startups with the expectation of earning long-term returns. Unlike traders, who focus on short-term market fluctuations, investors emphasize fundamental value and sustainability.
Investors can be categorized into:
Retail investors – individual participants investing personal funds.
Institutional investors – entities such as pension funds, insurance companies, mutual funds, and sovereign wealth funds managing large capital pools.
1.2 Importance of Investors in the Global Market
Capital Formation:
Investors are the backbone of economic growth. Their funds are used by corporations for expansion, innovation, and employment generation. When investors purchase shares or bonds, they provide the necessary capital for companies to operate and expand.
Long-term Stability:
Investors bring stability to the market through their long-term orientation. Unlike traders, they are less influenced by daily market volatility, ensuring that companies have a reliable source of capital even during uncertain times.
Corporate Governance:
Institutional investors often influence corporate governance by voting on important issues, promoting transparency, ethical conduct, and accountability. This oversight helps maintain investor confidence in global markets.
Economic Growth and Development:
By channeling savings into productive investments, investors drive infrastructure development, technological advancement, and job creation. Their confidence can determine the economic trajectory of entire nations.
Wealth Creation:
Investors benefit from dividends, interest, and capital appreciation, which enhances individual and institutional wealth. This wealth accumulation fuels consumption and savings, further stimulating the economy.
2. Role and Importance of Traders
2.1 Who are Traders?
Traders are market participants who buy and sell financial instruments — such as equities, commodities, currencies, or derivatives — to profit from short-term price movements. Their approach is usually technical, relying on charts, patterns, and market sentiment rather than long-term fundamentals.
Traders can be classified as:
Day traders: Execute multiple trades within a single day.
Swing traders: Hold positions for days or weeks.
Arbitrage traders: Exploit price differences across markets.
Algorithmic or high-frequency traders: Use computer algorithms to execute rapid trades.
2.2 Importance of Traders in the Global Market
Market Liquidity:
Traders enhance liquidity by constantly buying and selling assets, ensuring that other market participants can enter or exit positions easily. A liquid market reduces transaction costs and improves efficiency.
Price Discovery:
Through continuous trading activity, traders help establish fair market prices. Their collective actions reflect real-time market sentiment, economic data, and investor expectations, making markets more transparent.
Market Efficiency:
Traders exploit inefficiencies and arbitrage opportunities, which helps align prices with intrinsic value. This process of correcting mispriced assets contributes to overall market efficiency.
Risk Management and Hedging:
Traders also play a role in managing financial risks through derivative instruments. For instance, commodity traders help producers hedge against price volatility in oil, metals, or agricultural goods.
Economic Signaling:
The behavior of traders can act as a signal of market health. Sharp price movements or heavy trading volumes often indicate changes in investor sentiment, guiding policy makers and long-term investors in their decisions.
3. Role and Importance of Policy Makers
3.1 Who are Policy Makers?
Policy makers are government officials, central banks, and regulatory authorities responsible for shaping the financial, monetary, and fiscal policies that govern the global market. Their actions influence interest rates, inflation, exchange rates, taxation, and capital flow regulations.
Key examples include:
Central Banks (like the U.S. Federal Reserve, European Central Bank, Reserve Bank of India)
Financial Regulators (like SEBI, SEC, FCA)
Government Ministries and Economic Councils
3.2 Importance of Policy Makers in the Global Market
Economic Stability:
Policy makers ensure macroeconomic stability through monetary and fiscal policies. By adjusting interest rates and money supply, central banks can control inflation, manage unemployment, and stabilize currencies.
Regulation and Oversight:
Regulatory bodies protect investors and maintain market integrity by enforcing laws against fraud, insider trading, and market manipulation. Effective regulation enhances investor confidence and market credibility.
Crisis Management:
During financial crises, policy makers implement interventions such as bailouts, stimulus packages, or liquidity support to prevent systemic collapse. For example, central banks’ coordinated actions during the 2008 crisis prevented a global depression.
Trade and Capital Flow Management:
Policy makers influence global trade through tariffs, exchange rate policies, and cross-border investment regulations. Their decisions can encourage or restrict foreign investment and affect global capital mobility.
Long-term Economic Planning:
Governments design long-term economic strategies to promote sustainable development, technological innovation, and social welfare, ensuring that the market supports inclusive growth.
4. Interrelationship Between the Three Groups
Although their goals and methods differ, investors, traders, and policy makers are interdependent within the world market:
Investors and Traders:
Traders provide liquidity that allows investors to buy or sell assets without major price disruptions. Meanwhile, investors create long-term value that traders can speculate on in the short term.
Traders and Policy Makers:
Traders respond immediately to policy announcements — such as interest rate changes or fiscal packages — influencing market volatility. Policy makers, in turn, observe trader behavior as a barometer for market sentiment.
Investors and Policy Makers:
Investors rely on stable and predictable policies to make long-term decisions. Conversely, governments depend on investor confidence to finance public debt and stimulate economic growth.
This cyclical relationship ensures that each participant supports the other, maintaining balance within the global financial ecosystem.
5. Global Examples and Case Studies
2008 Financial Crisis:
The crisis highlighted how interconnected these three groups are. Excessive risk-taking by traders and institutions led to a collapse in investor confidence, prompting massive interventions by policy makers through quantitative easing and stimulus measures.
COVID-19 Pandemic (2020):
During the pandemic, investors sought safe assets, traders reacted to volatility, and policy makers injected liquidity and cut interest rates to stabilize economies. The coordinated response prevented a deeper global recession.
Inflation Control by Central Banks (2022–2023):
Central banks worldwide raised interest rates to combat inflation. Traders responded with shifts in bond and currency markets, while investors adjusted portfolios toward defensive assets, showing the dynamic interplay between all three.
6. Challenges Faced by Each Group
Investors: Face risks from inflation, policy uncertainty, and geopolitical tensions. Their challenge lies in maintaining returns amid market volatility.
Traders: Confront high competition, algorithmic dominance, and unpredictable market swings. Risk management and speed are critical to survival.
Policy Makers: Must balance economic growth with financial stability while avoiding overregulation or political interference. Global coordination remains a persistent challenge.
7. The Future of Their Roles in the Global Market
The future of the world market will be shaped by technology, globalization, and sustainability.
Investors are increasingly prioritizing ESG (Environmental, Social, Governance) principles.
Traders are adopting AI-driven and algorithmic systems to enhance speed and accuracy.
Policy Makers are developing frameworks for digital currencies, blockchain regulation, and climate finance.
This evolution will demand greater cooperation among all three to ensure inclusive and resilient global markets.
8. Conclusion
The global financial market is a dynamic system where investors, traders, and policy makers each play indispensable roles. Investors provide long-term capital and stability; traders inject liquidity and efficiency; and policy makers maintain order and economic balance.
Their interactions create a complex yet balanced ecosystem that fuels global economic growth, innovation, and development. Recognizing the distinctions and synergies among these three groups helps one appreciate the mechanisms that sustain the world market and the challenges that lie ahead in maintaining its stability and inclusiveness.

Dow Theory – A Compass to Help Traders Read Market TrendsHello everyone,
While Fibonacci, Trendlines, or Price Action can help you find precise entry points, nothing is more fundamental and reliable for understanding the market’s overall movement than Dow Theory . This isn’t an obscure or overly academic concept—it’s very practical. In fact, it underpins most of the trend-following strategies that traders use today.
Whether you trade Forex, Gold, Stocks, or Crypto, the core question remains the same: Is the market trending up, trending down, or just in a temporary correction? If you can’t answer this, all other technical analyses become meaningless. That’s why Dow Theory was developed—to serve as a compass, helping traders grasp the trend and make precise decisions.
Applying Dow Theory in Trading
The key to using Dow isn’t memorizing its principles; it’s about reading the real market and turning insights into action. When combined with tools like EMA and MACD , the market picture becomes much clearer: EMA shows the direction and momentum of price, while MACD alerts you to potential reversals.
For example, when prices are rising and EMA is pointing up, a MACD crossover or divergence signals a potential entry along the trend. At the same time, watching price patterns such as Head & Shoulders or Double Top/Bottom helps you anticipate trend reversals, avoiding false moves and short-term traps.
Of course, all these tools only work effectively if you manage your risk carefully , set Stop Loss levels based on price structure, and risk only a small portion of your account per trade. Dow reminds us that a trend continues until there’s a clear reversal signal, so don’t fight the market just because of a few opposing candles.
Once you grasp this principle, reading charts , identifying trends , and trading with the flow of money becomes natural and precise, without guesswork. More importantly, you’ll know when to stay out to preserve capital and when to step in to maximize profits.
That’s why Dow Theory remains a solid foundation for any trader looking to trade with the trend, whether in Forex, Gold, Stocks, or Crypto. So, are you ready to catch the market waves with Dow and capitalize on every swing?
Market Regimes: What they are and why they matterRegimens, what are they and why they matter?
Most traders, especially new ones, don’t understand trading regimens. This is actually normal. Even as a quant based trader with higher education in stats/sciences, I learned of Regimen trading later in my trading career, having successfully navigated trading without it; but insurmountably improving things when I discovered it.
What is a regimen you may ask? Is it what’s going on in North Korea? Or even the USA?
Chances are, most people may think regime is synonymous with something like fascism or some ultra political significance, but the truth is regime can mean a few things, and I think its important, before getting into the real details, to first understand the meaning of regime.
The Meriam-Webster dictionary defines regime as:
regular pattern of occurrence or action (as of seasonal rainfall)
the characteristic behavior or orderly procedure of a natural phenomenon or process
mode of rule or management a government in power
a form of government
a government in power
a period of rule
If you were to do a grad school ‘ concept analysis’ on regime, you would get some interesting findings of regime. Essentially, all of these definitions have a significance/underlying overlap in meaning. The simplified meaning? I would say (without having done an actual concept analysis), a regime is a “pattern of behaviour / rules / government that forms repeating characteristics that can be measured and predicted against its previous characteristics”.
Still too complex? Let’s simplify with both political and scientific examples.
Political
In the current presidency in the U.S., the Republican party was swift to implement sweeping tariffs against international trade partners, blanketing entire continents in a matter of days with tariffs. These were then paused, resumed, paused, resumed, lowered, raised, lowered, raised, paused, resumed, revoked, resumed, lowered, raised, etc.
Under the current political regime, we can identify the behaviour of “tariff implementation”. From previous tariff implementation and revocation and adjustment, we have the characteristics of this regime. We can then use these characteristics to predict future outcomes under this regime, i.e. we would hypothesize “Tariffs will be paused within the coming 2 months”. We can say this because this is a characteristic of the current regime. In fact, the term TACO is a perfect example of repeating regime characteristics!
What about a scientific example?
Well we can draw on Meriam-Webster making reference to seasonal rainfall. In climatology, a " rainfall regime " refers to the characteristic pattern of precipitation over a region during the year—especially its timing, intensity, and variability across seasons. Identifying these regimes are pivotal to forecasting future meteorological and climatological events!
What about my field? Epidemiology and Biostatistics?
In Epi, we have multiple different regimes, such as:
Treatment Regime: A prescribed course of medical therapy, such as a drug regimen for tuberculosis or chemotherapy for cancer. It includes dosage, timing, and duration.
Vaccination Regime: A schedule of immunizations designed to prevent disease outbreaks—e.g., two-dose mRNA COVID-19 vaccine regime followed by boosters.
Control Regime: A set of public health policies or containment strategies—like quarantine protocols, mask mandates, or vector control in malaria-endemic areas.
Surveillance Regime: The systematic collection and analysis of health data to monitor disease trends—e.g., wastewater surveillance for poliovirus or syndromic surveillance for flu-like illness.
These all matter because these regimes dictate future characteristics/outcomes.
Great! Now that you have an idea of what a regime means, let’s talk about regimes in trading.
If you haven’t already guessed, there obviously exists “ market regime s”. These are, more or less, defined as “a distinct period characterized by specific patterns in market behavior—such as trends, volatility, and macroeconomic conditions—that influence investment strategies and risk management. ”
If you look back to our examples, you can begin to imagine why regimes matter. Remember, TACO! Previous behaviour dictates future characteristics. Once you understand the way or median in which some phenomena operates, you can use these characteristics to predict future characteristics.
If you wanted to dissect market regimes, it could get relatively involved and complex. For example, things such as:
Seasonality,
Momentum,
Mean Reversion,
Financial / economic stability
Geopolitical stability
These can all influence market regimes in their own way and can, in fact, be standalone market regimes. If you trade seasonality, you are trading “ seasonal regimes ”.
Momentum and Mean reversion are independent regimes of themselves (more on that shortly).
If you trade fundamentals, you will be trading economic and geopolitical regimes.
But which is correct? Not all regimes can exist at the same time, correct?
Yes and no! Regimes can momentarily shift and flip into a different one. Take, for example, the U.S. implementation of Tariff’s at the beginning of 2025. The initial blanket tariffs caused a mean reversion regime fueled by financial/economic and geopolitical stability. We had 3 regimes working together for the result, which was ultimately a mean reversion. This quickly shifted from a mean reversion regime to a momentum based regime (more on this shortly).
So, yes, we can, theoretically, have more than one regime simultaneously. However, when it comes to markets, and this is where you are in luck, its actually pretty easy! Markets tend to be either:
Mean reverting; or
Momentum based.
And that’s really that. Those are the only 2 regimes you will ever truly need to pay attention to, which will give you a better edge at trading. Seasonality, financial and geopolitical stability will either augment mean reversion or momentum, but generally are not independent regimes in and of themselves.
In the end, markets either go up, down or sideways. It can be driven by broader contexts, but in the end the up/down/sideways is driven by a predominate regimen;
Down markets: usually mean reverting.
Up markets: usually momentum.
Sideways markets: usually mean reverting with occasional momentum deviations.
If you want to learn more about the evolution of the market, you can check out my post about how the market has evolved into its current regime here:
Now, let the real fun begin and let’s talk about how to correctly trade based on the current regime!
There are some steps, first one must:
Identify the current regime concretely.
Apply the correct strategies that are compatible with the current regime.
Understand the momentum, mean reversion paradox
I will walk you through how to do this step by step.
Identifying the Current Regime Concretely
The easiest way to identify the current regime is by using Hurst Exponent.
The Hurst exponent is a number between 0 and 1 that tells you how predictable a time series is—like stock prices or rainfall.
If it's close to 0, the data is very random and tends to switch directions often.
If it's around 0.5, the data behaves like a random walk—no clear trend.
If it's close to 1, the data shows strong trends and tends to keep moving in the same direction.
So, it helps you measure persistence vs. randomness in patterns over time. The closer to 1 the more “persistent” the market is said to be. Persistence is basically the math equivalent of momentum. If a market is persistent, it will tend to trend with momentum.
The closer to 0 the more random the market is said to be . Randomness usually favours “mean reversion”
For simplicity, if you get a Hurst Exponent > 0.5, you are likely in a momentum regime. If < 0.5, you are likely in a mean reversion regime.
Let’s take a look at some examples using QuantNomad’s Hurt Exponent indicator ( available here ):
This is just before the crash in February 2025. We can see that up here, the Hurst Exponent was < 0.5, indicating a mean reversion preference. And indeed, the market ended up mean
reverting back to its quadratic mean (481) with the crash.
Then let’s see what happened:
After the crash, we can see that the Hurst Exponent was consistently > 0.5, indicating persistence in the market, i.e. trendy and momentum based.
Remember, as a rule of thumb, momentum markets generally faour upside and mean reverting tend to be downside favouring. If we narrow the regime to smaller timeframe regimes, you can see this phenomenon quite easily. Let’s look at SPY on a bearish day and bullish day against the Hurst Exponent:
We can see that on this bull trend day, Momentum and persistence reigned dominate. Hurst did not drop below 0.5, at least not for long, which indicated a persistent trend that was momentum driven.
Now a bearish day:
You can see on this bear trend day that Hurst stayed below 0.5 persistently, indicating mean reverting behaviour.
This also highlights how lower timeframes can have independent and day to day regimes, but its always important and critical to pay attention to the major regime a market is in on the larger timeframe.
Applying Correct Strategies
Depending on the regime, you MUST tailor your strategy to match the regime. If you are trading a mean reverting regime, oscillators like RSI and Stochastics aren’t going to work well. If you are trading a momentum regime with high persistence, mean reverting strategies like Bollinger Bands and Z-Score are not going to work.
As a rule of thumb, when Hurst is > 0.5, you want oscillator based strategies such as RSI, Stochastics, etc.
One indicator that I would recommend in momentum based regimes is my own, Momentum Probability Oscillator indicator ( available here ). This indicator operationalizes probability/sentiment through momentum metrics instead of mean reversion metrics. Let’s take a look at some examples:
In this example on the hourly timeframe for SPY, you can see that momentum is lost (signified by the oscillator falling below the yellow line) indicating that the likely outcome will be selling, this is shown by the pink arrows.
In this next example, we can see where momentum is reclaimed and the bias shifts to upside.
Because this indicator quantifies momentum probabilistically, it does well in momentum based, persistent regimes to identify strong trends and pullback of trends.
In reality, you can use any oscillator in a momentum based, persistent regime, but obviously I am biased to my own creations.
What about a mean reverting regimen?
If we are in a mean reverting regime, your best indicators to use are Bollinger Bands or, my favourite, the Z-Score probability indicator (by yours truly) available here .
Let’s use $NYSE:IRDM as our mean reverting example
In this image, the red arrow marks the transition to a mean reverting regime. So what do we use here? Well let’s take a look at the Z-Score probability indicator:
The red lines mark the transition to a mean reversion based regime. At the time of this transition, IRDM was oversold based on the Z-Score probability. We can see it in fact rallied back up to a z-score of 0 (mean reversion) before rejecting back down from the 0.
This is incredibly powerful, as the Hurst Exponent tells you that you can trust a reversion back to a mean!
Let’s try a smaller, intraday example, going back to SPY:
This day, SPY looked pretty bullish; however, the Hurst Exponent was consistently below 0.5 indicating mean reversion.
If we applied the Z-Score probability indicator:
I flipped the indicator to use Candles so you can more easily see the mean reversion behaviour. SPY goes to either extremes and always mean reverts back to 0, at times even consolidating in the mean reversion range.
And Bollinger bands:
If we look at a momentum driven day:
We can see that there is a skew or bias to one side of the average. The z-score is all over the map with no real expansion within the average range and infrequent and sporadic reversions that come more from extensive consolidation rather than actual mean reversion.
The indicator isn’t unusable in momentum based trading, but its not ideal. If we flip this same chart to the momentum probability oscillator we can see a stark difference in utility:
You can see the trend is using the full range of the oscillator and there is clear bounces at lower range and rejections at higher range with frequent “mean reversion” of the oscillator momentum based mean.
Now finally, the last section:
The Momentum Mean Reversion Paradox
This is, obviously, a self made up term. However, this is a phenomenon that will happen in corrective environments, where a mean reversion is so substantial, it becomes augmented by momentum itself.
What does this mean? It means that, despite the market actually mean reverting, the Hurst exponent flips to > 0.5, as the market is “persistently bearish”.
We can see this if we flip back to our $NYSE:IRDM example:
Here, we can see despite IRDM selling, the Hurst Exponent is incredibly trendy, with a really high value of > 0.55. Yet, despite this, the ticker continues down. This is the hallmark of a correction.
This is incredibly important and I really would advise you to mark this down and remember this. You can actually tell that something is “correcting” using this exact approach. When Hurst > 0.5 and the trend is down, this is the hallmark of a TRUE correction. No speculation needed!
Statistics is the best, I’m telling you.
Let’s look at the SPY crash of 2025:
During the SPY crash of 2025, the Hurst flipped to > 0.5, with a max of 0.57 indicating a hugely persistent trend. This means that this was a strong correction for SPY, flipping from a Hurst of < 0.5 to a Hurst of > 0.5 with a strong downtrend.
Crashes tend to happen abruptly without such transitions. For example, if we look at the COVID crash:
Theoretically Hurst warned us in advance that SPY was entering mean reversion territory, but when it actually happened, it happened so fast, Hurst never truly converted from mean reversion to trending. It was just a jumbled mess. This is the hallmark of a crash.
Concluding Remarks
And now, my friends, you know all there is to know about how to identify market regimes! Understanding these concepts will put your eons ahead of the average trader and allow you to select the correct tools and actually understand what the market is doing and when its gearing up for some corrections/mean reversions.
This is a long post, I will leave it there, but I really hope you learned something from this and will take some of the key points away!
Thanks for reading and as always, safe trades!
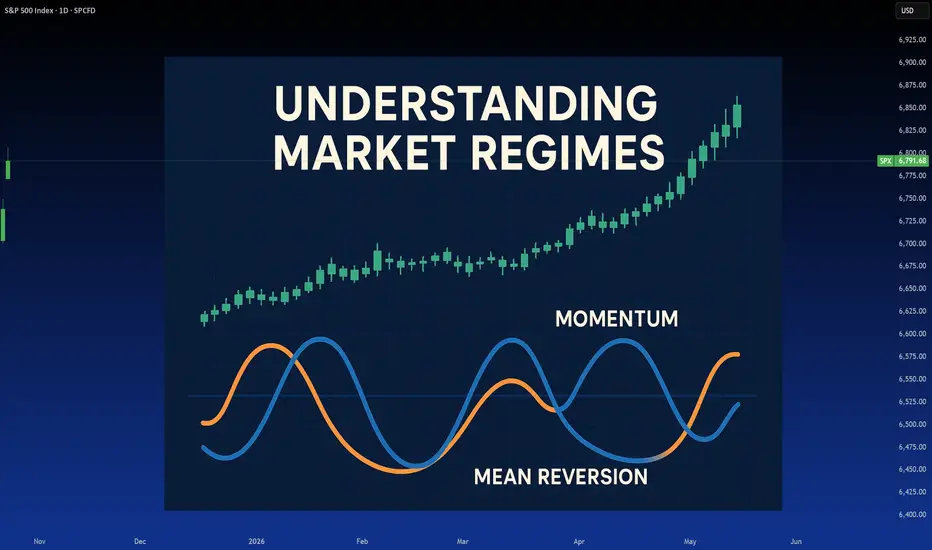
The Market Doesn’t Hate You — It’s Just Doing Its JobEvery trader at some point feels attacked by the market.
You take a trade, it hits your stop loss by one pip… and then runs perfectly in your direction.
You think, “The market is against me.”
But the truth is — the market doesn’t hate you.
It’s simply doing its job: collecting liquidity before moving to its real destination.
💡 Here’s What’s Really Happening
The market is a liquidity machine.
It moves where money is resting — not where traders wish it would go.
When you see price sweeping highs or lows before reversing, that’s not manipulation against you —
it’s Smart Money doing what it’s built to do:
Hunt liquidity
Fill institutional orders
Create displacement before the next move
Your stop loss isn’t being targeted personally —
it’s sitting where millions of other traders’ stops are clustered.
The market simply clears those levels before delivering the real move.
🧠 The Lesson
Stop trading emotionally and start thinking structurally.
Ask yourself before every setup:
Where is liquidity resting?
Has the market collected it yet?
Is structure confirming the new direction?
When you learn to think like Smart Money, you stop blaming the market and start understanding it.
You’ll realize every loss was a lesson pointing you toward better timing, discipline, and patience.
📊 Final Thought
The market is not your enemy — it’s your teacher.
Once you align with how liquidity and structure truly work,
you’ll stop feeling trapped and start trading with clarity and confidence.
💬 Follow for more institutional-based educational posts.
No signals. No hype.
Just pure trading knowledge and Smart Money insights that help you grow.

the WY of Honeywell's Earnings Report Gap up and Run down It is very important that you understand what is happening in a company that impacts its stock price. HON has had Dark Pool Rotation going on since July of this year. Dark Pools are the most informed of all the Market Participant groups (there are 12 not 2).
The chart of HON has plenty of information that provides an understanding of why the stock ran down this morning. Late retail buyers may push price up if they buy on the dip which is not a dip and it is not profit taking either.
HFTs were the trigger for HON to gap up at open. Smaller funds were the drivers of price upward. HFTs sold quickly. Pro Traders who were in with the HFTs took profits end of day as is their custom. Today is a surprise for many retail day traders as the stock is running down early this morning.
This is smaller funds who want to off load their shares of HON selling into the previous day's speculative trading.
Who controls price today? Smaller funds.

Causes of Global CrashesEconomic, Political, and Psychological Factors.
Global financial crashes have been recurring phenomena throughout modern economic history. From the Great Depression of 1929, the Dot-Com Bubble of 2000, the Global Financial Crisis of 2008, to the COVID-19 market crash of 2020, each episode has revealed vulnerabilities in the global financial system. Despite different triggers, all share underlying causes linked to economic imbalances, political decisions, and collective psychological behavior. Understanding these factors is crucial for policymakers, investors, and economists to anticipate and mitigate future crises.
1. Economic Factors: The Foundation of Market Instability
Economic factors form the backbone of most global crashes. They often arise from systemic imbalances, over-leverage, speculative bubbles, and policy missteps that distort market efficiency.
a) Asset Bubbles and Overvaluation
One of the most common precursors to a crash is the formation of asset bubbles—situations where asset prices rise far beyond their intrinsic value due to excessive speculation. Investors, driven by the belief that prices will continue to climb, pour money into overvalued assets. When reality strikes and prices begin to fall, panic selling ensues, leading to a sharp market correction.
Examples include:
The Dot-Com Bubble (2000): Exuberance over internet startups drove technology stocks to irrational valuations, with companies having minimal profits being valued in billions.
U.S. Housing Bubble (2008): Excessive lending and subprime mortgages inflated real estate prices until defaults triggered a collapse, spreading through global financial markets via securitized mortgage products.
These bubbles illustrate how the combination of easy credit, speculative mania, and weak regulation can inflate asset values to unsustainable levels.
b) Excessive Debt and Leverage
High levels of debt—whether by households, corporations, or governments—create systemic vulnerability. When asset prices fall, overleveraged entities struggle to meet obligations, leading to a chain reaction of defaults and bankruptcies. Leverage amplifies both gains and losses; thus, when confidence erodes, deleveraging occurs rapidly, deepening the crisis.
The 2008 Financial Crisis serves as a textbook example, where banks and financial institutions had high exposure to mortgage-backed securities financed through short-term debt. Once the housing market declined, the inability to refinance debt led to liquidity freezes and institutional failures such as Lehman Brothers.
c) Monetary Policy and Interest Rate Mismanagement
Central banks play a crucial role in maintaining economic stability. However, prolonged periods of low interest rates and quantitative easing can encourage speculative behavior and excessive borrowing. Conversely, sudden tightening of monetary policy can burst bubbles and reduce liquidity.
For instance:
The U.S. Federal Reserve’s tightening before the 1929 crash is believed to have reduced liquidity, accelerating the market collapse.
Similarly, the rate hikes of 2022–2023 to combat inflation led to a correction in tech stocks and cryptocurrencies that had benefited from years of cheap money.
d) Global Trade Imbalances
Trade imbalances between major economies—such as the U.S. and China—can lead to distortions in capital flows and currency valuations. Persistent current account deficits or surpluses create dependency and volatility. When these imbalances adjust abruptly, global financial markets experience turbulence, as seen during the Asian Financial Crisis of 1997, when capital flight led to currency collapses and regional recessions.
e) Banking System Fragility
Weak regulation, risky lending practices, and insufficient capital buffers make banking systems vulnerable. The interconnectedness of global finance means that the failure of one major institution can cascade across borders, as seen in 2008 when the collapse of Lehman Brothers triggered a global credit crunch.
2. Political Factors: The Role of Governance and Geopolitics
While economic indicators often signal a crash, political factors can act as both catalysts and amplifiers. Governments influence markets through fiscal policies, regulation, and geopolitical actions.
a) Policy Uncertainty and Mismanagement
Political instability and inconsistent economic policies create uncertainty that undermines investor confidence. Sudden tax reforms, nationalization, or trade restrictions can shock markets. For instance:
The Brexit referendum (2016) caused massive volatility in global markets due to uncertainty about trade and investment flows.
The U.S.-China trade war (2018–2019) disrupted global supply chains, leading to stock market fluctuations and slower growth.
In emerging markets, policy mismanagement, corruption, and lack of transparency can drive capital flight, devalue currencies, and cause inflationary spirals—factors often preceding financial crises.
b) Geopolitical Conflicts and Wars
Wars and geopolitical tensions disrupt trade routes, increase commodity prices, and trigger risk aversion in investors. The Russia-Ukraine war (2022), for instance, caused spikes in energy and food prices, contributing to global inflation and slowing growth. Similarly, the Oil Crisis of 1973—triggered by OPEC’s embargo—plunged Western economies into stagflation, demonstrating how political decisions in one region can create worldwide economic turmoil.
c) Regulatory Failures and Deregulation
Governments and financial regulators are tasked with maintaining market integrity. However, deregulation or lax oversight can allow risky practices to proliferate.
The U.S. financial deregulation in the 1980s and 1990s encouraged complex derivatives and speculative trading, setting the stage for the 2008 crash.
In developing economies, weak regulatory frameworks have allowed unmonitored capital inflows that later reversed abruptly, causing crises.
d) Globalization and Policy Interdependence
Globalization has tightly interlinked economies, but it also means that crises can spread faster. The collapse of one major economy now has ripple effects through trade, finance, and investment channels. When political decisions—like sanctions, tariffs, or capital controls—are implemented by major powers, they can unintentionally trigger market dislocations worldwide.
e) Fiscal Deficits and Unsustainable Public Debt
Governments running persistent fiscal deficits often resort to excessive borrowing. When investors lose confidence in a government’s ability to service its debt, bond yields rise sharply, leading to a debt crisis.
Examples include:
The Eurozone Sovereign Debt Crisis (2010–2012), where Greece, Spain, and Italy faced massive sell-offs in government bonds due to high debt-to-GDP ratios.
Argentina’s repeated debt defaults illustrate how fiscal indiscipline can repeatedly destabilize markets and economies.
3. Psychological Factors: The Human Element in Market Crashes
While economic and political factors lay the groundwork for crashes, psychology drives the timing and intensity of market collapses. Investor sentiment, herd behavior, and cognitive biases play central roles in shaping market dynamics.
a) Herd Behavior and Speculative Mania
Markets are not purely rational systems—they are deeply influenced by crowd psychology. When prices rise, investors fear missing out, leading to herd behavior where everyone buys simply because others are buying. This collective optimism inflates bubbles beyond fundamental values.
Historical examples include:
Tulip Mania (1637) in the Netherlands, where tulip bulbs sold for the price of houses before crashing overnight.
Bitcoin and crypto booms (2017 and 2021), where social media hype and retail participation drove valuations to extreme levels before sharp corrections.
b) Overconfidence and Illusion of Control
Investors often overestimate their ability to predict markets. During bull markets, this overconfidence bias leads to risk-taking and neglect of fundamentals. Financial analysts, fund managers, and even policymakers may believe “this time is different,” ignoring signs of overheating.
Before the 2008 crash, many economists and bankers genuinely believed that new financial innovations had made the system more resilient—an illusion that collapsed once subprime defaults surged.
c) Panic and Loss Aversion
Once asset prices start falling, fear takes over. Loss aversion, the psychological principle that people feel losses more intensely than gains, causes panic selling. The speed of modern digital trading and algorithmic systems amplifies this panic, leading to rapid market declines.
During the COVID-19 crash of March 2020, stock markets fell over 30% within weeks as investors rushed to liquidate positions amid uncertainty, demonstrating how fear can drive faster collapses than fundamentals alone would justify.
d) Media Influence and Narrative Contagion
Media and social networks can accelerate both optimism and fear. Positive stories during bubbles and alarmist headlines during downturns amplify collective emotions. Economist Robert Shiller’s concept of “narrative economics” highlights how viral stories—such as “housing prices never fall” or “AI will revolutionize everything”—fuel speculative behavior detached from reality.
e) Behavioral Finance and Feedback Loops
Modern behavioral finance explains how psychological feedback loops amplify volatility. Rising prices attract attention, which draws more investors, pushing prices even higher—a self-reinforcing cycle. When this reverses, selling pressure creates a downward spiral, often far exceeding what fundamentals justify.
4. Interconnection Between Economic, Political, and Psychological Forces
Global crashes rarely result from a single cause—they emerge from a complex interaction of economic misalignments, political actions, and psychological dynamics.
For instance:
The 2008 crisis combined excessive leverage (economic), weak regulation (political), and investor complacency (psychological).
The COVID-19 crash reflected a sudden geopolitical shock (pandemic response), economic slowdown, and psychological panic selling.
The Asian Financial Crisis (1997) arose from overborrowing (economic), weak policy responses (political), and investor herd behavior (psychological).
This interconnectedness makes prediction and prevention challenging, as policymakers must manage not only economic fundamentals but also public sentiment and political realities.
5. Lessons and Preventive Measures
To prevent or mitigate global crashes, lessons from past crises must be applied systematically:
Stronger Financial Regulation:
Transparent accounting, capital adequacy norms, and limits on leverage can reduce systemic risks.
Balanced Monetary Policy:
Central banks should avoid prolonged ultra-low interest rates that encourage asset bubbles, while managing liquidity during downturns.
International Coordination:
Global financial stability requires coordination among central banks, governments, and institutions like the IMF to manage cross-border capital flows and crises.
Investor Education and Behavioral Awareness:
Educating investors about cognitive biases, speculative risks, and market psychology can foster more rational decision-making.
Crisis Communication and Transparency:
Governments and regulators should maintain clear, transparent communication to prevent misinformation and panic during economic shocks.
Conclusion
Global crashes are inevitable episodes in the cyclical nature of financial markets, driven by a combination of economic imbalances, political misjudgments, and psychological dynamics. While the specific triggers may vary—be it a housing bubble, a war, or a pandemic—the underlying patterns remain strikingly similar. Understanding these causes not only helps explain past collapses but also equips policymakers and investors to build more resilient financial systems. Ultimately, preventing future crashes requires recognizing that markets are not just machines of numbers—they are reflections of human behavior, confidence, and collective decision-making in an ever-interconnected world.

Regional Growth Strategies in the Global MarketIntroduction
In today’s interconnected and competitive global economy, companies no longer limit themselves to their domestic markets. They pursue expansion into multiple regions to tap new consumer bases, access resources, reduce costs, and diversify risk. However, global expansion is not a one-size-fits-all process. Each region presents unique economic conditions, cultural nuances, regulatory systems, and consumer preferences. Hence, the concept of regional growth strategies has become vital — it focuses on tailoring global business operations to fit the specific dynamics of different geographic regions.
Regional growth strategies in the global market are structured plans that multinational corporations (MNCs) and emerging firms employ to achieve sustainable expansion, build competitive advantage, and secure long-term profitability in target regions. These strategies are influenced by several factors such as regional trade blocs, demographic trends, technology adoption, government policies, and local market behavior.
1. Understanding Regional Growth Strategies
A regional growth strategy refers to a business plan that integrates global objectives with localized approaches. It involves identifying and prioritizing high-potential regions, customizing products and marketing to suit local needs, and establishing operations or partnerships to gain a competitive edge. Companies use these strategies to adapt their business model to regional conditions while maintaining global consistency.
For instance:
McDonald’s adjusts its menu to suit local tastes — vegetarian options in India, teriyaki burgers in Japan, and halal-certified meat in Middle Eastern countries.
Apple Inc. tailors pricing and distribution strategies differently in North America, Europe, and Asia-Pacific regions due to varying consumer behavior and income levels.
Regional growth strategies allow global firms to balance global efficiency (standardization for cost savings) with local responsiveness (adaptation to local markets), a key principle in international business theory.
2. Importance of Regional Strategies in the Global Market
Globalization has made regional growth strategies more important than ever. Some key reasons include:
Economic Diversification:
Companies avoid dependence on a single market by spreading their operations across regions. Economic slowdowns in one area can be offset by growth in another.
Access to Emerging Markets:
Emerging economies such as India, Brazil, Indonesia, and Vietnam have become growth hubs. Regional strategies enable firms to target these areas with customized offerings.
Cultural and Consumer Adaptation:
Understanding local culture, traditions, and consumer psychology improves brand acceptance and customer loyalty.
Regulatory Compliance:
Different regions have varying legal frameworks and trade barriers. Regional planning ensures compliance and smooth market entry.
Supply Chain Optimization:
Locating production or sourcing closer to key markets helps reduce costs, manage risks, and improve operational efficiency.
Strategic Alliances and Regional Clusters:
Regional partnerships and innovation clusters (like Silicon Valley in the US or Shenzhen in China) help firms leverage local expertise and networks.
In essence, regional strategies are crucial for aligning business operations with the realities of global diversity.
3. Types of Regional Growth Strategies
Companies use several strategic models depending on their goals, industry, and market maturity. Below are some common types:
a. Market Penetration Strategy
This involves increasing the firm’s share in existing regional markets through aggressive marketing, competitive pricing, or improved distribution. It focuses on strengthening brand visibility and consumer loyalty.
b. Market Development Strategy
Here, firms enter new regional markets with existing products. For instance, a European apparel brand might expand to Latin America, adapting its offerings slightly to suit local preferences.
c. Product Localization Strategy
To succeed regionally, firms often customize products or services for local audiences. This can include language adaptation, design modifications, or even creating region-specific versions of products.
d. Strategic Alliances and Joint Ventures
Collaborating with regional partners provides access to local knowledge, regulatory support, and established customer bases. Toyota’s joint venture with China’s FAW Group is a notable example.
e. Regional Manufacturing and Supply Chain Strategy
Setting up production centers within or near target regions reduces logistical challenges, tariffs, and currency risks. Many technology companies have established hubs in Southeast Asia for this reason.
f. Mergers and Acquisitions (M&A)
Acquiring local firms allows quick entry and immediate access to established operations. For example, Walmart’s acquisition of Flipkart in India provided a strong foothold in the Indian e-commerce market.
g. Digital and E-commerce Expansion
Firms are increasingly using digital channels to reach regional markets cost-effectively. E-commerce platforms enable global brands to operate regionally without physical infrastructure.
4. Key Regional Growth Models Across Continents
1. North America
The North American market, led by the United States, offers advanced infrastructure, high consumer spending, and a stable regulatory environment. Companies focus on innovation-driven growth, brand differentiation, and digital transformation. For example, Tesla’s regional strategy involves expanding production across multiple states and developing localized supply chains for electric vehicles.
2. Europe
Europe is a complex but lucrative region due to the European Union’s single market framework. Regional strategies here emphasize sustainability, compliance with EU standards, and cultural diversity management. Many firms adopt green technologies and ethical business practices to align with European consumer values.
3. Asia-Pacific
Asia-Pacific (APAC) is the fastest-growing region globally. Its diverse economies — China, India, Japan, South Korea, and ASEAN nations — present both opportunities and challenges. Strategies here focus on mass customization, digital-first marketing, and regional production hubs. For instance, Samsung and Huawei leverage regional R&D centers to innovate products tailored for Asian consumers.
4. Latin America
Latin America’s regional strategy revolves around price-sensitive consumers, economic volatility, and political uncertainty. Firms often adopt localized pricing, distribution through regional partners, and community-based marketing to gain traction.
5. Middle East and Africa (MEA)
The MEA region offers vast opportunities due to its growing youth population, digital adoption, and natural resource wealth. However, it also poses regulatory and infrastructural challenges. Successful regional strategies here include partnerships with local conglomerates, adapting to religious and cultural norms, and investing in sustainable infrastructure.
5. Regional Trade Blocs and Their Strategic Impact
Trade agreements and economic blocs shape regional growth strategies significantly. Some key examples include:
European Union (EU): Facilitates tariff-free trade and uniform regulations across member countries, encouraging firms to set up pan-European operations.
North American Free Trade Agreement (NAFTA) (now USMCA): Promotes trade between the US, Canada, and Mexico, encouraging integrated manufacturing and cross-border supply chains.
Association of Southeast Asian Nations (ASEAN): Provides access to a large consumer market with reduced trade barriers.
Mercosur (South America): Enhances trade cooperation among Argentina, Brazil, Paraguay, and Uruguay.
African Continental Free Trade Area (AfCFTA): Aims to create a unified African market, attracting global investors.
Companies strategically align their regional operations to take advantage of these trade frameworks, optimizing cost structures and supply chain efficiency.
6. Challenges in Implementing Regional Growth Strategies
While regional expansion offers significant opportunities, it also presents challenges that businesses must manage carefully:
Regulatory Complexity:
Each region has its own legal requirements, taxation rules, and trade policies. Navigating these can be time-consuming and costly.
Cultural Barriers:
Misunderstanding local customs, values, or communication styles can lead to marketing failures and brand rejection.
Political Instability:
Regions with political volatility or weak governance pose risks to investment and operations.
Economic Inequality:
Income disparities within and across regions affect pricing strategies and product positioning.
Competition from Local Firms:
Domestic companies often understand the market better and can respond faster to changes.
Supply Chain Disruptions:
Global crises (like the COVID-19 pandemic) highlight the vulnerability of extended supply chains and the need for regional diversification.
7. Strategies for Successful Regional Growth
To ensure sustainable success, firms should follow structured approaches:
Market Research and Data Analytics:
Understanding regional demographics, purchasing patterns, and competitor behavior is crucial before entry.
Localization and Cultural Sensitivity:
Customizing marketing, communication, and product offerings to suit local tastes builds trust and engagement.
Strategic Partnerships:
Collaborating with regional firms, distributors, or technology partners enhances market penetration.
Agile Operations:
Adopting flexible supply chains and decentralized decision-making allows quick adaptation to local market shifts.
Talent and Leadership Development:
Hiring local management teams familiar with the regional context improves responsiveness.
Digital Transformation:
Leveraging digital tools, e-commerce, and regional analytics helps firms engage customers efficiently.
Sustainability and CSR Integration:
Consumers increasingly prefer brands that demonstrate responsibility toward regional communities and the environment.
8. Case Studies of Regional Growth Success
Coca-Cola
Coca-Cola’s success lies in its ability to think globally but act locally. The company customizes flavors, packaging, and advertising campaigns to reflect local cultures. For instance, in Japan, Coca-Cola offers unique beverages such as green tea and coffee blends under regional sub-brands.
Unilever
Unilever’s regional strategy combines global brand consistency with local product innovation. It invests heavily in emerging markets like India and Indonesia by offering affordable product sizes suited for lower-income groups while maintaining sustainability goals.
Toyota
Toyota uses a regional production model, setting up manufacturing hubs in key markets to serve local demand efficiently. Its “Kaizen” philosophy of continuous improvement is applied globally but adapted regionally to meet workforce and cultural variations.
Netflix
Netflix’s regional growth strategy focuses on content localization. By producing region-specific shows in local languages (like “Money Heist” in Spain or “Sacred Games” in India), it successfully appeals to diverse audiences worldwide.
9. The Future of Regional Growth Strategies
The future of regional strategies will be shaped by three key trends:
Digital and AI Integration:
Artificial intelligence will help companies analyze regional markets in real-time, personalize offerings, and automate regional operations.
Sustainability Focus:
Green technologies and responsible supply chains will be central to regional competitiveness.
Geopolitical Realignments:
Shifts in trade policies and alliances will redefine regional partnerships and market priorities.
Companies that can blend technology, sustainability, and local adaptation will dominate the next wave of global expansion.
Conclusion
Regional growth strategies are the foundation of successful global business expansion. They allow companies to bridge the gap between global ambition and local reality. By understanding regional markets, respecting cultural differences, and leveraging trade opportunities, firms can create value both for themselves and the communities they serve.
In the dynamic global marketplace, the most successful companies are those that master the art of local responsiveness within global integration. Regional strategies thus serve as the cornerstone of a truly globalized yet locally connected enterprise model — the essence of 21st-century business success.

Carry Trade Profits in the Global Market1. Understanding the Concept of Carry Trade
Carry trade refers to a financial strategy that exploits the difference in interest rates between two countries. Traders borrow funds in a low-yielding currency (called the funding currency) and invest them in a high-yielding currency (called the target currency). The profit from this strategy arises from the interest rate differential — known as the carry.
For instance, if Japan’s short-term interest rate is 0.1% and Australia’s is 4%, a trader can borrow in Japanese yen (JPY) and invest in Australian dollars (AUD). Theoretically, this generates a profit of 3.9% annually, assuming the exchange rate remains stable.
Carry trade profits are not merely theoretical; they are among the major drivers of cross-border capital movements and global liquidity. They depend heavily on macroeconomic stability, monetary policies, and risk appetite in the global market.
2. The Mechanism of Carry Trade
The process of executing a carry trade involves several steps:
Borrowing in the Low-Interest Currency:
Traders borrow funds in a currency where interest rates are minimal. Historically, currencies like the Japanese yen (JPY) and Swiss franc (CHF) have been popular funding currencies due to their ultra-low rates.
Converting and Investing in High-Yielding Assets:
The borrowed funds are converted into a high-yielding currency (such as the Australian dollar, New Zealand dollar, or Brazilian real) and invested in assets like government bonds, corporate debt, or even equities offering higher returns.
Earning the Interest Differential (Carry):
The profit is the difference between the interest paid on the borrowed currency and the interest earned on the invested currency.
Closing the Trade:
Eventually, the investor reverses the process—converting the investment back to the funding currency to repay the borrowed amount. If exchange rates have remained stable or moved favorably, profits are realized.
3. Historical Context and Examples
Carry trades have been instrumental in shaping financial markets over several decades:
Japanese Yen Carry Trade (1990s–2008):
After Japan’s economic bubble burst, the Bank of Japan cut interest rates to nearly zero. Investors borrowed cheap yen and invested in higher-yielding currencies like the U.S. dollar (USD), Australian dollar (AUD), and New Zealand dollar (NZD). This strategy thrived during periods of market stability, contributing to global asset bubbles before the 2008 financial crisis.
Swiss Franc Carry Trade:
The Swiss National Bank maintained low interest rates for years, making the franc an attractive funding currency. However, when the Swiss franc appreciated sharply in 2015 after the SNB removed its euro peg, many carry traders suffered significant losses.
Emerging Market Carry Trades:
Investors often exploit high interest rates in countries like Brazil, Turkey, South Africa, or India. For instance, borrowing in USD or JPY and investing in the Brazilian real (BRL) can yield high returns when emerging markets are stable.
4. The Role of Interest Rate Differentials
The heart of carry trading lies in interest rate differentials — the gap between the borrowing rate and the investment rate. Central bank policies significantly influence these differentials. When central banks like the Federal Reserve, European Central Bank (ECB), or Bank of Japan adjust their rates, global carry trade flows react instantly.
For example, if the U.S. Federal Reserve raises interest rates while Japan keeps them low, the USD becomes more attractive, potentially reversing yen carry trades. Traders must therefore monitor global monetary policies closely, as sudden shifts can either magnify profits or wipe them out.
5. Factors Affecting Carry Trade Profitability
Carry trade profits depend on multiple interconnected factors:
Exchange Rate Stability:
The biggest threat to carry trades is currency fluctuation. If the high-yielding currency depreciates against the funding currency, the losses from exchange rate movements can easily outweigh interest gains.
Interest Rate Differentials:
A widening differential boosts carry returns, while a narrowing one reduces profitability.
Risk Appetite and Market Sentiment:
Carry trades flourish during periods of global economic stability and investor optimism (risk-on environments). When fear or uncertainty rises (risk-off sentiment), traders rush to unwind carry positions, leading to sharp currency reversals.
Global Liquidity Conditions:
Easy monetary policies and quantitative easing increase global liquidity, encouraging carry trade activities. Conversely, tightening liquidity discourages such trades.
Geopolitical Risks:
Political instability, wars, or sanctions can disrupt currency markets, leading to unexpected volatility and losses.
6. Carry Trade and Exchange Rate Dynamics
Carry trading influences exchange rates globally. When investors borrow in a funding currency and invest in a high-yielding one, demand for the target currency increases, causing it to appreciate. This appreciation can reinforce returns in the short run. However, if markets suddenly turn risk-averse, the reverse occurs — massive unwinding of carry positions leads to depreciation of the target currency and appreciation of the funding currency, often triggering volatility spikes.
A notable example occurred during the 2008 global financial crisis, when investors unwound their yen-funded positions en masse, causing the yen to surge sharply while high-yielding currencies plunged.
7. Measuring Carry Trade Performance
Professional investors use several metrics to evaluate carry trade performance:
Interest Rate Differential (IRD):
The expected annual return from the interest rate gap between two currencies.
Forward Premium/Discount:
The difference between spot and forward exchange rates, reflecting market expectations.
Sharpe Ratio:
The risk-adjusted return measure used to assess the profitability of carry trades relative to volatility.
Uncovered Interest Rate Parity (UIP):
According to UIP, currency exchange rates adjust to offset interest rate differentials, meaning there should be no arbitrage profit. However, empirical evidence shows UIP often fails in reality — creating room for carry trade profits.
8. Benefits of Carry Trade
Attractive Yield Opportunities:
Investors can earn higher returns compared to traditional assets, especially when interest rate gaps are wide.
Portfolio Diversification:
Carry trades allow exposure to multiple currencies and economies, improving portfolio risk balance.
Liquidity and Leverage:
The forex market’s deep liquidity and access to leverage make carry trades easily executable and potentially highly profitable.
Macroeconomic Insights:
Understanding carry trades provides insights into global monetary policy trends, capital flows, and risk sentiment.
9. Risks and Challenges in Carry Trade
Despite its appeal, carry trade is inherently risky:
Exchange Rate Volatility:
Even small currency movements can nullify interest rate gains, especially with leverage.
Sudden Policy Shifts:
Central banks’ unexpected rate hikes or currency interventions can disrupt positions.
Liquidity Risk:
During crises, funding markets can freeze, making it difficult to close positions at favorable rates.
Crowded Trade Risk:
When too many traders hold similar carry positions, sudden reversals can amplify losses, as seen in the 2008 crisis.
Interest Rate Convergence:
Narrowing rate differentials can reduce profitability and make carry trades unattractive.
10. Modern Developments in Carry Trade
In recent years, technological and structural changes in financial markets have transformed carry trading:
Algorithmic and Quantitative Models:
Sophisticated algorithms now execute carry strategies using real-time macroeconomic data, optimizing entry and exit points.
ETFs and Derivative Products:
Exchange-traded funds (ETFs) and derivatives allow retail and institutional investors to gain exposure to carry trade returns without direct currency borrowing.
Emerging Market Focus:
Investors are increasingly targeting emerging economies offering high yields, though at the cost of higher volatility.
Impact of Global Rate Cycles:
The post-COVID monetary environment, characterized by aggressive rate hikes followed by normalization, has reshaped traditional carry trade opportunities.
11. Case Study: The Yen Carry Trade in the 2000s
Between 2003 and 2007, the yen carry trade became a dominant global phenomenon. Japan’s interest rates were near zero, while economies like Australia, New Zealand, and the U.S. offered higher yields. Investors borrowed trillions of yen to invest abroad, pushing global equity and commodity prices upward.
However, when the financial crisis hit in 2008, investors fled risky assets, causing a rapid unwinding of carry trades. The yen appreciated sharply against the dollar, and many investors suffered massive losses. This event demonstrated how carry trades can amplify both booms and busts in global markets.
12. The Future of Carry Trades
The profitability of carry trades in the modern global economy depends on several evolving dynamics:
Interest Rate Normalization:
As global central banks return to moderate interest rate levels, carry opportunities may reemerge, particularly between developed and emerging markets.
AI and Predictive Analytics:
Machine learning models are increasingly used to forecast exchange rate movements, improving carry trade timing.
Geopolitical and Inflationary Pressures:
Persistent geopolitical tensions, inflation, and deglobalization trends may increase currency volatility, posing new challenges for carry traders.
Green Finance and ESG Considerations:
Sustainable finance trends could influence capital allocation patterns, potentially affecting carry trade flows into emerging economies.
Conclusion
Carry trade remains one of the most powerful yet risky tools in global finance. Its allure stems from the ability to generate profits from simple interest rate differences — a concept that encapsulates the essence of international capital mobility. However, the strategy’s success depends on stable macroeconomic conditions, disciplined risk management, and accurate forecasting of currency dynamics.
In times of global stability and optimism, carry trades can deliver consistent profits and contribute to global liquidity. But in periods of uncertainty or crisis, they can reverse sharply, amplifying volatility and risk contagion. As the global economy continues to evolve through cycles of inflation, monetary tightening, and digital innovation, carry trade will remain a central, albeit double-edged, element of the international financial landscape.
Global IPO trends and SME listings1. Macro picture: why IPOs dipped and why they’re coming back
From the 2021 frenzy to the 2022–2024 slowdown, three macro forces depressed IPO supply: rising interest rates, equity market volatility, and geopolitical policy shocks (trade/tariff announcements, sanctions, etc.). Those same variables determine the timing and size of any recovery: when volatility eases and public valuations become predictable, IPO windows reopen. By H1–Q3 2025 many markets recorded year-on-year increases in IPO counts and proceeds compared with 2024, signalling a cautious but visible rebound in investor risk appetite and issuer confidence. Major advisory firms reported a stronger pipeline and bigger average deal sizes in 2025 versus the trough.
Key takeaways:
Market sentiment and index performance remain the gating factor. When broader indices are stable or rising, companies and underwriters are more willing to price primary offerings.
Policy shocks (tariffs, regulation) can cause abrupt freezes—as seen in mid-2025 in some reporting—so recovery is patchy and regionally uneven.
2. Regional patterns — Americas, Europe, Asia
Americas (US/Canada): The U.S. market led global deals by proceeds in 2025’s first half, helped by both traditional IPOs and a revival of SPACs. Institutional appetite for high-quality growth names returned gradually; Nasdaq and NYSE regained traction for tech and fintech issuers. PwC and market banks flagged strong H1 2025 proceeds in the Americas, albeit with SPACs making up a significant portion.
Europe: Activity recovered more slowly but steadily. European exchanges and advisors pointed to unused capacity—investor demand exists but issuers and banks are selective about timing and valuation. Several jurisdictions enhanced SME support programs and pre-IPO education to stimulate listings.
Asia-Pacific: The region showed resilience and, in parts, growth—China and Japan saw notable listings and larger offerings. India’s domestic platforms recorded strong SME listing activity (see below). Overall, regulatory facilitation and local investor depth helped Asia outperform other regions in some periods.
3. The SPAC story: back — but different
After the 2020–2021 SPAC boom and the 2022–2024 cooling (regulatory scrutiny and poor post-deSPAC performance), 2025 brought a measured SPAC reappearance. Sponsors and investors are more disciplined: fewer overly ambitious valuations, more sponsor skin in the game, and clearer disclosure/earnout structures. SPACs accounted for a materially higher share of listings in early-to-mid 2025 versus 2024, but they are operating with tighter governance and (in many cases) better alignment with private equity and institutional exit strategies. Analysts expect SPACs to feature as one option among many for sponsor exits rather than the overwhelmingly dominant vehicle they once were.
4. SME listings — scale, purpose and platforms
SME listing platforms have evolved from niche curiosities into mainstream capital-raising mechanisms for smaller growth companies. Exchanges tailor admission rules, disclosure requirements, and investor education for SMEs to balance access to capital with investor protection.
Why SMEs list? Access to growth capital, brand visibility, liquidity for founders, and the ability to use publicly traded equity for M&A and employee incentives.
Popular SME venues: Euronext Growth (continental Europe), London AIM (though AIM’s structure is different), NSE Emerge and BSE SME (India), TSX Venture (Canada) and various regional growth boards. Exchanges increasingly offer pre-IPO programs and index inclusion to attract issuers. Euronext explicitly markets tailored listing journeys and investor pools for SMEs.
India as a case study: India’s SME markets (BSE SME, NSE Emerge) saw large volumes of small listings and notable capital raised historically; BSE’s SME crossing 600 listings and significant funds raised shows the scale and appetite for this route. Local retail and HNI investors play a disproportionate role in IPO allocations on SME boards, and many SMEs use these markets as stepping stones to main exchanges. However, regulators and exchanges warn about uneven due diligence standards and the need for investor education.
5. Structural features and investor behaviour in SME markets
Lower entry thresholds and lighter continuing obligations make SME boards attractive, but they also increase information asymmetry.
Investor mix: Retail and domestic institutional investors dominate many SME markets; that makes them sensitive to local sentiment and sometimes less correlated with global capital flows.
Price volatility & illiquidity: Many SME listings experience high initial pops or post-listing declines; long-term liquidity and governance can be variable. This means SME investing requires more focused research and risk tolerance.
Graduation pathway: Exchanges promote “graduation” from SME boards to the main market—this pathway creates an investment narrative (list, scale, graduate) that attracts some growth companies.
6. Regulatory & policy shifts affecting listing dynamics
Regulators in multiple regions have been balancing two objectives: broaden access to public capital for growth firms while protecting retail and unsophisticated investors. Typical policy moves include:
Strengthening disclosure and minimum corporate governance standards for SME boards.
Running pre-IPO education programs for management teams and investors (exchanges like Euronext emphasize educational support).
Closer monitoring of sponsor and promoter actions (especially after SPAC turbulence).
Incentives—tax or listing cost reductions—to encourage listings or relistings in domestic markets.
7. Challenges and risks (global & SME-specific)
Macro sensitivity: IPO pipelines can re-freeze quickly if interest rates or geopolitical tensions spike. (Mid-2025 tariff headlines illustrated this risk.)
Valuation gap: Private markets still sometimes price growth more richly than public markets will tolerate, delaying exits.
Post-IPO performance: A significant portion of IPO underperformance stems from immature governance, overly optimistic forecasting, or market rotation away from growth.
SME risk profile: SME boards have higher issuer-specific risk (concentration of promoter ownership, limited operating history). Robust disclosure and investor due diligence are essential.
8. Practical implications for stakeholders
For issuers (SMEs & midcaps): A public listing remains a credible route to scale. Plan the listing only when financials and governance can withstand scrutiny; consider whether an SME venue or direct main-board listing better serves long-term strategy. Use pre-IPO education services exchanges provide.
For investors: Diversify between established listed companies and a select set of SMEs—apply active due diligence on SME financials, promoter track record, and liquidity. Treat SME allocations as higher risk/high return.
For exchanges/regulators: Continue improving surveillance, standardise disclosure across SME platforms where possible, and invest in investor education campaigns to reduce information asymmetry.
9. Outlook (near term)
Most major advisory houses and banks saw a cautiously improving pipeline through H1–Q3 2025: more issuers willing to test the market, SPACs returning in a curated way, and regional variability (Americas and parts of Asia leading proceeds while Europe rebuilds). SME listings are likely to remain active where local investor demand and exchange support are strong (e.g., India, parts of Europe). However, a sustained recovery requires macro stability—lower volatility, clearer global trade policy, and accommodative capital markets. If those conditions hold, expect opportunistic pockets of high-quality IPOs and continued maturation of SME listing ecosystems.
10. Short recommendations (one-line each)
Issuers: prepare governance and communications early; choose the listing venue that fits growth stage.
Investors: treat SME allocations as active, research-intensive bets.
Exchanges/regulators: keep improving disclosure, investor education, and mechanisms to promote liquidity.
Advisors/underwriters: price conservatively, stress-test deals against volatility scenarios.

Bond Market Overview in Global TradingIntroduction
The global bond market is one of the largest and most influential components of the financial system, often considered the backbone of global capital markets. Bonds—also known as fixed-income securities—represent loans made by investors to borrowers, typically governments, municipalities, or corporations. In return, the borrower agrees to make periodic interest payments (coupons) and repay the principal at maturity.
With a total value exceeding $130 trillion globally, the bond market surpasses the global equity market in size. It serves as a vital mechanism for governments to finance deficits, corporations to raise capital, and investors to achieve stable income streams. In global trading, bonds play a key role in portfolio diversification, interest rate management, and economic stability.
1. The Structure of the Global Bond Market
The bond market can be broadly divided into sovereign bonds, corporate bonds, and municipal or supranational bonds. These segments cater to different types of issuers and investors:
1.1 Sovereign Bonds
Sovereign bonds are issued by national governments to fund public spending, infrastructure projects, and fiscal deficits. Examples include U.S. Treasuries, UK Gilts, German Bunds, and Japanese Government Bonds (JGBs).
They are considered the safest instruments in their respective countries, especially when denominated in a nation’s own currency. The U.S. Treasury market is the largest and most liquid, serving as a global benchmark for interest rates and risk-free returns.
1.2 Corporate Bonds
Corporations issue bonds to finance operations, mergers, or expansion without diluting ownership through equity issuance. Corporate bonds typically carry higher yields than government bonds due to increased credit risk. They are classified as:
Investment Grade Bonds: Issued by companies with strong credit ratings (e.g., Apple, Microsoft, Nestlé).
High-Yield or Junk Bonds: Issued by companies with lower credit ratings, offering higher returns to compensate for default risk.
1.3 Municipal and Supranational Bonds
Municipal bonds (or “munis”) are issued by states or local governments, primarily in the U.S., to finance public infrastructure like schools, hospitals, or transportation systems.
Supranational organizations—such as the World Bank, IMF, or Asian Development Bank—also issue bonds to support global development initiatives. These bonds are typically low-risk due to strong institutional backing.
2. How the Bond Market Works
2.1 Primary Market
The primary market involves the initial issuance of bonds. Governments issue bonds via auctions, while corporations issue through underwriters in public or private placements. The primary market provides direct funding to issuers.
2.2 Secondary Market
Once issued, bonds trade in the secondary market, where investors buy and sell existing bonds. Prices fluctuate due to changes in interest rates, inflation, credit ratings, and market sentiment.
Major secondary markets include the U.S. Treasury market, the London bond market, and electronic platforms like Tradeweb and MarketAxess. Liquidity in these markets ensures that investors can easily adjust portfolios and manage risks.
3. Key Features and Metrics
Understanding the global bond market requires familiarity with core concepts:
3.1 Coupon Rate
The coupon rate is the fixed or floating interest rate paid by the bond issuer to the bondholder. For instance, a 5% coupon bond with a $1,000 face value pays $50 annually.
3.2 Yield
Bond yield reflects the effective return an investor earns. It varies inversely with bond prices—when interest rates rise, bond prices fall, and yields increase. Common types include:
Current Yield
Yield to Maturity (YTM)
Yield Spread (difference between yields of two bonds)
3.3 Duration and Convexity
Duration measures a bond’s sensitivity to interest rate changes. Longer-duration bonds experience greater price volatility. Convexity refines this measure, accounting for nonlinear changes in prices relative to yields.
3.4 Credit Rating
Credit rating agencies—such as Moody’s, S&P Global, and Fitch—assess the creditworthiness of issuers. Ratings range from AAA (highest quality) to D (default), guiding investors on risk levels.
4. Participants in the Global Bond Market
The bond market brings together a diverse set of participants:
Governments: Issuing debt to fund national spending or manage monetary policy.
Corporations: Raising long-term capital for expansion.
Institutional Investors: Pension funds, insurance companies, and sovereign wealth funds seeking stable returns.
Central Banks: Managing monetary policy by buying or selling bonds (quantitative easing or tightening).
Retail Investors: Accessing bonds through ETFs or mutual funds.
In global trading, institutional investors dominate due to the market’s scale and complexity, though retail participation has grown with digital bond platforms.
5. Global Bond Market Instruments
The diversity of instruments reflects varying risk appetites and investment horizons:
5.1 Fixed-Rate Bonds
These bonds pay a constant coupon over their lifetime. They offer predictability, making them popular among conservative investors.
5.2 Floating-Rate Notes (FRNs)
Coupon payments adjust based on a benchmark rate (e.g., LIBOR, SOFR). FRNs protect investors from rising interest rates.
5.3 Zero-Coupon Bonds
Issued at a discount, these bonds pay no periodic interest but return the face value at maturity. They appeal to long-term investors seeking capital appreciation.
5.4 Inflation-Linked Bonds
Examples include U.S. TIPS and UK Index-Linked Gilts, which adjust coupon and principal payments for inflation, preserving real returns.
5.5 Convertible Bonds
Hybrid securities allowing investors to convert bonds into equity under certain conditions. These offer growth potential alongside fixed-income stability.
5.6 Green and Sustainable Bonds
These fund environmentally friendly or socially responsible projects. The green bond market has surged past $2 trillion, reflecting global ESG investment trends.
6. Importance of Bonds in Global Trading
Bonds serve several crucial functions in international finance:
6.1 Capital Formation
They enable governments and corporations to raise large amounts of capital efficiently.
6.2 Benchmark for Interest Rates
Sovereign bonds—especially U.S. Treasuries—serve as global benchmarks for interest rates, influencing mortgage rates, corporate debt costs, and derivatives pricing.
6.3 Portfolio Diversification
Bonds typically have low correlation with equities, reducing overall portfolio volatility.
6.4 Safe Haven Investment
During economic uncertainty, investors flock to high-grade government bonds, particularly U.S. Treasuries, as a refuge from market turbulence.
6.5 Monetary Policy Tool
Central banks use bond markets to influence liquidity and interest rates. For example, through open market operations or quantitative easing (QE).
7. Factors Influencing Bond Prices and Yields
Bond performance depends on macroeconomic and market dynamics:
7.1 Interest Rates
The most critical factor—bond prices move inversely to interest rates. When central banks raise rates to combat inflation, existing bond prices fall.
7.2 Inflation
Higher inflation erodes the purchasing power of fixed returns, reducing bond attractiveness unless yields rise accordingly.
7.3 Credit Risk
Downgrades in an issuer’s credit rating or default concerns can cause sharp price declines, especially in corporate or emerging market bonds.
7.4 Currency Movements
Global investors face exchange rate risk when investing in foreign bonds. A weaker local currency can erode returns.
7.5 Economic and Political Stability
Geopolitical tensions, wars, or policy uncertainty often drive investors toward stable, developed-market bonds.
8. Major Global Bond Markets
8.1 United States
The U.S. bond market, led by Treasury securities, is the most liquid and widely traded globally. Corporate bond trading is also highly active, supported by transparent regulations and deep investor demand.
8.2 Europe
The Eurozone bond market includes government bonds from Germany, France, and Italy, as well as Eurobonds—international bonds denominated in euros but issued outside the Eurozone.
8.3 Asia-Pacific
Japan, China, and India have growing bond markets. Japan’s low-yield JGBs influence global interest rate dynamics, while China’s bond market—now the world’s second largest—has opened to foreign investors via programs like Bond Connect.
8.4 Emerging Markets
Countries like Brazil, Mexico, Indonesia, and South Africa issue sovereign and corporate bonds that offer higher yields but carry elevated currency and credit risks.
9. Technological and Regulatory Developments
9.1 Digital Bond Trading
Technological platforms have transformed bond trading from traditional over-the-counter (OTC) methods to electronic trading networks. Platforms such as Bloomberg, MarketAxess, and Tradeweb enhance transparency, liquidity, and efficiency.
9.2 Blockchain and Tokenization
Blockchain technology allows tokenized bonds—digital representations of bond ownership on secure ledgers. These innovations promise faster settlement, lower costs, and greater accessibility.
9.3 ESG and Sustainable Finance Regulations
Regulatory bodies in the EU and other regions are promoting green disclosure frameworks, ensuring transparency in ESG-linked bonds.
9.4 Monetary and Fiscal Coordination
Global bond markets increasingly reflect coordinated central bank actions, as seen during COVID-19 stimulus efforts and post-pandemic tightening cycles.
10. Challenges and Risks
Despite its stability, the bond market faces key challenges:
Rising Interest Rates: As central banks tighten monetary policy, bond prices decline, causing capital losses.
Sovereign Debt Crises: Excessive government borrowing (e.g., Greece 2010, Argentina 2018) can trigger market shocks.
Liquidity Risk: In less developed or high-yield markets, bonds may be hard to sell quickly.
Currency Volatility: Cross-border investors face exchange rate fluctuations that impact returns.
Climate Risk: Environmental disasters and transition risks can affect bond valuations, especially for sectors with high carbon exposure.
11. The Future of the Global Bond Market
The future trajectory of the global bond market will be shaped by technological innovation, sustainable finance, and monetary policy evolution.
Digital Bonds and tokenized securities are expected to revolutionize issuance and settlement.
Green and social bonds will continue expanding, aligning finance with climate goals.
Artificial intelligence and data analytics will enhance credit risk assessment and trading strategies.
Interest rate cycles post-2025 will redefine global yield curves as inflation stabilizes.
Furthermore, greater participation from retail investors and emerging economies will democratize bond investing, creating a more balanced and inclusive market.
Conclusion
The global bond market is an intricate, dynamic, and essential part of the international financial system. It serves as a source of funding for governments and corporations, a tool for investors to earn stable income, and a mechanism for central banks to execute monetary policy.
In an era of technological transformation and shifting geopolitical landscapes, the bond market’s role remains indispensable in balancing risk, facilitating investment, and promoting economic growth worldwide. As sustainability, innovation, and global integration advance, bonds will continue to anchor financial stability and serve as a foundation for responsible global trading.
ETFs vs Index TradingIntroduction
The financial markets offer a wide range of instruments that cater to investors of varying risk appetites, time horizons, and objectives. Among these, Exchange-Traded Funds (ETFs) and Index Trading stand out as two of the most popular methods for gaining diversified exposure to markets. While both allow investors to benefit from broad market movements rather than focusing on individual stocks, they differ in structure, flexibility, trading mechanism, cost, and strategic use. Understanding the distinctions between ETFs and index trading is essential for investors aiming to optimize returns while managing risk efficiently.
1. Understanding ETFs
Definition and Structure
An Exchange-Traded Fund (ETF) is a type of pooled investment vehicle that holds a basket of securities — such as stocks, bonds, commodities, or currencies — and is traded on an exchange like a stock. ETFs are designed to track the performance of an underlying index, such as the S&P 500, Nifty 50, or NASDAQ-100, but can also be actively managed in some cases.
Each ETF is composed of shares that represent proportional ownership in the underlying assets. Investors buy and sell ETF shares throughout the trading day at market prices, similar to how they trade stocks. The creation and redemption mechanism, involving authorized participants, helps maintain the ETF’s price close to its Net Asset Value (NAV).
Types of ETFs
Index ETFs – Track a specific market index (e.g., SPDR S&P 500 ETF).
Sector ETFs – Focus on specific industries (e.g., technology, healthcare, energy).
Bond ETFs – Invest in government, corporate, or municipal bonds.
Commodity ETFs – Provide exposure to commodities like gold, silver, or oil.
International ETFs – Offer access to global markets or specific regions.
Thematic ETFs – Focus on trends like renewable energy or artificial intelligence.
Leveraged & Inverse ETFs – Designed for short-term traders seeking amplified or inverse returns.
How ETFs Work
ETFs are managed by fund companies that assemble the basket of assets mirroring an index. When large institutions (authorized participants) buy or redeem ETF shares, they exchange them for the underlying basket of securities. This creation/redemption process ensures liquidity and price alignment with the index.
Investors can hold ETFs in brokerage accounts and trade them intraday. The price fluctuates throughout the day based on supply and demand, unlike mutual funds, which can only be traded at end-of-day NAV.
2. Understanding Index Trading
Definition and Concept
Index trading involves speculating on the price movements of a stock market index such as the Dow Jones Industrial Average (DJIA), S&P 500, FTSE 100, or Nifty 50. Investors do not own the individual stocks within the index but trade based on the overall direction of the index’s value.
Unlike ETFs, which represent ownership in a basket of assets, index trading is generally executed through derivatives such as futures, options, contracts for difference (CFDs), or index funds. The main objective is to profit from market movements — either upward or downward — without holding the physical assets.
Forms of Index Trading
Index Futures – Standardized contracts to buy or sell an index at a predetermined price on a future date.
Index Options – Provide the right (but not obligation) to trade the index at a specific strike price.
CFDs (Contracts for Difference) – Enable traders to speculate on index price changes without owning the underlying assets.
Index Funds – Mutual funds designed to replicate the performance of a specific index (though less flexible than ETFs).
Mechanics of Index Trading
Index traders focus on price charts, technical indicators, and macroeconomic data to forecast market direction. Because indices aggregate the performance of many companies, they offer a snapshot of overall market health. Traders use leverage in futures or CFDs to magnify potential gains — but also risk.
For example, when trading Nifty 50 Futures, a trader is betting on whether the Nifty index will rise or fall by the expiry date. This allows both hedging and speculative strategies.
3. Advantages of ETFs
1. Diversification
ETFs provide instant diversification across a large number of securities. For example, an S&P 500 ETF gives exposure to 500 of the largest U.S. companies, reducing single-stock risk.
2. Cost Efficiency
Most ETFs have low expense ratios compared to mutual funds, as they are passively managed.
3. Liquidity and Flexibility
ETFs can be bought or sold at any time during market hours, offering real-time trading flexibility.
4. Transparency
Holdings are disclosed daily, unlike mutual funds, which reveal their portfolios quarterly.
5. Dividend Income
Equity ETFs often pay dividends from the underlying stocks, which can be reinvested.
6. Tax Efficiency
Because ETFs use an in-kind creation/redemption process, they generally generate fewer taxable events than mutual funds.
4. Advantages of Index Trading
1. High Leverage
Traders can control large positions with small capital outlay, increasing potential returns.
2. Short-Selling Capability
Index derivatives allow traders to profit from falling markets — a feature not typically available with ETFs unless inverse ETFs are used.
3. Hedging Opportunities
Institutional investors use index futures and options to hedge portfolios against market risk.
4. 24-Hour Market Access
Major index futures (like S&P 500, NASDAQ, or FTSE) trade almost round the clock, allowing participation across global time zones.
5. Quick Market Exposure
Traders can gain exposure to the entire market efficiently without buying individual stocks.
5. Risks Involved
ETFs:
Tracking Error – ETF performance may slightly deviate from the underlying index due to fees or imperfect replication.
Liquidity Risk – Niche or thinly traded ETFs may experience wider spreads.
Market Risk – ETFs still carry the same risk as their underlying assets.
Currency Risk – For global ETFs, exchange rate fluctuations can affect returns.
Management Risk – Active ETFs depend on manager skill for performance.
Index Trading:
Leverage Risk – Amplifies both gains and losses.
Market Volatility – Indices can fluctuate rapidly due to macroeconomic or geopolitical events.
Margin Calls – Traders must maintain margin levels; otherwise, positions may be liquidated.
Timing Risk – Short-term trades can be affected by sudden market reversals.
Complexity – Requires understanding of derivatives, rollovers, and expiration dates.
6. Strategic Use Cases
When to Choose ETFs
Long-term investors seeking diversified exposure to markets.
Passive investors focused on wealth building.
Those preferring simplicity and low costs.
Investors who want dividend income.
Retirement portfolios and systematic investment plans (SIPs).
When to Choose Index Trading
Short-term or swing traders seeking profit from volatility.
Institutions looking to hedge market risk.
Traders comfortable with technical analysis and leverage.
Professionals managing derivatives portfolios.
Speculators expecting directional market moves.
7. Cost and Tax Comparison
ETFs:
Costs: Management fees (expense ratios), brokerage commission, and bid-ask spread.
Taxation: In India, equity ETFs held for over a year attract long-term capital gains tax (LTCG) at 10% above ₹1 lakh; short-term gains are taxed at 15%.
Index Trading:
Costs: Margin requirement, overnight rollover charges (for CFDs), exchange fees, and broker commissions.
Taxation: Profits from futures and options are treated as business income and taxed at slab rates. Losses can be carried forward for set-off.
8. Performance and Historical Context
Historically, ETFs have enabled retail investors to participate in market growth efficiently. For instance, the SPDR S&P 500 ETF (SPY), launched in 1993, has become one of the largest funds globally, offering consistent performance in line with the U.S. equity market.
On the other hand, index trading through derivatives has empowered traders to hedge risk and exploit volatility. The launch of index futures, such as Nifty Futures in India, significantly improved market depth and price discovery.
Both instruments have played critical roles in enhancing market efficiency and liquidity.
9. Global and Indian Market Perspective
Global Context
In developed markets like the U.S. and Europe, ETFs dominate retail and institutional portfolios due to low fees and easy access. Global ETF assets surpassed $10 trillion in 2023, driven by the rise of passive investing.
Indian Context
In India, ETFs have gained popularity through platforms like Nippon India ETF Nifty BeES, ICICI Prudential Nifty Next 50 ETF, and SBI ETF Sensex. Meanwhile, index trading through Nifty and Bank Nifty futures and options remains the backbone of India’s derivatives market, attracting massive daily volumes.
10. Future Trends
Thematic ETFs – Growing interest in innovation, AI, green energy, and digital assets.
Smart Beta ETFs – Combining passive and active strategies using factors like value or momentum.
ESG Indexes – Environmentally and socially conscious index products.
Algorithmic Index Trading – Automated strategies enhancing efficiency and reducing emotional bias.
Global Integration – Increasing cross-border ETF listings and index-linked products.
Conclusion
Both ETFs and index trading represent powerful tools for market participation — yet they serve different investor profiles.
ETFs suit long-term, passive investors who value diversification, stability, and simplicity.
Index trading, on the other hand, caters to active traders and professionals aiming to profit from short-term volatility or hedge risk using leverage.
The choice between ETFs and index trading depends on investment goals, time horizon, risk tolerance, and expertise. When used wisely, both can play complementary roles — ETFs for building wealth steadily, and index trading for tactical opportunities and portfolio protection.
In an evolving global financial ecosystem, understanding the nuances between these two approaches empowers investors to navigate markets more effectively, balance risk, and pursue consistent returns in both bullish and bearish environments.
How Key Fundamentals Can Play A Key Role In Your InvestmentsAs popular as Technical Analysis is with the ease of plotting indicators and tools to exhibit trend changes, Fundamental Analysis also plays a role not as simply demonstrated but equally as important!
Now when it comes to Fundamentals, there are a few key financial items that feed investors all the hints they need to potentially make fairly profitable investments and avoid devastatingly horrible mistakes and these are:
1) Income Statement
2) Balance Sheet
3) Cash Flow
The Income Statement retains the most mentioned fundamental metrics like Revenue which is how much money a company makes by selling their goods and services, Operating Expenses like Marketing and Research and Development.
Here I use NYSE:ACHR Income Statement for the example
www.tradingview.com
Even though Archer Aviation still has yet to post any Revenue, news for the company that's come out lately show a strong demand for NYSE:ACHR product and services:
- Signing a partnership with Korean Air to commercialize its electric air taxis in South Korea, with a potential purchase of up to 100 aircraft.
www.tradingview.com
- Named exclusive Air Taxi partner for the Los Angeles Sports & Entertainment Commission who will be hosting the 2026 World Cup.
www.tradingview.com
And with Archer Aviation acquiring Lilium's Patent Portfolio this month adding 300 Patent assets, pushing Archers total patents to exceed 1,000 assets globally, shows rapid expansion potential for the company against competitors!
www.tradingview.com
Now for the Balance Sheet
www.tradingview.com
The Balance Sheet can determine how healthy a company is and produces 3 important factors that basically determine a company's Net Worth and they are:
1) Assets - What the company owns
2) Liabilities - What the company owes
3) Equity - Whats left of the Assets once Liabilities are accounted for
We can see that NYSE:ACHR has maintained a stunning balance between their Assets and Liabilities with Assets just about doubling in Q'2 of 2025 from Q'4 2024 and Liabilities all the while staying relatively the same and low!
Meaning less hurdles to jump and obstacles to pay off that could slow the progress of growth in the long-term with great Equity!
Finally, the Cash Flow
www.tradingview.com
Cash Flow is a companies true way of transparency with showing the flow of cash in and out of the company and shows what's actually generated by the company from doing business and is separated in 3 sections:
1) Operating Activities
2) Investing Activities
3) Financing Activities
Now we can see Operating and Investing activities may not be NYSE:ACHR strong suit yet, but as Financing goes, numbers have continued to rise exponentially since Q'2 of 2024!
This suggests there is a lot of interest in the company from outside lenders and investors!
Like the saying goes, "Sometimes it takes belief in others belief in you before you gain belief in yourself." - Financial Activities could help carry NYSE:ACHR further!
** Remember, nothing in trading no matter how Technical or Fundamental is ever 100% right every time. It takes a combined effort of both Technical and Fundamentals to paint a vivid picture of what a company or asset may be worth or doing. So do your due diligence in research!
Don't Ask What To Invest In, Ask Why Invest In It!!
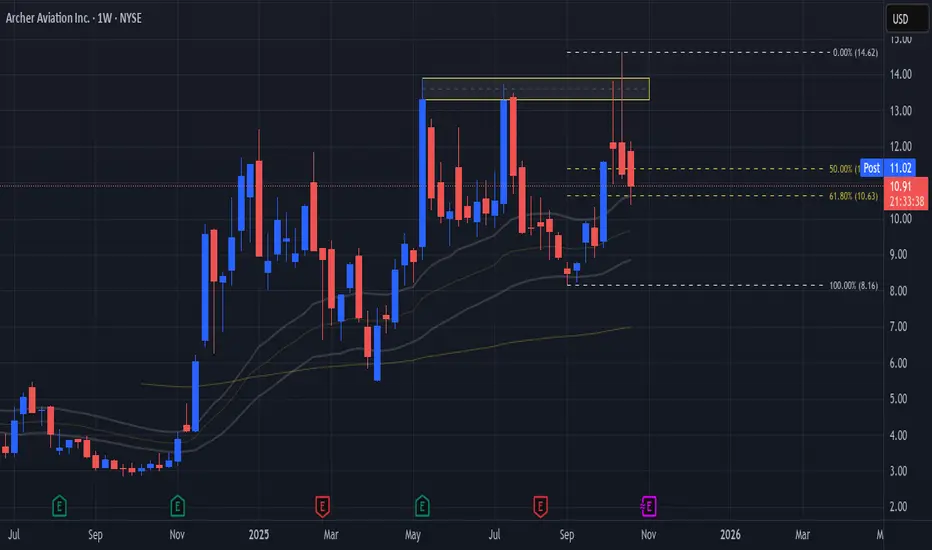
Global Market Insights1. Introduction
The global market represents the vast, interconnected system through which goods, services, capital, and information flow across international borders. It encompasses multiple sectors—finance, manufacturing, technology, energy, commodities, and consumer markets—all interwoven through trade, investment, and policy networks. Global markets serve as the backbone of the modern economy, reflecting shifts in geopolitical influence, technological innovation, and consumer behavior. Understanding global market insights requires an in-depth view of these interconnections, examining how trends in one region or industry can ripple throughout the entire world economy.
The 21st century has witnessed dramatic globalization driven by digital transformation, liberalization of trade, and the rise of emerging economies. Yet, the landscape remains volatile due to political tensions, climate challenges, pandemics, and rapid technological disruption. Thus, global market insights today involve balancing opportunity with risk, short-term speculation with long-term sustainability.
2. The Structure of the Global Market
The global market is not a single unified entity but a network of interdependent systems. Its structure is defined by several core components:
a. Financial Markets
These include global exchanges for stocks, bonds, currencies, and derivatives. The major financial centers—New York, London, Tokyo, Hong Kong, and Singapore—drive liquidity and capital allocation worldwide. Financial markets influence investment decisions, currency valuations, and risk sentiment, often serving as early indicators of economic health.
b. Commodity Markets
These markets handle the trading of raw materials such as oil, gold, agricultural goods, and metals. Commodity prices are vital indicators of global supply-demand balance and economic activity. For instance, oil price fluctuations impact energy costs, inflation, and geopolitical stability.
c. Trade Networks
International trade forms the lifeblood of the global economy. Institutions such as the World Trade Organization (WTO) and regional trade agreements (e.g., USMCA, EU Single Market, ASEAN) shape cross-border exchange rules. Global supply chains connect producers and consumers across continents, emphasizing efficiency but also exposing vulnerabilities during crises.
d. Labor and Human Capital
A globally mobile workforce enables talent optimization, outsourcing, and competitive labor markets. Countries like India, the Philippines, and Vietnam have emerged as service and manufacturing hubs due to skilled labor and cost advantages.
e. Technological Ecosystems
Digital platforms, AI, and automation redefine how markets function. Technology companies now dominate global capitalization rankings, with firms such as Apple, Microsoft, and Tencent leading innovation-driven growth.
3. Key Drivers of Global Market Dynamics
Several forces collectively shape the global market environment. Understanding these drivers provides insight into long-term investment and policy trends.
a. Globalization and Trade Liberalization
Trade liberalization has historically propelled global economic growth by reducing tariffs and barriers. However, recent trends of protectionism and “friend-shoring” (relocating supply chains to allied nations) have created new trade dynamics. Countries are balancing globalization benefits with domestic economic security.
b. Technological Innovation
Artificial intelligence, blockchain, green energy, and biotechnology are revolutionizing productivity and business models. Fintech innovations democratize finance, while automation enhances manufacturing efficiency but also disrupts traditional labor markets.
c. Monetary Policy and Interest Rates
Central banks, particularly the U.S. Federal Reserve, European Central Bank, and Bank of Japan, influence global liquidity through interest rate policies. Low-rate environments stimulate investment, while tightening cycles tend to slow growth and shift capital flows.
d. Geopolitical Tensions
Conflicts, trade wars, and sanctions significantly affect global stability. For instance, U.S.-China rivalry shapes global technology access, supply chains, and foreign investment patterns. Similarly, regional conflicts like those in Eastern Europe and the Middle East disrupt energy supplies and commodity prices.
e. Environmental and Climate Considerations
Climate change has emerged as both a risk and an opportunity for global markets. Green energy investments, carbon pricing, and sustainable finance are transforming industries. Companies increasingly adopt ESG (Environmental, Social, Governance) frameworks to align profitability with sustainability.
4. Regional Market Insights
a. North America
The United States remains the world’s largest economy, driven by innovation, consumer spending, and strong financial markets. Canada complements this with robust energy and resource exports. North American markets are characterized by technological dominance, resilient consumption, and deep capital markets, though debt levels and political polarization pose risks.
b. Europe
Europe’s markets are defined by regulatory strength and industrial diversity. The European Union (EU) remains a global trade powerhouse, but it faces challenges such as slow growth, aging populations, and energy dependency. The post-Brexit landscape continues to redefine trade and financial dynamics.
c. Asia-Pacific
Asia is the epicenter of global growth. China’s transition from manufacturing to consumption-driven growth, India’s digital and service-led expansion, and Southeast Asia’s emerging consumer economies drive demand and innovation. Japan and South Korea continue to lead in technology and advanced manufacturing.
d. Latin America
Rich in natural resources, Latin America’s growth is often tied to commodity cycles. Political instability and inflation challenges persist, yet nations like Brazil, Chile, and Mexico are modernizing their industries and integrating more deeply into global value chains.
e. Africa and the Middle East
Africa’s markets offer high growth potential due to demographics and natural resources. However, infrastructure deficits and governance issues limit progress. The Middle East remains energy-centric, but nations like Saudi Arabia and the UAE are diversifying into tourism, technology, and renewable energy.
5. Global Market Trends and Transformations
a. Digitalization and E-Commerce
E-commerce, digital payments, and data-driven marketing have reshaped consumer behavior. Platforms such as Amazon, Alibaba, and Shopify integrate technology with logistics, enabling borderless retail markets.
b. Shift to Green Economies
Sustainable finance and renewable energy investments are accelerating. Electric vehicles, solar energy, and carbon credit markets exemplify the shift from fossil fuels toward decarbonized economies.
c. Rise of Emerging Markets
Emerging economies contribute over 60% of global GDP growth. Rapid urbanization, expanding middle classes, and technological adoption make these regions central to future global demand.
d. Supply Chain Realignment
COVID-19 exposed vulnerabilities in global supply chains. Companies now diversify sourcing through “China+1” strategies, reshoring, or nearshoring to enhance resilience.
e. Financial Digitalization
The global financial system is undergoing a technological revolution—cryptocurrencies, central bank digital currencies (CBDCs), and decentralized finance (DeFi) redefine how value is exchanged and stored.
6. Challenges in the Global Market
a. Economic Inequality
Globalization has lifted millions out of poverty but also widened income gaps. Developed nations face stagnating wages, while emerging markets grapple with uneven wealth distribution.
b. Inflation and Debt Pressures
Post-pandemic stimulus and geopolitical disruptions have driven inflationary pressures. High public and private debt levels threaten fiscal stability in several economies.
c. Geopolitical Fragmentation
Rising nationalism, trade barriers, and regional conflicts threaten global cooperation. The move toward multipolarity—where power is distributed across multiple regions—complicates policy coordination.
d. Technological Disruption
While innovation fuels growth, it also causes displacement. Automation, AI, and robotics could replace millions of jobs, demanding urgent skill development and policy adaptation.
e. Environmental Risks
Climate change, resource depletion, and extreme weather events increasingly disrupt markets. Sustainable investment and risk mitigation are becoming essential components of global economic strategy.
7. Opportunities in the Global Market
a. Green and Renewable Technologies
Investing in renewable energy, electric vehicles, and sustainable infrastructure offers massive long-term potential. Global climate policies encourage public-private collaboration in this sector.
b. Digital Transformation
AI, IoT (Internet of Things), 5G, and cloud computing provide opportunities for companies to enhance efficiency and innovation. Digitalization also opens new frontiers in fintech, healthcare, and education.
c. Emerging Market Expansion
Asia, Africa, and Latin America present enormous consumer and investment opportunities. Infrastructure development, mobile banking, and digital entrepreneurship are rapidly scaling.
d. Healthcare and Biotechnology
The pandemic accelerated innovation in healthcare, telemedicine, and biotechnology. Aging populations and increased health awareness drive continued global demand.
e. Financial Inclusion and Fintech
Fintech startups are democratizing access to financial services. Mobile payments, digital lending, and blockchain solutions bridge the gap for unbanked populations.
8. The Role of Policy and Global Institutions
Global markets depend on policy coordination and institutional support. Organizations such as the IMF (International Monetary Fund), World Bank, WTO, and OECD provide frameworks for trade, investment, and development. Meanwhile, regional alliances—like the EU, ASEAN, and BRICS—enhance collective bargaining power.
Monetary policies from leading central banks influence global liquidity. Regulatory bodies now emphasize transparency, cybersecurity, and ESG standards to safeguard global market stability. Effective governance remains essential to mitigate systemic risks and foster inclusive growth.
9. The Future Outlook
The future of global markets will be defined by adaptation—economic, technological, and environmental. We are entering a multipolar world, where economic influence is shared among the U.S., China, the EU, and emerging economies. Technology will continue to integrate markets, but digital sovereignty and cybersecurity will emerge as major battlegrounds.
Artificial intelligence and automation will revolutionize industries, while green transitions redefine energy and transportation systems. However, sustained global growth depends on balancing profit with sustainability, and innovation with inclusivity.
Global markets are likely to remain volatile in the short term due to inflation cycles, geopolitical uncertainty, and climate challenges. Yet, long-term prospects remain positive, driven by human ingenuity, digital innovation, and cross-border collaboration.
10. Conclusion
Global market insights reveal a dynamic, interconnected, and ever-evolving system that mirrors humanity’s economic ambitions and collective challenges. The interplay of technology, policy, and capital continues to transform industries and societies. While globalization has delivered prosperity and innovation, it also presents new risks—economic inequality, environmental degradation, and political fragmentation.
The key to thriving in the global market lies in adaptability, diversification, and sustainable strategy. Businesses, investors, and governments must embrace change, leverage digital transformation, and commit to ethical and resilient growth models. In this intricate web of interdependence, understanding global market insights is not just an academic pursuit—it is a strategic necessity for the future of global prosperity.
Derivatives Make Trading EasyIntroduction
Derivatives are among the most influential financial innovations of the modern era, playing a crucial role in shaping global financial markets. A derivative is a financial contract whose value is derived from an underlying asset, index, or rate. These underlying assets can include commodities, currencies, bonds, equities, or market indices. The primary purpose of derivatives is to manage risk, enhance liquidity, and enable traders and investors to speculate or hedge against future price movements.
In today’s complex and interconnected markets, derivatives have become indispensable tools. They make trading easier by allowing market participants to transfer risk, leverage capital efficiently, and discover prices more transparently. From futures and options to swaps and forwards, derivatives are central to both institutional and retail trading strategies worldwide.
Understanding Derivatives
A derivative derives its price from an underlying asset or benchmark. For instance, a crude oil futures contract is based on the expected future price of oil. The buyer or seller of a derivative does not necessarily have to own the physical asset; rather, they engage in a contract based on the price movement of that asset.
There are four main types of derivatives:
Futures – Standardized contracts to buy or sell an asset at a specified future date and price.
Options – Contracts that give the holder the right, but not the obligation, to buy or sell an asset at a predetermined price.
Forwards – Customized, over-the-counter (OTC) agreements to trade an asset in the future at a fixed price.
Swaps – Contracts in which two parties exchange cash flows or other financial instruments over time.
These instruments are used for hedging, speculation, and arbitrage—three pillars that make derivatives essential in trading.
Derivatives as a Tool for Risk Management
One of the greatest advantages of derivatives is their ability to hedge risk. Price volatility in assets like oil, currencies, and equities can significantly affect businesses, investors, and governments. Derivatives provide a means to protect against adverse price movements.
For example, consider an airline company concerned about fluctuating oil prices. Since fuel costs represent a large portion of operational expenses, the company may purchase oil futures to lock in a price for future deliveries. This strategy ensures that even if oil prices rise sharply, the airline’s fuel costs remain stable. Similarly, exporters and importers use currency derivatives to hedge against foreign exchange volatility.
In essence, derivatives transfer risk from those who want to avoid it (hedgers) to those who are willing to take it (speculators). This risk redistribution stabilizes markets and enables participants to focus on their core activities without worrying about unpredictable price swings.
Facilitating Leverage and Capital Efficiency
Another reason derivatives make trading easier is through leverage. Leverage allows traders to control large positions with relatively small amounts of capital. This is because derivatives require only a margin or initial deposit rather than full payment of the underlying asset’s value.
For instance, instead of buying 100 shares of a company at ₹1,000 each (totaling ₹1,00,000), a trader could buy a futures contract that represents the same 100 shares by depositing a margin of just 10%, or ₹10,000. If the stock price rises, the percentage return on the margin is magnified, offering higher potential profits.
While leverage increases both gains and risks, it allows participants to deploy capital more efficiently, freeing funds for other investments or hedging needs. For professional traders, portfolio managers, and institutions, this efficiency is a cornerstone of modern trading strategies.
Enhancing Market Liquidity
Derivatives also increase liquidity in financial markets. Liquidity refers to the ease with which assets can be bought or sold without significantly affecting their prices. Derivative markets attract diverse participants—hedgers, speculators, and arbitrageurs—who together contribute to high trading volumes and continuous price discovery.
For example, the introduction of futures and options on equity indices such as the Nifty 50 or S&P 500 has dramatically boosted liquidity in underlying stock markets. Traders can enter or exit positions quickly, and price discrepancies between derivatives and underlying assets are swiftly corrected through arbitrage. This constant interaction between cash and derivative markets ensures price stability and efficiency.
Thus, derivatives not only make trading more active but also promote smoother market functioning, benefitting investors, institutions, and regulators alike.
Price Discovery and Transparency
Price discovery is the process through which markets determine the fair value of assets. Derivatives play a vital role in this mechanism. Since derivative prices reflect traders’ expectations about future asset values, they serve as leading indicators of market sentiment.
For example, if the futures price of gold is significantly higher than its current spot price, it suggests that investors expect gold prices to rise. Similarly, options trading activity can reveal expectations about market volatility. Analysts and policymakers closely monitor derivatives data—like the VIX index, derived from options on the S&P 500—to gauge investor confidence and predict potential market movements.
This informational efficiency makes derivatives indispensable in modern trading, enabling participants to anticipate trends and adjust strategies accordingly.
Speculation and Profit Opportunities
While hedging focuses on risk management, speculation involves taking positions to profit from price fluctuations. Derivatives make speculation more accessible and efficient. Since derivatives require lower capital outlays and offer high liquidity, traders can speculate on short-term movements in equities, commodities, interest rates, or currencies without owning the underlying assets.
For instance, a trader who believes that crude oil prices will increase might buy oil futures. If prices indeed rise, the trader can sell the contract for a profit without ever dealing with the physical commodity. Similarly, options traders can design complex strategies—such as straddles, strangles, and spreads—to profit from both rising and falling markets.
Speculators play a crucial role in maintaining market balance. Their willingness to assume risk provides liquidity and ensures smoother price adjustments, indirectly benefiting hedgers and investors.
Arbitrage and Market Efficiency
Arbitrage—the practice of exploiting price differences between related markets—is another area where derivatives simplify trading. Arbitrageurs identify discrepancies between the spot price of an asset and its derivative price, buying in one market and selling in another to lock in risk-free profits.
For instance, if a stock trades at ₹500 in the cash market but its futures contract is priced at ₹510, an arbitrageur could buy the stock and simultaneously sell the futures. When the prices converge, they earn a small profit with minimal risk.
This activity keeps markets aligned, preventing excessive mispricing and enhancing overall efficiency. The continuous presence of arbitrageurs ensures that derivative prices accurately reflect the underlying asset’s value.
Applications Across Sectors
Derivatives are not limited to financial institutions. They are used across sectors for strategic and operational benefits:
Corporations use currency and interest rate derivatives to manage cross-border risks and borrowing costs.
Farmers and commodity producers hedge against unpredictable weather or price fluctuations using futures contracts.
Investors and fund managers use equity and index derivatives to balance portfolios and protect returns.
Governments and central banks utilize derivatives for monetary policy operations and debt management.
By providing flexibility and adaptability, derivatives make trading and financial management easier for all these entities.
Derivatives and Globalization
The rise of global trade and interconnected capital markets has further amplified the importance of derivatives. With cross-border investments, exchange rate volatility, and global supply chains, businesses face multiple layers of financial risk. Derivatives provide a universal language for managing these exposures.
For example, multinational corporations use foreign exchange swaps to manage international cash flows, while global investors employ interest rate futures to navigate shifting monetary policies across countries. In this way, derivatives enable smoother international trade and investment, fostering global financial integration.
Technological Advancements and Derivative Trading
Modern technology has revolutionized derivative trading. Algorithmic and high-frequency trading systems execute thousands of derivative transactions per second, ensuring real-time liquidity and efficient pricing. Online trading platforms allow retail investors to access futures and options markets with ease, democratizing financial participation.
Additionally, innovations like exchange-traded derivatives (ETDs) and clearinghouses have enhanced safety and transparency. Centralized clearing reduces counterparty risk, ensuring that both sides of a trade are guaranteed by the exchange. This framework has made derivatives trading more secure and accessible than ever before.
Challenges and Risks
While derivatives make trading easier, they also come with risks. Excessive leverage can amplify losses, and complex derivative structures can be misused or misunderstood. The 2008 global financial crisis highlighted how poorly regulated derivatives—especially credit default swaps—can destabilize entire economies.
Therefore, it is vital for traders and institutions to implement strong risk management, compliance, and transparency measures. Exchanges and regulators such as SEBI, CFTC, and ESMA continuously update guidelines to ensure that derivative trading remains fair, secure, and beneficial to the broader economy.
Conclusion
Derivatives have fundamentally transformed how the world trades, invests, and manages financial risk. They simplify trading by enabling participants to hedge exposures, speculate intelligently, discover prices efficiently, and optimize capital use. From farmers and corporations to fund managers and central banks, derivatives serve as versatile instruments that empower decision-making in an uncertain world.
By transferring risk, enhancing liquidity, and increasing efficiency, derivatives make financial markets more resilient and dynamic. However, like any powerful tool, they require discipline, understanding, and regulatory oversight to ensure stability. When used responsibly, derivatives do not just make trading easy—they make it smarter, safer, and more strategic in the global financial ecosystem.

Trading Crude Oil and the Geopolitical Impact on PricesIntroduction
Crude oil is one of the most strategically significant commodities in the global economy. It fuels transportation, powers industries, and serves as a critical input for countless products ranging from plastics to fertilizers. Because of its universal importance, crude oil trading is not just a financial endeavor—it is a reflection of global political stability, economic growth, and international relations. The price of crude oil is highly sensitive to geopolitical events, including wars, sanctions, alliances, and policy changes. Understanding how geopolitical dynamics affect oil trading and pricing is vital for traders, investors, and policymakers.
1. The Fundamentals of Crude Oil Trading
Crude oil trading involves the buying and selling of oil in various markets, primarily through futures contracts on exchanges such as the New York Mercantile Exchange (NYMEX), Intercontinental Exchange (ICE), and Dubai Mercantile Exchange (DME). These contracts allow traders to speculate on the future price of oil, hedge against risks, or facilitate physical delivery. Two main benchmark grades dominate the market: West Texas Intermediate (WTI) and Brent Crude.
WTI Crude Oil is primarily sourced from the U.S. and traded in dollars per barrel.
Brent Crude Oil is produced in the North Sea and serves as the global benchmark for pricing.
Oil prices are influenced by multiple factors, including supply and demand fundamentals, global economic growth, production levels, inventory data, transportation costs, and geopolitical events. Among these, geopolitical tensions often have the most immediate and dramatic impact.
2. Geopolitics as a Determinant of Oil Prices
The global oil market is uniquely vulnerable to geopolitical developments because a significant portion of reserves and production is concentrated in politically sensitive regions such as the Middle East, North Africa, and Russia. Around 60% of proven oil reserves lie in OPEC (Organization of Petroleum Exporting Countries) member nations, many of which have experienced conflict, sanctions, or regime instability.
Geopolitical risk refers to the potential disruption in oil supply or transportation routes due to international conflicts, political upheaval, or policy decisions. When such risks escalate, traders often bid up oil prices in anticipation of supply shortages—even before any actual disruption occurs.
3. Historical Perspective: Major Geopolitical Events and Oil Prices
a. The 1973 Arab Oil Embargo
One of the earliest and most significant examples of geopolitically driven oil price shocks occurred in 1973 when Arab OPEC members imposed an oil embargo against the United States and other nations supporting Israel during the Yom Kippur War. Oil prices quadrupled within months, leading to inflation, recession, and a global energy crisis. The embargo demonstrated the power of oil as a political weapon and the vulnerability of consumer nations.
b. The Iranian Revolution (1979)
The overthrow of the Shah of Iran and the subsequent decline in Iranian oil production reduced global supply by nearly 5%. This shortage, coupled with the Iran-Iraq War (1980–1988), sent prices soaring again. The resulting volatility highlighted how political instability in a single oil-producing nation could ripple through the entire global economy.
c. The Gulf War (1990–1991)
Iraq’s invasion of Kuwait disrupted nearly 5 million barrels per day of oil production. The U.S.-led coalition’s response and the ensuing war created massive uncertainty in the Middle East, briefly pushing oil prices above $40 per barrel—a significant level for that time.
d. The Iraq War (2003)
The U.S. invasion of Iraq reignited geopolitical fears about supply disruptions. Although global production eventually stabilized, the war contributed to sustained higher oil prices in the early 2000s, further compounded by rapid industrialization in China and India.
e. The Arab Spring (2010–2011)
The wave of protests across the Middle East and North Africa led to regime changes and unrest in key producers such as Libya and Egypt. The civil war in Libya, in particular, cut oil output by over one million barrels per day, causing Brent crude prices to exceed $120 per barrel.
f. Russia-Ukraine Conflict (2014 and 2022)
Russia’s annexation of Crimea in 2014 and its full-scale invasion of Ukraine in 2022 significantly disrupted global energy markets. As one of the world’s largest oil and gas exporters, Russia faced Western sanctions that restricted exports, insurance, and financing. In early 2022, Brent crude spiked above $130 per barrel, reflecting fears of prolonged supply shortages and energy insecurity across Europe.
4. Channels Through Which Geopolitics Impacts Oil Prices
Geopolitical events influence oil prices through several interconnected channels:
a. Supply Disruptions
Conflicts or sanctions can directly reduce oil supply by damaging infrastructure, limiting production, or restricting exports. For example, sanctions on Iran in 2012 and again in 2018 led to significant declines in its oil exports, tightening global supply.
b. Transportation and Shipping Risks
Chokepoints such as the Strait of Hormuz, Suez Canal, and Bab el-Mandeb Strait are vital for global oil transportation. Any military conflict or threat in these areas immediately raises concerns about shipping disruptions, leading to higher prices. Nearly 20% of global oil passes through the Strait of Hormuz daily.
c. Speculative Reactions
Traders and hedge funds respond quickly to geopolitical news, often amplifying price movements. Futures markets price in expected risks, causing volatility even when actual supply remains unaffected.
d. Strategic Reserves and Policy Responses
Nations often release oil from strategic reserves or negotiate production increases through OPEC to stabilize markets. For example, the U.S. and IEA (International Energy Agency) coordinated strategic reserve releases in 2022 to offset supply disruptions caused by the Russia-Ukraine conflict.
e. Currency Movements
Since oil is traded in U.S. dollars, geopolitical tensions that weaken the dollar or create global uncertainty can influence oil prices. A weaker dollar often makes oil cheaper for non-U.S. buyers, boosting demand and raising prices.
5. OPEC and Geopolitical Strategy
The Organization of Petroleum Exporting Countries (OPEC), formed in 1960, and its extended alliance OPEC+, which includes Russia, play a pivotal role in determining oil supply and prices. The organization uses coordinated production quotas to manage global prices, often aligning decisions with geopolitical interests.
For instance:
In 2020, during the COVID-19 pandemic, OPEC+ cut production by nearly 10 million barrels per day to support collapsing prices.
In 2023, Saudi Arabia and Russia announced voluntary cuts to maintain price stability amid slowing demand and Western sanctions.
OPEC’s policies are inherently geopolitical, balancing the economic needs of producers with the political relationships among member states and major consumer nations.
6. Energy Transition and the New Geopolitics of Oil
The growing global emphasis on renewable energy and decarbonization is reshaping the geopolitical landscape of oil trading. As nations transition to cleaner energy, oil-producing countries face the challenge of maintaining revenue while managing political stability.
However, this transition also introduces new geopolitical dependencies—for example, on lithium, cobalt, and rare earth metals used in electric vehicle batteries. While demand for oil may gradually plateau, geopolitical risks remain as nations compete over new energy supply chains.
Additionally, U.S. shale production has transformed the country from a net importer to a major exporter, reducing its vulnerability to Middle Eastern geopolitics but also introducing new market dynamics. Shale producers can ramp up or scale down production relatively quickly, acting as a “shock absorber” to global price swings.
7. The Role of Technology and Market Transparency
Technological advancements in trading—especially algorithmic and data-driven models—have increased market liquidity but also heightened sensitivity to news. Real-time tracking of geopolitical developments via satellites, social media, and analytics platforms allows traders to react instantly.
For example, satellite data showing tanker movements or refinery fires can trigger immediate price adjustments. The intersection of AI, big data, and geopolitics now defines modern oil trading strategies, with traders assessing both quantitative signals and qualitative geopolitical intelligence.
8. Managing Geopolitical Risk in Oil Trading
Professional oil traders and corporations employ various strategies to manage geopolitical risks:
Diversification: Sourcing oil from multiple regions to minimize reliance on unstable producers.
Hedging: Using futures, options, and swaps to lock in prices and reduce exposure to volatility.
Scenario Analysis: Running stress tests based on potential geopolitical outcomes (e.g., war, sanctions, embargoes).
Political Risk Insurance: Protecting investments against losses due to government actions or conflict.
Strategic Reserves: Governments maintain emergency stockpiles to stabilize supply during crises.
In addition, diplomatic engagement and international cooperation—such as IEA coordination or U.N.-mediated negotiations—can help mitigate disruptions and maintain market balance.
9. The Future Outlook: Geopolitics and the Oil Market
As of the mid-2020s, the global oil market faces a new era of geopolitical uncertainty. Key issues shaping the future include:
The U.S.-China rivalry, which may influence energy trade routes and technological access.
Middle Eastern realignments, including normalization of relations between former rivals and shifting alliances.
Climate policy conflicts, as nations balance carbon reduction commitments with economic growth needs.
Sanctions regimes on Russia, Iran, and Venezuela, which continue to restrict global supply flexibility.
The digitalization of trading, which increases speed and transparency but also amplifies volatility.
Although long-term demand growth may slow due to renewable energy adoption, oil will remain a central geopolitical and economic asset for decades. The world’s dependence on energy ensures that geopolitics will continue to shape price trends, investment decisions, and market psychology.
Conclusion
Crude oil trading is not merely a reflection of supply and demand; it is a barometer of global stability and geopolitical tension. From the 1973 oil embargo to the ongoing Russia-Ukraine conflict, political decisions have repeatedly proven capable of reshaping energy markets. For traders and policymakers alike, understanding the geopolitical dimensions of oil is crucial for navigating price volatility and maintaining economic resilience.
As the energy transition accelerates, the nature of geopolitical risk will evolve—but it will not disappear. The intersection of oil, politics, and global economics will continue to define international relations and financial markets, ensuring that crude oil remains one of the world’s most geopolitically sensitive and closely watched commodities.

Investing in Bonds in the Global MarketIntroduction
In the ever-evolving landscape of global finance, bonds remain one of the most stable and reliable investment instruments. While equity markets often capture headlines with their volatility and potential for massive returns, the bond market — valued at over $130 trillion globally — forms the bedrock of the world’s financial system. Bonds provide essential capital for governments and corporations while offering investors predictable income streams and portfolio diversification.
Investing in bonds in the global market involves understanding the different types of bonds available, their risk-return characteristics, how interest rate movements influence them, and the factors shaping the global fixed-income environment. This essay explores the nature of global bond investing, its benefits, challenges, strategies, and the evolving dynamics in an interconnected global economy.
1. Understanding Bonds and Their Global Role
A bond is a debt security issued by a borrower — typically a government, municipality, or corporation — to raise funds from investors. In exchange, the issuer agrees to pay periodic interest (known as the coupon) and return the principal on maturity. In essence, bond investors are lenders rather than owners, unlike equity investors who hold a stake in a company.
The global bond market is divided broadly into:
Sovereign Bonds – Issued by national governments (e.g., U.S. Treasuries, German Bunds, Japanese Government Bonds).
Corporate Bonds – Issued by private or public corporations to finance operations or expansions.
Municipal Bonds – Issued by states, cities, or other local governments (mostly in the U.S.).
Supranational Bonds – Issued by international institutions like the World Bank or the European Investment Bank.
Global investors allocate funds to these instruments across various geographies to diversify risk and capture stable returns.
2. The Structure and Dynamics of the Global Bond Market
The global bond market is larger than the global stock market and plays a critical role in facilitating liquidity and funding across economies. It operates through both primary markets (where new bonds are issued) and secondary markets (where investors trade existing bonds).
The U.S. dominates the bond market, followed by the Eurozone, Japan, and China. Emerging markets have also become increasingly active players, issuing bonds denominated in both local and foreign currencies to attract international investors.
Key indicators in the bond market include:
Yield to Maturity (YTM): The total return expected if the bond is held to maturity.
Credit Rating: An assessment of the issuer’s creditworthiness, provided by agencies like Moody’s, S&P, and Fitch.
Duration and Convexity: Measures that indicate the bond’s sensitivity to interest rate changes.
These metrics help investors assess potential risks and rewards in a global portfolio.
3. Benefits of Investing in Global Bonds
a. Diversification
Investing in global bonds provides geographic diversification. Since interest rates, inflation, and economic cycles vary across countries, exposure to multiple bond markets reduces the portfolio’s overall volatility.
b. Stability and Predictable Income
Unlike equities, bonds provide fixed coupon payments, offering a predictable income stream. This stability attracts conservative investors, such as pension funds and retirees.
c. Risk Management
Bonds, especially government and high-grade corporate bonds, often act as a hedge during equity market downturns. When stock markets fall, investors typically move toward safer assets, driving bond prices higher.
d. Access to Foreign Currencies
Investing in foreign bonds can provide exposure to different currencies, offering potential gains from favorable exchange rate movements.
e. Inflation Protection
Certain bonds, such as inflation-indexed securities (like U.S. TIPS or U.K. Index-linked Gilts), adjust their principal and interest payments based on inflation, preserving real returns.
4. Risks in Global Bond Investing
While bonds are often viewed as safer than equities, they are not risk-free. Investing globally introduces additional layers of complexity.
a. Interest Rate Risk
Bond prices and interest rates move inversely. When global central banks raise rates, existing bonds with lower yields lose value. Hence, global investors must monitor monetary policies across major economies.
b. Credit Risk
There is a risk that the bond issuer may default on payments. Emerging-market bonds and corporate bonds typically carry higher credit risk compared to sovereign bonds of developed nations.
c. Currency Risk
Investing in bonds denominated in foreign currencies exposes investors to exchange rate fluctuations. For instance, if the U.S. dollar strengthens, returns from euro-denominated bonds may diminish for dollar-based investors.
d. Liquidity Risk
Certain bonds, especially those from smaller issuers or emerging markets, may have limited trading activity, making it difficult to sell them quickly without a price concession.
e. Geopolitical and Economic Risk
Global events such as wars, trade tensions, sanctions, and political instability can disrupt bond markets, particularly in developing regions.
5. Types of Global Bonds
a. Government Bonds
Issued by sovereign states, these bonds are considered the safest investments. Examples include:
U.S. Treasury Bonds – Global benchmark for risk-free rates.
German Bunds – The eurozone’s standard for stability.
Japanese Government Bonds (JGBs) – Used by investors seeking ultra-low yields but high safety.
b. Corporate Bonds
Issued by companies to raise capital. They offer higher yields than government bonds but with added credit risk. Global giants like Apple, Toyota, or Shell issue bonds accessible to global investors.
c. Emerging Market Bonds
Issued by developing economies (e.g., Brazil, India, South Africa). These bonds offer higher yields due to elevated risk but can be rewarding in periods of global growth.
d. Eurobonds
Issued in a currency different from the issuer’s home currency. For example, a Japanese company might issue dollar-denominated bonds in Europe. These instruments enhance global liquidity.
e. Green and Sustainable Bonds
An emerging category where proceeds are used for environmental or social projects. These have gained significant traction as investors prioritize ESG (Environmental, Social, and Governance) criteria.
6. Factors Influencing Global Bond Markets
a. Central Bank Policies
Interest rate decisions by central banks such as the U.S. Federal Reserve, European Central Bank, and Bank of Japan significantly impact bond yields globally. Quantitative easing and tightening cycles influence global liquidity and investor sentiment.
b. Inflation Trends
Rising inflation erodes real returns on fixed-income investments, leading investors to demand higher yields. Conversely, low inflation boosts bond prices.
c. Fiscal Deficits and Public Debt
Countries with large fiscal deficits may need to issue more bonds, influencing supply and yield levels. Investors also consider debt sustainability when investing globally.
d. Global Capital Flows
Institutional investors and sovereign wealth funds allocate massive capital across borders, affecting demand and yield spreads among regions.
e. Geopolitical and Economic Stability
Stable economies attract more bond investors. Events like Brexit, wars, or trade conflicts can trigger capital flight or yield volatility.
7. Strategies for Global Bond Investing
a. Active vs. Passive Investing
Active managers analyze global economic trends, interest rate expectations, and credit cycles to select bonds that may outperform. Passive investors, on the other hand, prefer bond index funds or ETFs that track global benchmarks such as the Bloomberg Global Aggregate Bond Index.
b. Currency Hedging
To mitigate currency risk, investors often use hedging tools like forward contracts or currency-hedged ETFs. This helps stabilize returns in home-currency terms.
c. Duration Management
Investors adjust portfolio duration based on interest rate outlooks. When rates are expected to rise, shorter-duration bonds are preferred to minimize price losses.
d. Credit Spread Analysis
Monitoring credit spreads — the yield difference between corporate and government bonds — helps investors gauge market sentiment and risk appetite.
e. Diversification Across Regions
Allocating investments across developed and emerging markets balances risk and return potential. For instance, combining U.S. Treasuries with Indian or Brazilian bonds can enhance yield without extreme exposure.
8. Role of Technology and Innovation
Technological innovation has transformed global bond investing. Electronic trading platforms have improved liquidity and transparency, while data analytics and artificial intelligence help investors identify opportunities faster.
Moreover, tokenized bonds — digital versions of traditional bonds traded on blockchain platforms — are emerging, promising greater accessibility and efficiency in global debt markets.
9. The Future of Global Bond Investing
The future of global bond markets will be shaped by several key trends:
Sustainability Focus: Growing demand for green and ESG-compliant bonds.
Digitalization: Blockchain-based issuance and trading to reduce costs.
Emerging Market Growth: As developing nations expand, their bond markets will attract more global investors.
Interest Rate Normalization: Following years of low or negative rates, the post-2020 era may witness gradual normalization, impacting bond valuations.
Geopolitical Realignment: Shifts in global power structures and currency preferences (e.g., de-dollarization trends) will influence international bond flows.
10. Conclusion
Investing in bonds in the global market offers investors a unique blend of safety, income stability, and diversification. While equities may deliver higher returns, bonds provide the essential balance in a diversified portfolio, helping manage risk and protect capital during volatile times.
However, success in global bond investing requires understanding complex factors — interest rate movements, currency dynamics, credit risks, and geopolitical developments. With proper strategy, diversification, and risk management, investors can harness the immense opportunities in the global bond market while safeguarding their wealth.
In an interconnected world, bonds remain not just a tool for income generation but a cornerstone of global financial stability. As economies evolve, technologies advance, and sustainability takes center stage, global bond investing will continue to adapt — offering investors both security and growth in an uncertain yet opportunity-rich financial landscape.

Risk in Global Market TradingIntroduction
Global market trading has revolutionized the way capital flows across borders, offering investors opportunities to diversify portfolios and seek higher returns. However, with these opportunities comes a complex landscape of risk. In today’s interconnected world, financial markets are influenced not only by domestic economic indicators but also by global monetary policies, geopolitical developments, and systemic events that can ripple across economies within minutes. Understanding risk in global market trading is, therefore, not merely a technical skill—it is a strategic necessity for investors, policymakers, and institutions alike.
Risk in global markets can manifest in numerous forms: market volatility, currency fluctuations, liquidity constraints, credit defaults, geopolitical instability, and systemic failures. Each type of risk interacts with others in dynamic and often unpredictable ways. This essay explores the multifaceted nature of risk in global market trading, the major types of risks faced by traders and investors, methods of risk assessment and mitigation, and the evolving landscape of risk management in the age of technology and globalization.
1. Understanding the Concept of Risk in Global Trading
In finance, risk refers to the potential for loss due to uncertainty about future outcomes. In global trading, risks are magnified because of exposure to multiple markets, asset classes, and currencies. These risks can stem from both systematic factors—such as global recessions, inflationary pressures, or changes in monetary policy—and unsystematic factors like firm-level management inefficiencies or localized political issues.
Risk is inherent to every trading decision. Global market participants—from institutional investors and hedge funds to retail traders—must therefore adopt robust risk management frameworks to identify, quantify, and manage potential losses. The challenge lies not only in measuring risk but also in anticipating the speed and scale at which it can materialize in interconnected markets.
2. Major Types of Risks in Global Market Trading
a) Market Risk
Market risk, also known as systematic risk, refers to the potential loss arising from adverse movements in market prices, including equity prices, interest rates, and commodity values. In global markets, volatility is driven by a complex interplay of macroeconomic trends, investor sentiment, and technological innovation. For instance, the 2008 financial crisis demonstrated how global equity markets can collapse simultaneously due to interconnected leverage structures and liquidity shortages.
Market risk can be categorized into:
Equity risk: arising from fluctuations in stock prices.
Interest rate risk: caused by unexpected changes in central bank rates or bond yields.
Commodity price risk: influenced by supply-demand dynamics, trade policies, and energy market disruptions.
Effective hedging through derivatives such as options and futures contracts is a key strategy to mitigate market risk in global trading.
b) Currency (Exchange Rate) Risk
In global trading, currency risk—or foreign exchange risk—is one of the most significant factors affecting profitability. Traders dealing in multiple currencies face potential losses due to fluctuations in exchange rates. For example, an Indian investor holding U.S. stocks may see returns decline if the U.S. dollar depreciates against the Indian rupee, even if the stock prices themselves rise.
Exchange rate risk arises from three primary exposures:
Transaction exposure: when settlements in foreign currencies are affected by exchange rate changes.
Translation exposure: when multinational companies consolidate financial statements from subsidiaries in different currencies.
Economic exposure: reflecting the broader impact of exchange rate movements on a firm’s competitiveness and cash flows.
Traders often use forward contracts, currency swaps, or natural hedging (offsetting currency inflows and outflows) to manage foreign exchange risks effectively.
c) Credit Risk
Credit risk arises when a counterparty fails to fulfill its contractual obligations—such as in derivative transactions, margin trading, or securities lending. In global markets, the interdependence of institutions amplifies this risk. The collapse of Lehman Brothers in 2008 is a stark reminder of how the default of one major entity can trigger widespread systemic consequences.
Credit risk management involves assessing counterparties’ creditworthiness, setting exposure limits, and using credit derivatives such as credit default swaps (CDS) to hedge against potential losses.
d) Liquidity Risk
Liquidity risk occurs when traders are unable to buy or sell assets quickly enough to prevent or minimize losses. In times of financial stress, even highly rated assets can become illiquid, leading to sharp declines in prices. The global financial crisis demonstrated how liquidity dry-ups can paralyze entire markets.
There are two types of liquidity risk:
Market liquidity risk: when there are not enough buyers or sellers.
Funding liquidity risk: when an institution cannot meet short-term obligations due to cash flow shortages.
To mitigate liquidity risk, traders maintain diversified portfolios, establish credit lines, and implement stress-testing mechanisms that simulate liquidity crunches.
e) Political and Geopolitical Risk
Global trading is highly sensitive to political developments, regulatory changes, and international conflicts. Geopolitical risk encompasses factors such as wars, sanctions, trade disputes, and regime changes that can disrupt financial flows and investor confidence. For example, the Russia-Ukraine conflict significantly impacted energy markets, commodities, and foreign exchange rates worldwide.
Political risk also includes changes in taxation policies, foreign investment restrictions, or sudden nationalization of assets. Investors often mitigate these risks through geographical diversification, political risk insurance, and by closely monitoring global news and policy trends.
f) Operational and Technological Risk
Operational risk arises from failures in internal processes, systems, or human errors. In global markets that rely heavily on high-frequency trading (HFT) and algorithmic systems, technological failures can cause severe disruptions. Cybersecurity threats—such as hacking of trading platforms or data breaches—pose additional layers of operational risk.
To manage these risks, institutions invest in robust IT infrastructure, enforce compliance protocols, and develop contingency plans to ensure business continuity in the event of system failures or cyber incidents.
g) Systemic and Contagion Risk
Systemic risk refers to the potential collapse of an entire financial system due to the failure of interconnected participants. The globalization of finance has heightened this risk, as crises in one region can rapidly spread to others—a phenomenon known as contagion. The Asian Financial Crisis (1997) and the Global Financial Crisis (2008) illustrated how cross-border linkages in banking and capital markets can amplify local shocks into global turmoil.
Central banks and regulators attempt to contain systemic risk through macroprudential policies, capital adequacy requirements, and coordinated international responses.
3. Measuring and Managing Risk in Global Markets
Effective risk management relies on both quantitative analysis and strategic oversight. Some of the key methods include:
a) Value at Risk (VaR)
Value at Risk estimates the maximum potential loss of a portfolio over a specific time period with a given confidence level. It is a standard tool for quantifying market risk.
b) Stress Testing and Scenario Analysis
These techniques simulate extreme market conditions (e.g., a global recession, oil shock, or currency collapse) to assess how portfolios would perform under stress.
c) Diversification
Diversifying assets across geographies, industries, and currencies reduces exposure to any single source of risk.
d) Hedging with Derivatives
Options, futures, swaps, and other derivatives allow traders to offset potential losses from adverse price movements.
e) Risk-Adjusted Performance Metrics
Metrics such as the Sharpe ratio and Treynor ratio help traders evaluate returns relative to the level of risk undertaken.
f) Regulatory and Compliance Frameworks
Global financial institutions are governed by frameworks like Basel III (for banks) and MiFID II (for European markets), which set standards for risk management, leverage, and transparency.
4. The Role of Technology in Risk Management
Technological advancements have transformed risk management in global trading. Artificial intelligence (AI), machine learning (ML), and big data analytics enable real-time risk monitoring and predictive modeling. Algorithms can detect patterns of volatility, forecast potential price shocks, and execute hedging strategies within milliseconds.
Blockchain technology enhances transparency and reduces counterparty risks by providing immutable transaction records. Meanwhile, RegTech (Regulatory Technology) automates compliance processes, ensuring that firms adhere to global regulations efficiently.
However, technology itself introduces new risks—such as model risk (errors in algorithmic assumptions) and cyber risk—which require ongoing vigilance.
5. The Interconnected Nature of Global Risk
Global markets do not operate in isolation. An event in one market—such as a policy shift by the U.S. Federal Reserve or a slowdown in China’s economy—can influence currencies, commodities, and equities worldwide. The COVID-19 pandemic was a striking example of how health crises can evolve into financial crises, disrupting global supply chains and triggering market panic.
Therefore, traders and investors must adopt a holistic approach to risk, recognizing the interdependence of financial systems. Global coordination among regulators and central banks, along with international cooperation through institutions like the IMF and World Bank, is essential for maintaining stability.
6. Emerging Risks in the Modern Trading Landscape
The future of global trading brings new categories of risks:
Climate risk: Extreme weather events and regulatory shifts toward green energy affect asset valuations and commodity prices.
Cyber risk: Increasing digitalization exposes markets to hacking and data theft.
AI and algorithmic trading risk: Autonomous trading systems can cause flash crashes if algorithms malfunction.
Regulatory divergence: As nations adopt differing post-crisis regulations, cross-border compliance becomes complex.
Social and reputational risk: Public sentiment, ESG (Environmental, Social, and Governance) issues, and social media trends increasingly influence market behavior.
7. Strategies for Effective Global Risk Governance
An effective risk governance framework integrates strategic oversight with operational discipline:
Establish clear risk appetite and tolerance limits.
Develop independent risk management functions to oversee exposures.
Foster a risk-aware culture across all levels of an organization.
Continuously update risk models based on evolving market data.
Enhance communication and transparency between traders, regulators, and investors.
Conclusion
Risk in global market trading is both inevitable and indispensable. Without risk, there would be no return; yet unmanaged risk can lead to catastrophic losses. As globalization deepens and markets become more interlinked, traders face a web of challenges—from market volatility and currency fluctuations to technological vulnerabilities and systemic contagion.
The key to thriving in this environment lies in understanding, measuring, and managing these risks with precision and foresight. By combining advanced analytics, diversified strategies, strong governance, and adaptive technologies, market participants can navigate uncertainty and harness global opportunities while safeguarding their capital. In essence, successful global trading is not about avoiding risk—but mastering it.

Quantitative and Algorithmic Trading in the Global MarketIntroduction
In the ever-evolving world of financial markets, quantitative and algorithmic trading have emerged as the twin engines powering modern investment and trading strategies. They represent the fusion of finance, mathematics, statistics, and computer science to create data-driven, rule-based systems capable of executing trades with precision and speed beyond human capability. Over the past three decades, these methods have transformed global trading dynamics — reshaping liquidity, price discovery, and even the structure of exchanges. Quantitative and algorithmic trading now dominate trading volumes in equities, forex, commodities, and derivatives markets worldwide.
This essay explores the concepts, strategies, technologies, advantages, and risks associated with quantitative and algorithmic trading, as well as their impact on global financial markets.
Understanding Quantitative and Algorithmic Trading
Quantitative trading refers to the use of mathematical and statistical models to identify trading opportunities. It relies heavily on quantitative analysis, which involves collecting large sets of historical and real-time market data, identifying patterns, and forecasting potential price movements. Quantitative traders, often called “quants,” use sophisticated models to test hypotheses and develop systematic strategies for profit generation.
Algorithmic trading (Algo trading), on the other hand, is the practical implementation of these quantitative models through computer algorithms that automatically execute trades. It involves predefined instructions that specify when, how, and how much to trade, based on parameters such as timing, price, volume, and market conditions.
In simple terms, quantitative trading focuses on the “why” — the logic and mathematical framework — while algorithmic trading handles the “how” — the automation and execution of the strategy.
Historical Evolution
The roots of quantitative trading can be traced back to the 1970s when computers were first used for portfolio optimization and risk management. Pioneers like Edward Thorp, the author of Beat the Market, applied probability theory to stock trading and option pricing, laying the foundation for quant finance.
The 1980s and 1990s witnessed the rise of electronic trading platforms, which enabled automated order matching. Firms like Renaissance Technologies and D.E. Shaw built statistical arbitrage models that consistently delivered high returns using advanced mathematics.
By the 2000s, algorithmic trading became mainstream, aided by technological progress, faster data transmission, and regulatory changes such as the U.S. SEC’s approval of electronic communication networks (ECNs). High-Frequency Trading (HFT) — the fastest form of algorithmic trading — emerged, executing thousands of orders in milliseconds. Today, more than 70% of equity trades in developed markets like the U.S. and Europe are executed algorithmically.
Core Components of Quantitative and Algorithmic Trading
Data Acquisition and Management
Data is the lifeblood of quantitative trading. Traders collect massive datasets — historical prices, order book information, news sentiment, economic indicators, and alternative data such as satellite images or social media trends. This data is cleaned, normalized, and stored for analysis using advanced databases and cloud computing systems.
Model Development and Backtesting
Quant models are developed using statistical and machine learning techniques to forecast price movements or detect inefficiencies. Backtesting evaluates these models on historical data to verify performance and robustness before deployment in live markets.
Execution Algorithms
Algorithms are designed to execute trades efficiently while minimizing market impact and transaction costs. Common execution algorithms include Volume Weighted Average Price (VWAP), Time Weighted Average Price (TWAP), and Percentage of Volume (POV).
Risk Management Systems
Every quantitative model includes strict risk controls — such as stop-loss mechanisms, position limits, and exposure checks — to protect against unforeseen market events and model failures.
Infrastructure and Technology
Cutting-edge hardware, low-latency networks, and co-location services (placing trading servers near exchange data centers) are essential for high-frequency and algorithmic trading. Millisecond delays can mean the difference between profit and loss.
Types of Quantitative and Algorithmic Strategies
Statistical Arbitrage
This involves exploiting short-term price inefficiencies between related securities. For instance, pairs trading identifies two correlated assets — when their price relationship diverges, one is bought and the other is sold short, expecting reversion to the mean.
Trend-Following Models
These algorithms capitalize on persistent market trends using indicators like moving averages or momentum oscillators. When the price breaks above a defined resistance, a buy signal is triggered.
Mean Reversion Strategies
Based on the idea that prices tend to revert to their long-term average, these models look for overbought or oversold conditions.
Market Making Algorithms
Market makers continuously quote buy and sell prices, earning the bid-ask spread while providing liquidity. Algorithms dynamically adjust quotes based on volatility and order flow.
High-Frequency Trading (HFT)
HFT strategies execute thousands of trades per second to exploit micro-inefficiencies. Techniques include latency arbitrage and order anticipation.
Machine Learning-Based Strategies
Modern quants increasingly use artificial intelligence and deep learning models to analyze nonlinear patterns in large datasets, from news sentiment to macroeconomic variables.
Event-Driven Trading
Algorithms react to real-time events such as earnings announcements, mergers, or geopolitical developments. For example, a positive earnings surprise may trigger a buy signal.
Index Arbitrage and ETF Strategies
These exploit price differences between index futures, exchange-traded funds, and their underlying constituents.
Quantitative and Algorithmic Trading in Major Global Markets
United States
The U.S. is the global hub of algorithmic trading, accounting for the majority of automated volume. Major exchanges like NASDAQ and NYSE provide low-latency access, and firms such as Citadel Securities, Renaissance Technologies, and Jane Street dominate market making and quant strategies.
Europe
European markets, regulated under MiFID II, emphasize transparency and fairness in algorithmic trading. London remains a major center for hedge funds and algorithmic firms.
Asia-Pacific
Algorithmic trading is rapidly expanding in markets like Japan, Singapore, Hong Kong, and India. In India, the National Stock Exchange (NSE) supports co-location and direct market access, making it one of the fastest-growing algorithmic ecosystems.
Emerging Markets
Countries such as Brazil, South Africa, and the Middle East are adopting algorithmic platforms, although liquidity and infrastructure remain developmental challenges.
Benefits of Quantitative and Algorithmic Trading
Speed and Efficiency
Algorithms execute orders within microseconds, allowing traders to capture fleeting market opportunities impossible for humans to detect manually.
Reduced Human Bias
Trading decisions are based on predefined logic rather than emotion, minimizing psychological biases such as fear and greed.
Lower Transaction Costs
Smart order routing and optimal execution algorithms reduce slippage and market impact, enhancing profitability.
Liquidity Enhancement
Market-making algorithms continuously provide buy and sell orders, improving liquidity and narrowing bid-ask spreads.
Scalability
A single algorithm can manage thousands of securities across global markets simultaneously, offering unmatched scalability.
Backtesting and Optimization
Quantitative systems can be tested extensively on historical data, refining strategies before real-world application.
Risks and Challenges
Despite their advantages, quantitative and algorithmic trading come with significant risks:
Model Risk
Models are based on assumptions that may fail under changing market conditions. A small coding error or mis-specified model can cause massive losses.
Overfitting and Data Snooping
Over-optimization of models on historical data can produce unrealistic results that fail in live trading.
Liquidity and Flash Crashes
Excessive algorithmic activity can amplify volatility. The 2010 U.S. “Flash Crash” highlighted how algorithmic feedback loops could trigger rapid market collapses.
Regulatory Risk
Regulators globally are tightening oversight of algorithmic trading to prevent manipulation and ensure fairness. Compliance costs and monitoring requirements are rising.
Technology Failures
System outages, latency issues, or cyberattacks can disrupt trading and cause severe financial losses.
Competition and Market Saturation
As more participants adopt similar strategies, profit margins shrink, and edge becomes increasingly difficult to maintain.
Regulatory Framework and Global Standards
Regulators worldwide are implementing rules to govern algorithmic and high-frequency trading.
In the United States, the SEC and CFTC monitor automated trading for fairness, requiring disclosure of algorithms and pre-trade risk checks.
In Europe, MiFID II mandates firms to test algorithms, maintain kill-switch mechanisms, and provide detailed audit trails.
In India, SEBI regulates algorithmic trading by requiring pre-approval, audit certification, and real-time risk management systems.
These measures aim to balance innovation with market integrity and investor protection.
Technological Advancements Driving the Future
The next phase of quantitative and algorithmic trading will be shaped by technologies such as:
Artificial Intelligence and Deep Learning – Algorithms that learn autonomously from new data, improving accuracy over time.
Natural Language Processing (NLP) – Automated interpretation of news, tweets, and reports to derive trading signals.
Quantum Computing – Offering unprecedented processing power for portfolio optimization and complex simulations.
Blockchain Integration – Enhancing transparency, settlement efficiency, and security in algorithmic transactions.
Cloud Computing and Big Data – Allowing scalable data storage and computation across global markets in real time.
Impact on Global Market Dynamics
Quantitative and algorithmic trading have profoundly reshaped market structure. They have enhanced liquidity, tightened spreads, and accelerated price discovery. However, they also contribute to short-term volatility and market fragmentation across multiple venues.
Institutional investors now compete with sophisticated algorithms, while retail traders benefit indirectly through lower costs and better execution. Exchanges have evolved to accommodate high-speed connectivity, and data analytics has become a core asset for every financial institution. The global market, once driven by intuition and human judgment, is now governed largely by algorithms and machine intelligence.
Conclusion
Quantitative and algorithmic trading represent the pinnacle of financial innovation, combining mathematics, computation, and automation to redefine how markets operate. They have democratized access to efficient trading tools while challenging traditional notions of value, speed, and human decision-making.
Yet, with great power comes great responsibility — ensuring transparency, ethical deployment, and robust regulation will determine the sustainable future of algorithmic trading. As artificial intelligence and data science advance further, quantitative trading will continue to evolve, shaping global markets that are faster, smarter, and more interconnected than ever before.