Liquidity in Trading: The Basics You Must Understand👉 If you can’t identify liquidity, you become the liquidity.
It's not an indicator, It's not a pattern. It's not a theory.
It's how the markets actually move.
Every trader has seen it happen: you take a position at the “obvious” level, only to get stopped out by a quick wick — and then the market runs exactly where you expected. That wasn’t bad luck. That was liquidity.
In this post, you’ll learn few main forms of liquidity that move markets and how to avoid being stop hunted and actually use such a phenomena for your advantage.
Don't be a liquidity
Price doesn’t move randomly inside ranges. It hunts liquidity at the edges.
• Retail trap: Traders pile orders right at the range high/low.
• Smart money: Hunt's edges of range before starting the move.
Wait for the sweep of those levels. The stop runs happen first, the real move comes after.
⚠️ If a pivot level gets tapped multiple times, it's on purpose. Smart money are creating illusion of strong support / Resistance.
Les informed traders trades patterns like : Double bottom, Double top and they put the stop losses above the range - This creates a Liquidity cluster which smart money needs to execute their orders. They will come for it before the real move happen.
How to enter continuation
Even in strong trends, price doesn’t move in straight lines.
• Consolidation → Expansion: Liquidity builds during pullbacks or sideways pauses, then gets released in a sharp move.
• Retracement → Expansion: don’t chase the first pullback. Wait for at least 50% pullbacks. Not earlier. Best setup is when it has all like the one below.
Double top as liquidity, range, 50% pullback , stop hunt
• Double tops and Triple tops are engendered liquidity if you see it expect price go thru that levels
The win isn’t catching the exact bottom. It’s catching a clean entry with strong Trend continuation - low timeframe reversal and with right timeframe allignements.
So here is again GBPUSD example where we had the weekly range, stop hunt to 50% of the swing.
After stop hunt occurs you wait for. H4 OB being created in other words engulf of last bulky down candle and clean close above. Then you can enter with SL below the stop hunted lows, not only that traders was liquidated there but also another group of traders entered shorts and they will be now liquidated above that double top and its your target.
Importance of key level
Even when smart money moves price to the highs where it seems there is not key level always look left price mostly stop just right above or below the key level. Ranges for some time makes false move in the direction which sucks traders in to to a trade and then they hit key level and go that direction.
If the move is not going from key level it's a trap. We can use many types of levels, but here is a tip for the forex Whole, quarter, half levels are strong. If your order block, supply / demand occurs or classic support occurs around that level it will have higher probability and its not because of psychological level. It's because these levels are what institutions are trading.
Stop hunts are not your enemy — unless you ignore it. The market makers hunts liquidity before it moves. By starting thinking about the markets this was way you will recognize and will be able to visualize future movements.
Summary
Big challenge is waiting patiently for the stop hunt to happen. And yes sometimes price moves without a stop hunt and you will miss a move. But it's always better not to be in a trade you want to be than being In trade you dont want to be.
Shift from being the exit liquidity to being the trader who patiently waits, confirms, and executes with precision.
🩸 Spot the trap. 🩸 Wait for the sweep. 🩸 Trade with intention.
Dont trust me and fact check this on your chart for your confidence. It's only way to start to see markets differently.
David Perk aka Dave FX Hunter
X-indicator
Commodity Futures Trading in the Global Market1. Historical Evolution of Commodity Futures Trading
Ancient Trading Roots
Commodity trading dates back thousands of years, with evidence from Mesopotamia and Ancient Greece showing contracts for the future delivery of crops.
In Japan during the 17th century, rice futures were traded at the Dojima Rice Exchange, one of the earliest organized futures markets.
The Chicago Board of Trade (CBOT)
Established in 1848, CBOT standardized forward contracts into formal futures contracts.
Grain farmers in the U.S. Midwest needed to protect themselves against unpredictable prices, while buyers wanted stable supply at predictable rates.
Futures contracts solved this by locking in future delivery prices, reducing uncertainty.
Expansion to Other Commodities
After grains, futures expanded to include livestock, metals, energy, and eventually financial instruments like currencies and interest rates.
By the late 20th century, futures markets had become central not just to commodities but also to global finance.
2. Fundamentals of Commodity Futures
What is a Futures Contract?
A futures contract is a standardized agreement to buy or sell a commodity at a specific price on a future date, traded on an organized exchange.
Key features:
Standardization – Each contract specifies quantity, quality, and delivery terms.
Margin and Leverage – Traders post margin (collateral) to participate, giving them leverage.
Clearinghouses – Ensure counterparty risk is minimized.
Expiration & Settlement – Contracts either settle physically (delivery of the commodity) or financially (cash-settled).
Types of Commodities Traded
Agricultural Commodities – Wheat, corn, soybeans, coffee, sugar, cotton.
Energy Commodities – Crude oil, natural gas, gasoline, heating oil.
Metals – Gold, silver, copper, aluminum, platinum.
Soft Commodities – Cocoa, rubber, palm oil.
3. Key Participants in Global Commodity Futures
1. Hedgers
Farmers, miners, oil producers, airlines, and manufacturers use futures to protect against price volatility.
Example: An airline buys jet fuel futures to lock in prices and protect against oil price spikes.
2. Speculators
Traders who take positions based on price expectations, seeking profits rather than delivery.
Provide liquidity to the market but also increase volatility.
3. Arbitrageurs
Exploit price discrepancies across markets or between spot and futures prices.
Help align prices globally.
4. Institutional Investors
Hedge funds, mutual funds, pension funds use commodity futures for diversification and inflation hedging.
5. Market Makers & Brokers
Facilitate transactions, ensuring continuous liquidity.
4. Global Commodity Futures Exchanges
United States
Chicago Mercantile Exchange (CME Group) – World’s largest futures exchange, trading agricultural, energy, metals, and financial futures.
New York Mercantile Exchange (NYMEX) – Key hub for energy futures like crude oil and natural gas.
Intercontinental Exchange (ICE) – Specializes in energy and soft commodities like coffee, cocoa, and sugar.
Europe
London Metal Exchange (LME) – Benchmark for industrial metals like copper, aluminum, and nickel.
Euronext – Trades agricultural and financial futures in Europe.
Asia
Shanghai Futures Exchange (SHFE) – Major player in metals, energy, and chemicals.
Multi Commodity Exchange of India (MCX) – Leading Indian commodity exchange.
Tokyo Commodity Exchange (TOCOM) – Focuses on energy, metals, and rubber.
Singapore Exchange (SGX) – Emerging hub for global commodities, especially Asian benchmarks.
5. Mechanics of Commodity Futures Trading
1. Opening a Position
Long position (buy futures) if expecting prices to rise.
Short position (sell futures) if expecting prices to fall.
2. Margin System
Initial margin: Upfront collateral to open a position.
Maintenance margin: Minimum balance required.
Daily mark-to-market adjusts accounts based on price movements.
3. Settlement Methods
Physical delivery: Actual exchange of the commodity.
Cash settlement: Price difference settled in cash, common for financial futures.
4. Price Discovery
Futures markets reflect expectations of supply and demand.
Example: Rising oil futures may signal geopolitical risks or expected shortages.
6. Importance of Commodity Futures in the Global Economy
1. Risk Management
Producers and consumers hedge against adverse price swings.
2. Price Discovery
Futures prices act as benchmarks for global trade.
Example: Brent crude futures influence oil prices worldwide.
3. Market Liquidity
Continuous trading provides deep liquidity, enabling efficient transactions.
4. Economic Indicators
Futures prices offer insights into future economic trends (e.g., rising copper prices suggest industrial growth).
7. Challenges and Criticisms
1. Speculative Excess
Excessive speculation can cause price bubbles, hurting real producers and consumers.
Example: 2008 oil price surge partly attributed to speculative trading.
2. Volatility & Market Shocks
Futures markets can amplify volatility, especially during geopolitical or weather-related events.
3. Market Manipulation
Large players can influence prices (e.g., "cornering the market").
4. Regulatory Concerns
Need for global harmonization as futures markets are interconnected.
8. Regulation of Global Commodity Futures
United States
Commodity Futures Trading Commission (CFTC) oversees futures and options markets.
Europe
European Securities and Markets Authority (ESMA) sets regulations under MiFID II.
Asia
Each country has its regulator: SEBI (India), CSRC (China), FSA (Japan).
Global Cooperation
IOSCO (International Organization of Securities Commissions) works on harmonizing standards.
9. Technological Transformation in Commodity Futures
Electronic Trading
Transition from open-outcry trading floors to electronic platforms like CME Globex.
Algorithmic & High-Frequency Trading (HFT)
Now dominate volumes, enabling faster price discovery but raising flash crash risks.
Blockchain & Smart Contracts
Potential to streamline settlement, reduce fraud, and improve transparency.
10. Case Studies
Oil Futures (NYMEX WTI & ICE Brent)
Key benchmarks for global crude oil pricing.
The 2020 COVID-19 crisis saw WTI futures turn negative, highlighting the complexities of storage and physical delivery.
Gold Futures (COMEX)
A hedge against inflation and financial instability.
Demand spikes during geopolitical crises or economic uncertainty.
Agricultural Futures (Chicago Board of Trade)
Corn, wheat, and soybean futures directly impact global food prices.
Conclusion
Commodity futures trading is more than just speculation—it is the nervous system of the global economy. From farmers securing prices for their harvest to airlines hedging jet fuel, and from speculators driving liquidity to regulators ensuring stability, futures markets are indispensable.
They provide transparency, risk management, and global price discovery. Yet they also bring challenges of volatility, speculation, and regulatory complexity.
Looking ahead, technological innovation, sustainability concerns, and the rise of emerging markets will reshape global commodity futures trading. Its importance will only grow as commodities remain the backbone of human survival, industrialization, and energy security.
Exchange-Traded Funds (ETFs) & Index TradingPart I: Understanding Exchange-Traded Funds (ETFs)
1. What are ETFs?
An Exchange-Traded Fund (ETF) is an investment vehicle that holds a basket of assets—such as stocks, bonds, commodities, or currencies—and trades on stock exchanges like a single stock.
Structure: ETFs are designed to track the performance of an underlying index, sector, commodity, or strategy.
Trading: Unlike mutual funds (which are priced once a day), ETFs trade continuously throughout the trading day, with prices fluctuating based on supply and demand.
Flexibility: ETFs can be bought and sold just like stocks, enabling short-selling, margin trading, and intraday strategies.
In essence, ETFs combine the diversification of mutual funds with the flexibility of stocks.
2. History and Evolution of ETFs
The first ETF, SPDR S&P 500 ETF Trust (SPY), was launched in 1993 in the United States. It aimed to track the S&P 500 Index, giving investors exposure to the 500 largest U.S. companies in a single instrument.
Since then, the ETF industry has exploded globally:
1990s: Launch of broad-market ETFs (SPY, QQQ).
2000s: Expansion into sector-based and international ETFs.
2010s: Rise of smart beta and thematic ETFs (e.g., clean energy, robotics, AI).
2020s: Growth in actively managed ETFs, ESG-focused ETFs, and crypto ETFs (like Bitcoin futures ETFs).
Today, ETFs account for trillions of dollars in global assets under management (AUM), making them one of the fastest-growing investment products.
3. Types of ETFs
ETFs come in different forms to suit various investor needs:
Equity ETFs – Track stock indices like S&P 500, Nifty 50, Nasdaq-100.
Bond ETFs – Provide exposure to government, corporate, or municipal bonds.
Commodity ETFs – Track commodities like gold, silver, or oil.
Currency ETFs – Track currency movements (e.g., U.S. Dollar Index ETF).
Sector & Industry ETFs – Focus on sectors like technology, healthcare, or banking.
International & Regional ETFs – Give exposure to markets like China, Europe, or emerging markets.
Inverse & Leveraged ETFs – Provide magnified or opposite returns of an index (used for short-term trading).
Thematic ETFs – Target specific investment themes (renewable energy, AI, blockchain).
Actively Managed ETFs – Managed by fund managers who actively pick securities.
4. How ETFs Work (Mechanics)
ETFs use a creation and redemption mechanism to keep their market price close to the net asset value (NAV).
Authorized Participants (APs): Large institutions that create or redeem ETF shares.
Creation: APs deliver a basket of securities to the ETF provider in exchange for new ETF shares.
Redemption: APs return ETF shares and receive the underlying securities.
This arbitrage mechanism ensures that ETF prices remain close to the value of their underlying assets.
5. Advantages of ETFs
Diversification – Exposure to hundreds of securities in one trade.
Liquidity – Trade throughout the day on exchanges.
Cost Efficiency – Lower expense ratios compared to mutual funds.
Transparency – Daily disclosure of holdings.
Flexibility – Options, margin trading, and short-selling available.
Tax Efficiency – Creation/redemption process reduces taxable distributions.
6. Disadvantages of ETFs
Trading Costs – Brokerage fees and bid-ask spreads can add up.
Tracking Error – ETFs may not perfectly track their underlying index.
Overtrading Risk – Intraday liquidity may encourage speculative behavior.
Leverage & Inverse ETFs Risks – Can lead to significant losses if misunderstood.
Concentration in Popular Sectors – Certain thematic ETFs may be too niche or volatile.
Part II: Index Trading
1. What is an Index?
An index is a statistical measure representing the performance of a group of securities. Examples:
S&P 500 (USA): 500 largest U.S. companies.
Nifty 50 (India): 50 largest companies listed on NSE.
Dow Jones Industrial Average: 30 U.S. blue-chip companies.
Indices serve as benchmarks to measure market or sector performance.
2. What is Index Trading?
Index trading refers to trading financial products based on stock market indices rather than individual stocks.
Investors trade:
Index Futures – Contracts based on future value of an index.
Index Options – Options contracts linked to indices.
ETFs & Index Funds – Indirect way to trade indices.
CFDs (Contracts for Difference): Widely used in global markets.
3. Why Trade Indices?
Diversification – Exposure to entire markets or sectors.
Hedging – Protect portfolios from market downturns.
Speculation – Bet on broad market movements.
Benchmarking – Compare portfolio performance against indices.
4. Popular Global Indices
USA: S&P 500, Nasdaq-100, Dow Jones.
India: Nifty 50, Sensex, Bank Nifty.
Europe: FTSE 100 (UK), DAX 40 (Germany), CAC 40 (France).
Asia: Nikkei 225 (Japan), Hang Seng (Hong Kong), Shanghai Composite (China).
5. Strategies in Index Trading
Buy-and-Hold Strategy: Long-term investment in index ETFs.
Swing Trading: Trading short-to-medium-term index price movements.
Hedging: Using index futures to hedge stock portfolios.
Arbitrage: Exploiting mispricing between futures, ETFs, and underlying stocks.
Sector Rotation: Moving investments between indices/sectors depending on the economic cycle.
Options Strategies: Using index options for spreads, straddles, or covered calls.
Part III: ETFs vs. Index Funds vs. Index Trading
ETFs – Trade on exchanges, intraday pricing, lower costs.
Index Funds – Mutual funds tracking indices, priced once daily.
Index Trading (Futures/Options) – Derivatives-based, high leverage, short-term focus.
Example:
Long-term investor → Index Fund or ETF.
Active trader → Index futures, options, or leveraged ETFs.
Part IV: Risks in ETFs & Index Trading
Market Risk – Both ETFs and indices reflect market movements.
Liquidity Risk – Low-volume ETFs may have wide spreads.
Tracking Error – ETFs may deviate from index returns.
Leverage Risk – Amplified losses in leveraged ETFs/futures.
Currency Risk – International ETFs affected by forex fluctuations.
Concentration Risk – Indices may be dominated by a few large companies (e.g., FAANG in S&P 500).
Part V: ETFs & Index Trading in India
India has seen tremendous growth in ETFs and index trading:
Popular ETFs: Nippon India ETF Nifty BeES, SBI ETF Nifty Bank, ICICI Prudential Nifty Next 50 ETF.
Gold ETFs: Widely used as an alternative to physical gold.
Sector ETFs: Banking, IT, PSU ETFs gaining traction.
Index Futures/Options: Nifty 50 and Bank Nifty derivatives dominate NSE trading volumes.
Government and institutional investors (like EPFO) also allocate large sums to ETFs, boosting the industry further.
Part VI: Future of ETFs & Index Trading
Rise of Thematic & ESG ETFs – Growth in socially responsible investing.
Active ETFs – Managers offering active strategies via ETFs.
Crypto ETFs – Bitcoin and Ethereum ETFs expanding.
Tokenization & Blockchain ETFs – Future of transparent, decentralized ETF structures.
AI-driven Index Construction – Smart beta indices built using machine learning.
Conclusion
Exchange-Traded Funds (ETFs) and Index Trading have reshaped the way investors approach financial markets. They offer simplicity, diversification, transparency, and cost-effectiveness, making them ideal for both beginners and professionals.
ETFs provide access to a wide range of assets, from equities and bonds to commodities and currencies.
Index trading allows traders to speculate, hedge, or invest in entire markets rather than individual stocks.
Together, they represent the future of investing: efficient, scalable, and adaptable to changing global market trends.
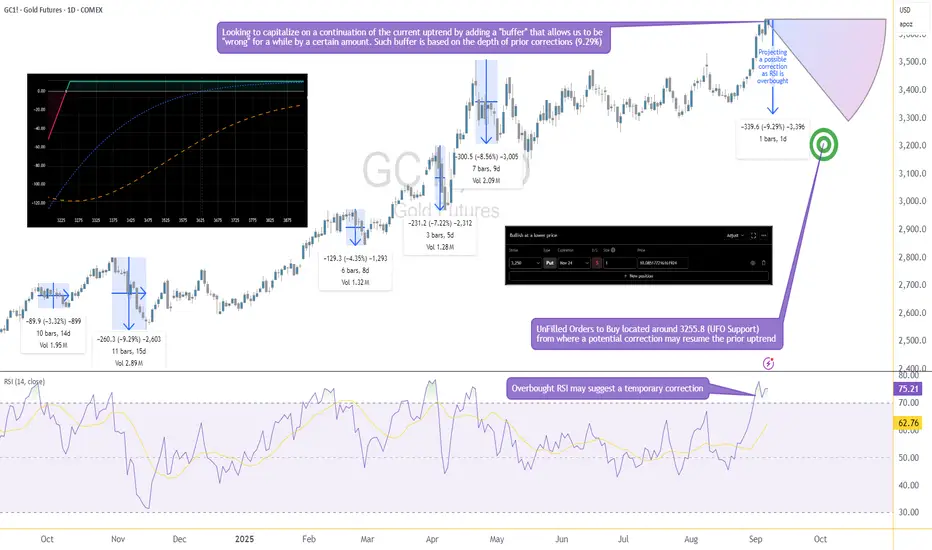
Options Blueprint Series [Basic]: Gold Income or Bargain Entry?The Setup: A Pullback with a Plan
Gold has been riding a strong bullish wave, yet momentum indicators suggest it's time for a breather. RSI is now overbought, and if history repeats, we could see a healthy correction of up to 9.29%, in line with prior pullbacks. This projects price near 3255, where we also find a cluster of UnFilled Orders (UFOs) acting as a potentially relevant support. It’s a key price area where buyers may step in again.
Rather than try to perfectly time the correction or the bottom, we’re applying a more forgiving approach: selling a PUT far below current price—generating income while leaving room to be wrong by over 375 points.
This is not a hedge. This is a standalone income strategy that accepts risk but frames it intelligently using technical context and options structure.
The Strategy: Selling the 3250 PUT on GC
We're using a simple but powerful strategy—selling a naked PUT—which can generate income or result in ownership of Gold at a deep discount if price dips.
Underlying Asset: GCZ2025 – using Gold Futures Options (Nov 24 2025 Expiration)
Strategy: Sell 1x 3250 PUT
Premium Collected: 10.09 points ≈ $1,009
Breakeven Price: 3240
Max Profit: $1,009 (if Gold stays above 3250 until expiration)
Max Risk: Unlimited below breakeven
There are two possible outcomes here:
Gold stays above 3250 → we keep the full premium.
Gold drops below 3250 → we get assigned and become long GC at 3250. From there, we’re exposed to downside risk in Gold, with a breakeven at 3240.
The position benefits from time decay and stable to rising prices, but it does carry the full downside exposure of long Gold futures if the trade moves against us.
We want to be very clear here—this is a naked trade with undefined risk. That doesn’t make it reckless if done with sizing discipline and technical alignment, but it’s not a beginner-friendly strategy.
Gold Contract Specs
Understanding the size and risk of what you're trading is critical—especially with naked options.
✅ GC – Gold Futures (Full Size)
Symbol: GC
Contract Size: 100 troy ounces
Tick Size: 0.10 = $10
Point Value: 1 point = $100
Initial Margin (as of Sep 2025): ~$15,000 per contract (subject to change)
Underlying for the Option: GC Futures
✅ MGC – Micro Gold Futures
Symbol: MGC
Contract Size: 10 troy ounces
Tick Size: 0.10 = $1
Point Value: 1 point = $10
Initial Margin: ~$1,500 per contract (subject to change)
Why does this matter?
Because if GC collapses below 3250 and you're assigned long, you’ll be exposed to full-size futures. That’s $100 per point of movement. A 50-point drop? That's $5,000 in unrealized loss.
That’s where MGC becomes your best ally. Micro Gold futures offer a scalable way to hedge. If price begins moving down or breaks below the support zone, one could short MGC against the Short GC 3250 PUT to cap further losses or rebalance directional exposure with reduced size and margin impact.
The Technical Confluence: Where Structure Meets Strategy
The 3250 strike isn’t just a random number—it’s calculated. Historical RSI-based corrections in Gold have shown recent worse-case scenarios around 9.29%, and projecting that from recent highs lands us precisely near the 3255 zone. This level also aligns with a clear UFO support, where institutional buyers have likely left behind unfilled orders.
That confluence—statistical retracement, technical indicator, and order flow support—gives the 3250 strike an interesting probability structure. Selling a Put beneath it means we are placing our bet below the “floor” and getting paid while we wait.
If Gold never corrects that far, we profit.
If it does, we might get long near a historically meaningful level.
There’s no need to catch the top. There’s no need to nail the bottom.
Just structure the trade where the odds are already potentially skewed in your favor.
Trade Plan: Reward, Risk & Realism
This trade isn’t about precision entry or leveraged glory—it’s about risk-defined logic with a cash-flow twist. Here's the full breakdown:
🧠 Trade Parameters
Strategy: Sell 1x Gold Futures 3250 PUT Options
Premium Collected: 10.09 points = $1,009
Point Value (GC): $100/point
Breakeven Price: 3240 (3250 – 10)
Expiration: Nov 24, 2025
🟩 If Gold Stays Above 3250
You keep the full premium → $1,009 profit
🟥 If Gold Falls Below 3250
You may be assigned 1 GC contra<ct long at 3250
Unrealized losses begin below breakeven (3240)
Losses can be significant if Gold falls aggressively
⚠️ Reward-to-Risk?
Reward is capped at $1,009
Risk is unlimited below breakeven
The trade only makes sense if you're prepared to own Gold, or hedge dynamically via MGC or using any other technique
This isn’t a “set-and-forget” income play—it’s a calculated entry into a structured exposure with a fallback plan.
Risk Management: No Margin for Error
Selling naked options isn’t “free money.” It’s responsibility wrapped in premium. Here's what must be considered:
❗ Undefined Risk
When you sell a naked PUT, you're exposed to the full downside. If Gold drops $100 below your strike, that’s a $10,000 loss. Don’t sell naked options unless you’re ready—and capitalized—to buy the underlying or actively hedge it.
🔄 Use MGC to Hedge
If Gold breaks below 3250, using Micro Gold Futures (MGC) offers a surgical way to hedge risk without overleveraging. A simple short MGC can offset GC losses proportionally, depending on how aggressive the move becomes.
🧮 Precision Matters
Avoid entering trades too early or too large.
Place an “invalidation” point: if price violates the support zone with conviction, reduce or hedge exposure.
Never sell premium just because it’s “high”—sell where structure backs the trade.
📊 Discipline Trumps Direction
This strategy is valid only if risk is respected. The market doesn’t owe anyone consistency—but a structured, risk-controlled approach keeps you in the game long enough to see it.
When charting futures, the data provided could be delayed. Traders working with the ticker symbols discussed in this idea may prefer to use CME Group real-time data plan on TradingView: www.tradingview.com - This consideration is particularly important for shorter-term traders, whereas it may be less critical for those focused on longer-term trading strategies.
General Disclaimer:
The trade ideas presented herein are solely for illustrative purposes forming a part of a case study intended to demonstrate key principles in risk management within the context of the specific market scenarios discussed. These ideas are not to be interpreted as investment recommendations or financial advice. They do not endorse or promote any specific trading strategies, financial products, or services. The information provided is based on data believed to be reliable; however, its accuracy or completeness cannot be guaranteed. Trading in financial markets involves risks, including the potential loss of principal. Each individual should conduct their own research and consult with professional financial advisors before making any investment decisions. The author or publisher of this content bears no responsibility for any actions taken based on the information provided or for any resultant financial or other losses.
Global Hard Commodity Trading1. Understanding Hard Commodities
Hard commodities are natural resources that must be mined, extracted, or produced through industrial processes. They are different from soft commodities, which include agricultural products like wheat, coffee, or cotton.
Examples of Hard Commodities:
Energy Commodities
Crude Oil (Brent, WTI)
Natural Gas
Coal
Uranium
Metals
Precious Metals: Gold, Silver, Platinum, Palladium
Base Metals: Copper, Aluminum, Zinc, Nickel, Lead, Tin
Rare Earth Elements (used in electronics, EVs, clean tech)
Characteristics of Hard Commodities:
Limited in supply, extracted from earth.
Prices are volatile, influenced by global demand and supply shocks.
Traded both physically and financially.
Often priced in US dollars, making them linked to global currency fluctuations.
Hard commodities are critical for energy, manufacturing, construction, defense, and technology sectors, making them a barometer of global economic health.
2. Evolution of Global Hard Commodity Trading
Commodity trading is not new—it dates back thousands of years when civilizations bartered metals, salt, and oil. However, the modern commodity trading system began in the 19th and 20th centuries with the rise of commodity exchanges like the Chicago Mercantile Exchange (CME) and the London Metal Exchange (LME).
Historical Milestones:
19th century: Industrial revolution created huge demand for coal, iron, and copper.
1900s: Oil became the world’s most important energy commodity.
1970s oil shocks: Highlighted the geopolitical importance of commodities.
2000s commodity super-cycle: Rapid demand from China and India fueled a massive rise in metal and energy prices.
Today: Hard commodities are not just traded physically but also heavily speculated on global futures markets.
3. Key Players in Hard Commodity Trading
Trading hard commodities involves a diverse range of participants:
Producers:
Oil companies (ExxonMobil, Saudi Aramco, BP)
Mining giants (Rio Tinto, BHP, Glencore)
Consumers:
Manufacturing companies, refineries, power plants, automakers, construction firms.
Traders & Intermediaries:
Global commodity trading houses like Vitol, Trafigura, Glencore, Gunvor.
These firms buy commodities from producers and sell them to consumers worldwide, often handling logistics, shipping, and financing.
Financial Institutions:
Investment banks (Goldman Sachs, JPMorgan, Morgan Stanley) actively trade in commodity derivatives.
Speculators & Investors:
Hedge funds, mutual funds, and retail traders participate in futures and ETFs for profit.
Governments & Regulators:
OPEC, IEA, WTO, and national regulators influence prices and rules.
4. Major Hard Commodity Markets
4.1 Energy Commodities
Crude Oil: Most traded commodity globally. Benchmarks: Brent (North Sea), WTI (US), Dubai/Oman.
Natural Gas: Key for heating, power generation, and industrial use. LNG (liquefied natural gas) has made gas a global trade.
Coal: Despite clean energy trends, coal still accounts for a major share of electricity generation in Asia.
Uranium: Fuels nuclear energy.
4.2 Metals
Gold & Silver: Precious metals for investment and jewelry. Also safe-haven assets during crises.
Copper: Known as “Dr. Copper” because it signals global economic health—widely used in construction and electronics.
Aluminum, Nickel, Zinc: Critical for cars, infrastructure, and batteries.
Rare Earths: Essential for EVs, wind turbines, semiconductors.
5. How Hard Commodities are Traded
5.1 Physical Trading
This involves the actual movement of goods—oil tankers, copper shipments, coal cargoes. Large trading houses dominate this space, dealing with storage, shipping, and financing.
5.2 Financial Trading
Financial markets allow traders to speculate, hedge, or invest without handling physical goods.
Futures Contracts (CME, LME, ICE)
Options & Swaps
Exchange-Traded Funds (ETFs) linked to commodities
Over-the-Counter (OTC) Derivatives
For example, an airline may hedge jet fuel prices through futures to lock in costs.
6. Price Drivers in Hard Commodity Trading
Hard commodity prices are influenced by a mix of economic, political, and natural factors:
Supply & Demand:
Strong global growth → higher demand for oil, metals.
Supply disruptions (strikes, wars, sanctions) → price spikes.
Geopolitics:
Middle East tensions → oil shocks.
Trade wars → disrupt commodity flows.
Currency Movements:
Most commodities priced in USD. A strong dollar makes them expensive for other countries.
Speculation & Investor Flows:
Hedge funds and ETFs influence short-term price swings.
Technological & Environmental Factors:
EV demand boosts lithium, cobalt, nickel.
Green energy transition reducing coal demand.
Natural Events:
Hurricanes disrupting oil production.
Mining accidents reducing metal supply.
7. Risks in Hard Commodity Trading
Price Volatility: Sharp swings make profits uncertain.
Political Risk: Sanctions, wars, and nationalization.
Credit Risk: Default by counterparties.
Logistics Risk: Shipping delays, storage costs.
Regulatory Risk: Changing government rules.
Environmental Risk: Climate policies reducing fossil fuel demand.
Traders use hedging strategies and risk management tools to minimize exposure.
8. Global Trade Hubs & Exchanges
London Metal Exchange (LME): Key center for base metals.
New York Mercantile Exchange (NYMEX): Crude oil, natural gas.
Intercontinental Exchange (ICE): Brent crude, energy futures.
Shanghai Futures Exchange (SHFE): China’s growing influence.
Dubai Mercantile Exchange (DME): Oil contracts for Middle East & Asia.
Physical hubs include Rotterdam (oil), Singapore (oil & LNG), Shanghai (metals), Dubai (gold).
9. Role of Technology in Hard Commodity Trading
Technology is transforming commodity trading:
AI & Algorithms for price forecasting.
Blockchain for trade finance and supply chain transparency.
Big Data & IoT to track shipments and consumption trends.
Digital platforms replacing traditional paper-based contracts.
10. Future of Hard Commodity Trading
Energy Transition:
Demand for oil may peak in coming decades.
Growth in renewables and metals like lithium, cobalt, nickel.
Green Commodities:
Carbon credits becoming tradable assets.
ESG (Environmental, Social, Governance) shaping investment choices.
China & India’s Role:
Asia will remain the biggest consumer of hard commodities.
Geopolitical Fragmentation:
Sanctions, supply chain shifts, and regional alliances may create “commodity blocs.”
Digitalization:
More algorithm-driven and blockchain-powered commodity trading.
Conclusion
Global hard commodity trading is more than just an economic activity—it is the heartbeat of the world economy. Energy, metals, and minerals not only determine industrial growth but also shape geopolitics, financial markets, and future technologies.
While the industry faces challenges of volatility, climate change, and regulatory shifts, it is also evolving rapidly with digitalization, green energy, and new demand sources.
For traders, investors, and policymakers alike, understanding hard commodity markets is essential—not just to profit, but also to anticipate global economic and political shifts.
Carry Trade in the Global Market1. What is a Carry Trade?
A carry trade is a financial strategy where investors:
Borrow or fund positions in a currency with low interest rates (funding currency).
Use those funds to buy a currency or asset with a higher interest rate (target currency or investment).
Earn the difference between the two rates (the interest rate spread), while also being exposed to currency fluctuations.
Example (Simplified):
Suppose the Japanese yen has a 0.1% interest rate, and the Australian dollar (AUD) has a 5% interest rate.
A trader borrows ¥100 million (Japanese yen) at near-zero cost and converts it into AUD.
The funds are invested in Australian bonds yielding 5%.
Annual return ≈ 4.9% (before considering currency fluctuations).
If the AUD appreciates against the yen during this time, the trader earns both the interest rate differential + capital gains. If AUD depreciates, the trade may turn into a loss.
2. The Mechanics of Carry Trade
Carry trade is not as simple as just switching between two currencies. It involves global capital flows, leverage, interest rate cycles, and risk management.
Step-by-Step Process:
Identify funding currency: Typically one with low or negative interest rates (JPY, CHF, or USD in certain cycles).
Borrow or short-sell this currency.
Buy high-yielding currency assets: Such as government bonds, corporate debt, or equities in emerging markets.
Earn interest spread daily (known as the rollover in forex markets).
Monitor exchange rates since even small currency fluctuations can offset interest gains.
Why It Works:
Differences in monetary policies across central banks create yield gaps.
Investors with large capital seek to exploit these spreads.
Global liquidity cycles and risk appetite drive the demand for carry trades.
3. Historical Importance of Carry Trade
Carry trades have been a cornerstone of currency markets, shaping global financial cycles:
1990s – Japanese Yen Carry Trade
Japan maintained near-zero interest rates after its asset bubble burst in the early 1990s.
Investors borrowed cheap yen and invested in higher-yielding assets abroad (Australia, New Zealand, emerging markets).
This caused yen weakness and strong capital inflows into emerging markets.
2000s – Dollar and Euro Carry Trades
Before the 2008 financial crisis, investors borrowed in low-yielding USD and JPY to invest in high-yielding currencies like the Brazilian Real, Turkish Lira, and South African Rand.
Commodity booms amplified returns, making the carry trade highly profitable.
2008 Global Financial Crisis
Carry trades collapsed as risk aversion spiked.
Investors unwound positions, leading to a surge in yen (JPY) and Swiss franc (CHF).
This showed how carry trade unwind can cause global market turbulence.
2010s – Post-Crisis QE Era
Ultra-low rates in the US, Japan, and Europe sustained carry trade strategies.
Emerging markets benefited from capital inflows but became vulnerable to sudden outflows when US Fed hinted at tightening (2013 “Taper Tantrum”).
2020s – Pandemic & Beyond
Global central banks slashed rates during COVID-19, reviving conditions for carry trades.
However, the 2022–23 inflation surge and rate hikes by the Fed created volatility, making carry trades riskier.
4. Global Carry Trade Currencies
Funding Currencies (Low Yield):
Japanese Yen (JPY): Classic funding currency due to decades of near-zero rates.
Swiss Franc (CHF): Safe-haven status and low yields.
Euro (EUR): Used in periods of ECB ultra-loose policy.
US Dollar (USD): At times of near-zero Fed rates.
Target Currencies (High Yield):
Australian Dollar (AUD) & New Zealand Dollar (NZD): Stable economies with higher yields.
Emerging Market Currencies: Brazilian Real (BRL), Turkish Lira (TRY), Indian Rupee (INR), South African Rand (ZAR).
Commodity Exporters: Higher rates often accompany higher commodity cycles.
5. Drivers of Carry Trade Activity
Carry trades thrive when global financial conditions are supportive.
Interest Rate Differentials – Larger gaps = higher carry.
Global Liquidity – Abundant capital seeks higher yields.
Risk Appetite – Investors pursue carry trades in “risk-on” environments.
Monetary Policy Divergence – When one central bank keeps rates low while others tighten.
Volatility Levels – Low volatility encourages carry trades; high volatility kills them.
6. Risks of Carry Trade
Carry trades may look attractive, but they are highly risky.
Currency Risk – A sudden depreciation of the high-yielding currency can wipe out gains.
Interest Rate Shifts – If the funding currency raises rates or target currency cuts rates, the carry spread shrinks.
Liquidity Risk – In crises, traders rush to unwind, leading to sharp reversals.
Geopolitical Risk – Wars, political instability, or sanctions can collapse carry trades.
Leverage Risk – Carry trades are often leveraged, magnifying both profits and losses.
7. The Role of Central Banks
Central banks indirectly shape carry trades through:
Rate setting policies (zero-rate or tightening cycles).
Forward guidance that signals future moves.
Quantitative easing (QE) that floods markets with liquidity.
Capital controls in emerging markets that try to manage inflows/outflows.
8. Case Studies in Carry Trades
The Yen Carry Trade (2000–2007)
Massive inflows into risky assets globally.
Unwinding during 2008 caused yen to spike 30%, triggering global asset sell-offs.
The Turkish Lira (TRY)
High rates attracted carry trades.
But political instability and inflation led to currency crashes, wiping out investors.
Brazil and South Africa
During commodity booms, high-yield currencies like BRL and ZAR became popular targets.
However, they were also prone to volatility from commodity cycles.
9. Carry Trade in Modern Markets
Today, carry trades are more complex and algorithm-driven. Hedge funds, banks, and institutional investors run quantitative carry trade strategies across forex, bonds, and derivatives.
Tools Used:
FX swaps & forwards
Options for hedging
ETFs & leveraged funds tracking carry trade strategies
Example – G10 Carry Index
Some financial institutions track “carry indices” that measure returns from long high-yield currencies and short low-yield currencies.
10. Advantages of Carry Trade
Predictable Income – Earn from interest rate differentials.
Scalability – Works in global FX markets with high liquidity.
Diversification – Access to multiple asset classes.
Potential for Leverage – High returns if managed correctly.
Conclusion
Carry trade is one of the most fascinating and impactful strategies in the global financial system. By exploiting interest rate differentials across countries, it provides traders with a potential source of profit. However, history has shown that the carry trade is a double-edged sword: highly rewarding in stable times, but brutally punishing during crises.
Understanding its mechanics, historical patterns, risks, and modern applications is essential for any trader, investor, or policymaker. The carry trade is more than just a strategy — it is a barometer of global risk appetite, liquidity, and monetary policy divergence.
For those who master it with discipline and risk management, the carry trade remains a powerful tool in navigating global markets.

Real Estate Market Trading (Global Property Investments)Chapter 1: The Evolution of Global Real Estate
1.1 From Land Ownership to Investment Vehicles
Historically, real estate was limited to direct ownership—buying a plot of land or a house. Over time, as capital markets developed, new vehicles like real estate funds, REITs, and securitized mortgages emerged, democratizing access to property investments.
Pre-20th Century: Land was tied to agriculture and feudal wealth.
Post-WWII Era: Rapid urbanization and industrialization led to housing booms worldwide.
1980s–2000s: Financial innovation enabled securitization of mortgages and global property funds.
2008 Crisis: Highlighted risks of over-leveraged real estate trading (subprime mortgage collapse).
2020s: Rise of proptech, tokenization, and cross-border property investments via digital platforms.
1.2 The Shift to Globalization
Earlier, real estate was local in nature. Today, with international capital mobility, investors in Singapore can own shares of an office building in New York or a luxury resort in Dubai. Sovereign wealth funds, pension funds, and hedge funds now treat real estate as a core part of global portfolios.
Chapter 2: Types of Global Property Investments
2.1 Direct Real Estate Investments
Residential Properties: Apartments, villas, and multi-family housing.
Commercial Properties: Office towers, co-working spaces, retail malls.
Industrial Properties: Warehouses, logistics hubs, data centers.
Hospitality & Tourism: Hotels, resorts, serviced apartments.
Specialty Real Estate: Senior housing, student accommodation, hospitals.
2.2 Indirect Investments
REITs (Real Estate Investment Trusts): Publicly traded companies that own income-generating property.
Property Funds & ETFs: Diversified funds that invest in global or regional properties.
Private Equity Real Estate: Institutional funds targeting high-value projects.
Securitized Real Estate Products: Mortgage-backed securities (MBS).
2.3 New Age Investments
Fractional Ownership: Platforms enabling small-ticket investments in high-value properties.
Tokenized Real Estate: Blockchain-based ownership shares, allowing cross-border property trading.
Green Real Estate Funds: Focus on sustainable buildings and energy-efficient assets.
Chapter 3: Key Drivers of the Global Real Estate Market
3.1 Economic Growth & Income Levels
A strong economy boosts demand for housing, office spaces, and retail outlets. Conversely, recessions often lead to property price corrections.
3.2 Interest Rates & Monetary Policy
Real estate is heavily credit-dependent. When interest rates are low, borrowing is cheaper, encouraging investments. Rising rates often dampen demand and lower valuations.
3.3 Demographics & Urbanization
Young populations drive housing demand.
Aging populations create demand for healthcare and senior housing.
Rapid urban migration boosts infrastructure and property markets in developing nations.
3.4 Technology & Infrastructure
Digital transformation (proptech, AI-driven valuations, blockchain).
Smart cities with IoT-based energy-efficient buildings.
Infrastructure like airports, metros, and highways pushing property values higher.
3.5 Globalization of Capital
Cross-border investments have increased, with Asia-Pacific, Middle East, and European investors pouring capital into North American and emerging-market properties.
3.6 Geopolitical & Environmental Factors
Wars, sanctions, and political instability impact property flows.
Climate change increases demand for resilient, green buildings.
Government housing policies and tax incentives drive local markets.
Chapter 4: Global Real Estate Market Segments
4.1 Residential Real Estate
The backbone of real estate, influenced by population growth, income levels, and mortgage availability. Trends include:
Affordable housing demand in emerging markets.
Luxury housing in global hubs like London, Dubai, and New York.
Vacation homes and short-term rental platforms (Airbnb model).
4.2 Commercial Real Estate (CRE)
Includes offices, malls, and business parks. Post-pandemic trends show:
Hybrid work models reducing demand for traditional office space.
E-commerce boosting logistics and warehousing investments.
Retail shifting from malls to experiential centers.
4.3 Industrial Real Estate
A rising star due to global supply chain realignment:
Warehouses and cold storage facilities.
Data centers (digital economy backbone).
Renewable energy sites (solar and wind farms).
4.4 Hospitality & Tourism Properties
Tourism recovery post-COVID has reignited hotel investments. Countries like UAE, Thailand, and Maldives remain hotspots.
Chapter 5: Real Estate Trading Mechanisms
5.1 Traditional Trading
Direct purchase and sale of land or property.
Long holding periods with rental income.
5.2 Listed Market Trading
Buying and selling REITs, property ETFs, and securitized debt instruments on stock exchanges.
High liquidity compared to physical property.
5.3 Digital & Tokenized Trading
Blockchain enables fractional trading of global assets. For example, an investor in India can purchase a $100 token representing part ownership of a Manhattan office tower.
Chapter 6: Global Hotspots for Property Investment
6.1 North America
United States: Largest REIT market; strong demand in tech hubs like Austin, Miami, and San Francisco.
Canada: Rising immigration boosting residential demand in Toronto and Vancouver.
6.2 Europe
UK: London remains a luxury real estate hub.
Germany: Berlin attracting investors due to stable rental yields.
Spain & Portugal: Tourism-driven real estate and golden visa programs.
6.3 Asia-Pacific
China: Slowdown due to debt-laden developers, but still massive market.
India: Affordable housing, commercial hubs (Bengaluru, Hyderabad), and REITs gaining traction.
Singapore & Hong Kong: Financial hubs attracting global property capital.
6.4 Middle East
UAE (Dubai, Abu Dhabi): Tax-free status, global expat community, and luxury real estate boom.
Saudi Arabia: Vision 2030 fueling mega infrastructure projects.
6.5 Emerging Markets
Africa (Nigeria, Kenya, South Africa): Urbanization and infrastructure push.
Latin America (Brazil, Mexico): Tourism and housing demand.
Chapter 7: Risks in Global Property Trading
7.1 Market Risks
Price volatility due to economic cycles.
Oversupply in certain regions leading to price corrections.
7.2 Financial Risks
Rising interest rates increasing borrowing costs.
Currency fluctuations impacting cross-border investors.
7.3 Political & Regulatory Risks
Changes in property laws, taxes, or ownership rights.
Political instability reducing foreign investment appetite.
7.4 Environmental & Climate Risks
Properties in flood-prone or disaster-prone zones losing value.
Higher costs of compliance with green regulations.
Chapter 8: Future of Global Property Investments
8.1 Technology Transformation
AI for predictive property valuations.
Metaverse real estate and digital land ownership.
Smart contracts automating property transactions.
8.2 Green & Sustainable Real Estate
Global shift toward ESG investing is pushing developers to build carbon-neutral buildings. Green bonds tied to real estate are gaining momentum.
8.3 Institutional Dominance
Pension funds, sovereign funds, and insurance companies will continue to dominate large-scale global property deals.
8.4 Democratization via Tokenization
Retail investors gaining access to billion-dollar properties through blockchain-powered fractional ownership.
Chapter 9: Strategies for Investors
Diversification – Spread across geographies and property types.
Long-Term Vision – Real estate rewards patience.
Leverage Smartly – Avoid overexposure to debt.
Follow Macro Trends – Urbanization, interest rates, and technology adoption.
Risk Mitigation – Use insurance, hedging, and local partnerships.
Conclusion
Real estate market trading and global property investments represent one of the most dynamic and resilient avenues of wealth creation. While challenges exist—such as rising rates, geopolitical uncertainty, and climate risks—the fundamental demand for land and property is eternal. The shift toward digital ownership, sustainability, and cross-border capital flows ensures that the real estate sector will continue to evolve as a global marketplace.
For investors, success lies in combining local insights with global perspectives, diversifying portfolios, embracing technology, and staying agile to adapt to changing market conditions.
In many ways, real estate is no longer just about “location, location, location”—it’s about innovation, globalization, and sustainability.
Shaping Global Trade & Currencies1. Historical Evolution of Trade & Currencies
1.1 Early Trade Systems
Ancient civilizations engaged in barter-based trade, exchanging goods like grains, spices, and metals.
The Silk Road connected Asia, the Middle East, and Europe, becoming one of the earliest global trade routes.
Precious metals such as gold and silver became the first universally accepted currencies for trade.
1.2 Emergence of Modern Currencies
With the rise of kingdoms and empires, coins and paper money replaced barter.
Colonialism reshaped trade routes, with European powers dominating maritime trade.
The gold standard (19th century) linked currencies to gold, bringing stability to global exchange.
1.3 Bretton Woods System
After World War II, the 1944 Bretton Woods Agreement established the US dollar as the anchor currency, pegged to gold.
Institutions like the International Monetary Fund (IMF) and World Bank were created to stabilize trade and finance.
The system collapsed in 1971 when the US abandoned the gold standard, leading to today’s system of floating exchange rates.
2. The Dynamics of Global Trade
2.1 Drivers of Global Trade
Comparative advantage: Countries trade based on their strengths (e.g., oil-rich Middle East, tech-driven US, manufacturing hub China).
Global supply chains: Modern production spans multiple countries (e.g., iPhones designed in the US, assembled in China, components from Japan, Korea).
Technology: Digital platforms, container shipping, and logistics efficiency made cross-border trade faster and cheaper.
Trade liberalization: Free trade agreements (FTAs), regional blocs like EU, NAFTA, ASEAN, and the role of the WTO facilitated tariff reduction.
2.2 Trade Balances & Deficits
Countries with trade surpluses (exports > imports) accumulate foreign reserves (e.g., China, Germany).
Trade deficits (imports > exports) often weaken currencies (e.g., US, India at times).
Persistent imbalances create currency tensions and trade wars.
2.3 Role of Multinational Corporations
MNCs control global supply chains, influence trade volumes, and hedge against currency risks.
Companies like Apple, Toyota, and Amazon shape currency demand through cross-border transactions.
3. The Role of Currencies in Global Trade
3.1 Currency as a Medium of Exchange
Trade requires settlement in common units of value—currencies like USD, Euro, Yen, Yuan.
The US Dollar dominates, accounting for ~60% of global reserves and ~80% of trade invoicing.
3.2 Exchange Rate Systems
Fixed Exchange Rates – pegged to another currency (e.g., Hong Kong Dollar to USD).
Floating Exchange Rates – determined by supply-demand in forex markets (e.g., Euro, Yen).
Managed Exchange Rates – central banks intervene to stabilize value (e.g., Indian Rupee, Chinese Yuan).
3.3 Impact of Currency Fluctuations on Trade
A strong currency makes exports expensive but imports cheaper.
A weak currency boosts exports but makes imports costlier.
Example: Japan often benefits from a weaker Yen, aiding its export-driven economy.
4. Key Institutions Shaping Trade & Currencies
4.1 International Monetary Fund (IMF)
Provides financial stability and currency support.
Monitors exchange rate policies and prevents currency manipulation.
4.2 World Trade Organization (WTO)
Regulates global trade rules.
Resolves trade disputes between nations.
4.3 World Bank
Provides development financing to support trade infrastructure.
Helps emerging economies integrate into global trade.
4.4 Central Banks
Influence currency values via interest rates, monetary policies, and interventions.
Examples: US Federal Reserve, European Central Bank, Reserve Bank of India.
4.5 Regional Trade Blocs
EU (single market, Eurozone).
ASEAN, NAFTA/USMCA.
African Continental Free Trade Agreement (AfCFTA).
5. Geopolitics & Trade-Currency Relations
5.1 Currency Wars
Nations sometimes deliberately devalue currencies to gain export advantage.
Example: China accused of “currency manipulation” by the US.
5.2 Trade Wars
Tariffs, sanctions, and restrictions reshape global flows.
Example: US-China trade war disrupted supply chains and currency stability.
5.3 Sanctions & Currency Power
Dominance of USD allows the US to enforce sanctions by restricting access to its financial system.
Russia, Iran, and others explore alternative settlement systems to bypass USD dominance.
6. Technology & the Future of Trade and Currencies
6.1 Digital Trade
E-commerce and digital platforms enable small businesses to participate globally.
Services trade (software, fintech, education) grows faster than goods trade.
6.2 Fintech & Payments
SWIFT, blockchain, and digital payment networks revolutionize settlements.
Cryptocurrencies like Bitcoin challenge traditional currency systems.
Central Bank Digital Currencies (CBDCs) are emerging as official digital currencies (China’s e-CNY, India’s Digital Rupee).
6.3 Automation & AI
AI-powered logistics and predictive analytics optimize global supply chains.
Digital platforms reduce transaction costs and improve cross-border efficiency.
7. Risks & Challenges in Trade & Currencies
7.1 Exchange Rate Volatility
Currency swings create uncertainty for exporters and importers.
Companies hedge risks via futures, forwards, and options.
7.2 Protectionism
Rise of nationalism and tariffs disrupt free trade principles.
Example: Brexit altered EU-UK trade dynamics.
7.3 Global Inequality
Developed nations often dominate trade benefits, leaving poorer economies vulnerable.
Currency crises in emerging markets (Argentina, Turkey, Sri Lanka) highlight fragility.
7.4 Climate Change & Sustainability
Green trade policies and carbon taxes affect global competitiveness.
Currency values may shift as nations transition to renewable energy.
8. Case Studies
8.1 US Dollar Dominance
Despite challenges, USD remains the global reserve currency.
Stability of US institutions, deep financial markets, and global trust sustain its dominance.
8.2 China’s Yuan Strategy
China pushes Yuan internationalization through Belt & Road projects, trade invoicing, and currency swaps.
Inclusion of Yuan in IMF’s Special Drawing Rights (SDR) basket strengthened its global role.
8.3 Eurozone & Euro
Euro became the second-most traded currency.
But crises like Greece’s debt problems revealed structural weaknesses.
8.4 Emerging Markets
India, Brazil, and others promote local currency trade settlements.
Reduces reliance on USD and improves currency stability.
9. The Future of Global Trade & Currencies
9.1 Multipolar Currency World
Rise of Yuan, Euro, and digital currencies may reduce US dollar dominance.
Regional blocs may settle trade in local currencies.
9.2 Digital Transformation
CBDCs and blockchain-based trade finance could replace traditional banking channels.
Smart contracts may automate trade settlements.
9.3 Sustainable Trade
Carbon-neutral policies, green financing, and ESG compliance will reshape trade.
Currencies of nations leading in green technology may gain strength.
9.4 Resilient Supply Chains
Post-COVID-19, countries diversify supply chains to reduce dependency on one region (e.g., China+1 strategy).
Trade and currency flows adapt to new production hubs (Vietnam, India, Mexico).
Conclusion
Global trade and currencies are inseparable forces driving the world economy. Trade enables nations to leverage comparative advantages, while currencies facilitate exchange and measure competitiveness. Over centuries, from barter to digital currencies, both systems evolved alongside geopolitics, technology, and institutional frameworks.
Today, challenges like protectionism, exchange rate volatility, and sustainability shape the future. At the same time, opportunities such as digital transformation, multipolar currencies, and green trade create new pathways.
Ultimately, the shaping of global trade and currencies reflects a balance between cooperation and competition, tradition and innovation, stability and disruption. The future will likely witness a hybrid world—where digital currencies coexist with traditional systems, regional trade complements global flows, and sustainability becomes a defining factor.
Global trade and currencies, therefore, are not just economic concepts but also mirrors of human progress, resilience, and interconnected destiny.

Impact of Rising US Treasury Yields on Global EquitiesPart 1: Understanding US Treasury Yields
1.1 What Are US Treasury Yields?
US Treasuries are debt securities issued by the US government to finance its operations. They come in different maturities—short-term bills (up to 1 year), medium-term notes (2–10 years), and long-term bonds (20–30 years). The yield on these securities represents the return an investor earns by holding them until maturity.
Yields move inversely to bond prices. When investors sell Treasuries, prices fall and yields rise. Conversely, when demand is high, yields drop.
1.2 Why Are US Treasuries Called “Risk-Free”?
The US government is considered the safest borrower in the world, backed by its ability to tax and print dollars. Thus, Treasuries are seen as risk-free assets in terms of default. This status makes them the benchmark against which global borrowing costs, equity valuations, and investment decisions are calibrated.
1.3 Drivers of Rising Treasury Yields
US Treasury yields rise due to:
Federal Reserve policy (interest rate hikes, balance sheet reductions).
Inflation expectations (higher inflation erodes bond value, pushing yields up).
Economic growth outlook (strong growth boosts demand for capital, raising yields).
Government borrowing (higher fiscal deficits increase supply of Treasuries, pressuring yields higher).
Part 2: Link Between Treasury Yields and Global Equities
2.1 The Discount Rate Effect
Equity valuations are based on the present value of future cash flows. When Treasury yields rise, the discount rate (the rate used to calculate present value) increases. This reduces the attractiveness of equities, especially growth stocks with earnings expected far into the future.
2.2 Opportunity Cost of Capital
Investors compare expected equity returns with risk-free Treasury yields. If yields rise significantly, the relative appeal of equities declines, causing fund flows to shift from stocks to bonds.
2.3 Cost of Borrowing for Corporates
Higher yields mean higher borrowing costs globally. For companies dependent on debt, rising yields squeeze margins and reduce profitability, pressuring stock prices.
2.4 Risk Sentiment and Volatility
Sharp increases in yields often spark volatility. Equity markets prefer stable interest rates. Sudden upward movements in yields are interpreted as signals of tightening liquidity or higher inflation risks, both of which unsettle investors.
Part 3: Historical Case Studies
3.1 The 2013 “Taper Tantrum”
In 2013, when the Federal Reserve hinted at tapering bond purchases, US Treasury yields surged. Emerging markets experienced massive capital outflows, and their stock markets plunged. This episode underscored the global sensitivity to US yields.
3.2 The 2018 Yield Spike
In 2018, the 10-year US Treasury yield touched 3.25%, triggering global equity sell-offs. Investors worried about higher discount rates and slowing global liquidity. Technology and high-growth sectors were hit hardest.
3.3 The 2022 Bond Rout
The Fed’s aggressive rate hikes in 2022 pushed the 10-year yield above 4%. Global equities, including the S&P 500, Europe’s Stoxx 600, and Asian indices, fell into bear markets. The pain was widespread—ranging from US tech giants to emerging-market stocks.
Part 4: Sector-Wise Impact of Rising Yields
4.1 Growth vs. Value Stocks
Growth stocks (e.g., technology, biotech) are most sensitive. Their long-duration cash flows are heavily discounted when yields rise.
Value stocks (e.g., banks, industrials, energy) often fare better. Banks, in particular, benefit from higher interest rates via improved net interest margins.
4.2 Banking & Financials
Higher yields typically boost profitability for banks and insurers, as they can lend at higher rates. Global financial stocks often outperform during rising-yield phases.
4.3 Real Estate & Utilities
These sectors are bond proxies—investors buy them for stable dividends. When Treasury yields rise, their relative appeal diminishes, leading to underperformance.
4.4 Commodities & Energy
Commodities often benefit indirectly if yields rise due to stronger growth expectations. However, if yields rise because of inflation and monetary tightening, commodities may face demand destruction risks.
Part 5: Geographic Sensitivities
5.1 United States
US equities are most directly impacted. The Nasdaq (tech-heavy) suffers more than the Dow Jones (value-oriented).
5.2 Europe
European equities track US yields closely. Higher yields in the US can lead to stronger dollar, pressuring European exporters. Additionally, Europe’s bond yields often rise in sympathy, tightening financial conditions.
5.3 Emerging Markets
Emerging markets are the most vulnerable. Rising US yields trigger:
Capital outflows (investors shift to safer US assets).
Currency depreciation (raising import costs and inflation).
Stock market sell-offs (especially in countries reliant on foreign capital).
For example, India, Brazil, and Turkey often see sharp corrections when US yields spike.
5.4 Asia (Japan, China)
Japan: Rising US yields weaken the yen (as investors chase dollar returns), which can help Japanese exporters but hurt domestic equities tied to imports.
China: Sensitive due to capital flows and trade dynamics. Rising US yields often pressure Chinese equities, especially during growth slowdowns.
Part 6: Currency & Global Equity Interplay
Rising US yields usually strengthen the US dollar. A stronger dollar reduces profits of US multinationals, pressures commodity prices, and creates headwinds for emerging-market equities. For global investors, currency-adjusted returns from foreign equities decline when the dollar is strong, further reducing equity allocations abroad.
Part 7: Broader Macroeconomic Implications
7.1 Liquidity Tightening
Higher yields reduce global liquidity. Central banks in other countries often follow the Fed to prevent capital flight, tightening financial conditions worldwide.
7.2 Inflation & Growth Trade-Off
Rising yields often reflect inflationary pressures. Central banks respond with rate hikes, slowing global growth. Equity markets suffer as both margins and valuations come under pressure.
7.3 Safe-Haven Flows
Paradoxically, in times of global turmoil, US Treasuries attract safe-haven flows, lowering yields again. But during inflationary cycles, this dynamic weakens, making equities more vulnerable.
Part 8: Coping Strategies for Investors
8.1 Diversification
Investors hedge against rising yields by diversifying into value stocks, commodities, and sectors benefiting from higher rates (like banks).
8.2 Global Allocation
Allocating across geographies can help. For instance, some Asian and European stocks may perform better depending on currency moves and domestic cycles.
8.3 Use of Derivatives
Investors use interest-rate futures, options, and currency hedges to manage risks from rising yields.
8.4 Tactical Shifts
Moving from growth to value, reducing exposure to high-duration equities, and increasing allocation to inflation-hedged assets are common strategies.
Part 9: Future Outlook
The long-term trajectory of US Treasury yields depends on:
US fiscal deficits and borrowing needs.
Federal Reserve policy normalization.
Global inflation cycles.
Geopolitical shifts in demand for US Treasuries (e.g., de-dollarization trends).
For global equities, this means heightened sensitivity to yield cycles. Investors must closely monitor not only the direction but also the pace of yield movements. Gradual increases may be absorbed, but sharp spikes usually destabilize global equities.
Conclusion
The relationship between US Treasury yields and global equities is one of the most powerful forces in financial markets. Rising yields act as a tightening mechanism, reducing equity valuations, increasing corporate borrowing costs, triggering capital outflows from emerging markets, and strengthening the US dollar. The effects vary across sectors and geographies—hurting growth stocks, real estate, and emerging markets, while benefiting banks and certain value-oriented sectors.
History shows that equity markets can tolerate moderate, steady increases in yields, particularly when driven by strong growth. However, rapid spikes often cause global turbulence. For investors, understanding these dynamics and positioning portfolios accordingly is crucial.
In essence, rising US Treasury yields are not just an American story—they are a global story, shaping equity performance from Wall Street to Mumbai, from Frankfurt to Tokyo.
Major Global Stock Exchanges1. The Concept of a Stock Exchange
A stock exchange is an organized marketplace where securities such as stocks, bonds, derivatives, and exchange-traded funds (ETFs) are bought and sold. Exchanges are critical for:
Capital Formation: Companies raise funds for growth by issuing shares.
Liquidity: Investors can buy or sell securities quickly.
Price Discovery: Supply and demand set fair market prices.
Transparency & Regulation: Exchanges ensure fair trading practices.
Economic Indicators: Indexes like the S&P 500 or Nikkei 225 reflect economic health.
The global network of stock exchanges creates an interconnected system where money flows seamlessly across borders, influencing trade, investment, and growth.
2. Major Global Stock Exchanges by Region
A. North America
1. New York Stock Exchange (NYSE) – USA
Founded: 1792 (Buttonwood Agreement).
Market Capitalization: Over $30 trillion (2025 est.), making it the world’s largest exchange.
Trading Mechanism: Hybrid system – both electronic and floor-based trading.
Famous Index: Dow Jones Industrial Average (DJIA).
The NYSE is synonymous with Wall Street and represents global capitalism. Home to giants like Apple, Microsoft, and JPMorgan Chase, it attracts global investors. The NYSE’s prestige often means companies choose it over others for IPOs, despite higher listing requirements.
2. NASDAQ – USA
Founded: 1971.
Market Capitalization: Approx. $25 trillion.
Specialty: First electronic exchange, known for tech-heavy listings.
Famous Index: NASDAQ Composite, NASDAQ-100.
NASDAQ revolutionized trading with full automation. Today, it’s the home of global technology leaders such as Alphabet, Amazon, Tesla, and Meta. Its growth is tied to the tech boom, and its influence extends worldwide in shaping technology valuations.
3. Toronto Stock Exchange (TSX) – Canada
Founded: 1852.
Market Capitalization: Around $3.5 trillion.
Specialty: Strong focus on energy, mining, and natural resources.
Canada’s TSX is crucial for global commodities and resource-based industries. It provides capital to firms in oil, gold, and base metals, making it a hub for resource-dependent economies.
B. Europe
4. London Stock Exchange (LSE) – UK
Founded: 1801.
Market Capitalization: Approx. $4 trillion.
Famous Index: FTSE 100.
Historically, the LSE was the world’s most important exchange before the rise of the NYSE. Today, despite Brexit challenges, it remains a global financial center, attracting listings from Europe, Africa, and Asia. It also owns Borsa Italiana and is a hub for international debt securities.
5. Euronext – Pan-European
Founded: 2000 (merger of Amsterdam, Brussels, and Paris exchanges).
Market Capitalization: Approx. $7 trillion.
Famous Index: Euronext 100.
Euronext is Europe’s largest stock exchange, spanning multiple countries including France, the Netherlands, Belgium, Ireland, Italy, and Portugal. Its integrated platform enhances cross-border trading and investment opportunities.
6. Deutsche Börse (Frankfurt Stock Exchange) – Germany
Founded: 1585.
Market Capitalization: Over $2.5 trillion.
Famous Index: DAX 40.
Located in Frankfurt, Germany’s financial hub, Deutsche Börse is vital for Europe’s largest economy. It specializes in advanced trading systems and derivatives via Eurex.
7. SIX Swiss Exchange – Switzerland
Founded: 1850s.
Market Capitalization: Approx. $2 trillion.
Specialty: Banking and pharmaceuticals (Nestlé, Roche, Novartis).
The Swiss Exchange benefits from Switzerland’s strong banking tradition and reputation for stability. It attracts international investors seeking security.
C. Asia-Pacific
8. Tokyo Stock Exchange (TSE) – Japan
Founded: 1878.
Market Capitalization: Over $6 trillion.
Famous Index: Nikkei 225, TOPIX.
TSE is Asia’s largest stock exchange. Japan’s economy and corporate sector (Toyota, Sony, SoftBank) rely heavily on its capital markets. The TSE’s reforms in governance and technology have improved global investor confidence.
9. Shanghai Stock Exchange (SSE) – China
Founded: 1990 (modern re-establishment).
Market Capitalization: Over $7 trillion.
Famous Index: SSE Composite.
The SSE is China’s largest exchange, playing a central role in financing its massive economy. It lists state-owned enterprises (SOEs) and large banks. While it is not fully open to foreign investors, schemes like Stock Connect have increased global participation.
10. Shenzhen Stock Exchange (SZSE) – China
Founded: 1990.
Market Capitalization: Over $5 trillion.
Specialty: Innovative and fast-growing tech companies.
Famous Index: ChiNext.
Often compared to NASDAQ, the SZSE specializes in smaller, high-growth firms. It plays a critical role in China’s startup ecosystem.
11. Hong Kong Stock Exchange (HKEX) – Hong Kong
Founded: 1891.
Market Capitalization: Around $5 trillion.
Famous Index: Hang Seng Index.
HKEX is a gateway for global investors into China. Many Chinese firms, including Alibaba and Tencent, are listed here. Despite political tensions, HKEX remains influential due to its global connectivity.
12. Bombay Stock Exchange (BSE) – India
Founded: 1875 (Asia’s oldest).
Market Capitalization: Over $4 trillion.
Famous Index: Sensex 30.
The BSE is Asia’s first exchange and remains a vital part of India’s fast-growing economy. It has deep liquidity, electronic systems, and diverse listings.
13. National Stock Exchange (NSE) – India
Founded: 1992.
Market Capitalization: Over $4.5 trillion.
Famous Index: Nifty 50.
NSE revolutionized Indian trading by introducing electronic systems. Today, it is larger than BSE in trading volume and derivatives, making it India’s most important exchange.
14. Australian Securities Exchange (ASX) – Australia
Founded: 1987 (merger of state exchanges).
Market Capitalization: Around $2 trillion.
Specialty: Mining, energy, finance.
The ASX plays a regional role, particularly in commodities and finance, while also experimenting with blockchain-based settlement systems.
D. Middle East & Emerging Markets
15. Saudi Stock Exchange (Tadawul) – Saudi Arabia
Founded: 2007 (modern structure).
Market Capitalization: Approx. $3 trillion.
Famous Listing: Saudi Aramco (world’s largest IPO).
Tadawul is the largest exchange in the Middle East, central to Vision 2030 reforms aimed at diversifying the Saudi economy.
16. Johannesburg Stock Exchange (JSE) – South Africa
Founded: 1887.
Market Capitalization: Around $1 trillion.
The JSE dominates Africa, serving mining and resource companies. It connects African economies with global investors.
17. B3 (Brasil Bolsa Balcão) – Brazil
Founded: 1890, merged into B3 in 2017.
Market Capitalization: Approx. $1.2 trillion.
B3 is Latin America’s largest exchange, crucial for Brazil’s energy, agriculture, and financial sectors.
3. Comparative Importance of Global Stock Exchanges
Largest by Market Cap: NYSE, NASDAQ, SSE, TSE, Euronext.
Tech-Focused: NASDAQ, SZSE, NSE.
Commodities-Driven: TSX, JSE, ASX.
Regional Leaders: Tadawul (Middle East), JSE (Africa), B3 (Latin America).
Exchanges compete globally for IPOs and liquidity. Companies often cross-list (e.g., Alibaba on NYSE and HKEX) to access multiple investor bases.
4. The Future of Stock Exchanges
Digital Transformation: Blockchain and AI are reshaping settlement and fraud detection.
Globalization vs Fragmentation: While some exchanges integrate, geopolitical tensions may cause fragmentation.
Sustainability: ESG-focused investing is influencing exchange policies.
Retail Investor Boom: Platforms like Robinhood and Zerodha are increasing participation.
Competition from Private Markets: Startups may prefer private funding over IPOs.
Conclusion
Global stock exchanges are more than marketplaces—they are economic nerve centers. Each exchange has unique strengths: NYSE’s prestige, NASDAQ’s tech dominance, LSE’s international reach, TSE’s resilience, SSE’s link to China’s growth, and NSE’s role in emerging markets. Together, they form an interconnected web driving global finance.
In the future, exchanges will adapt to technology, regulation, and shifting capital flows, but their fundamental purpose—channeling capital into productive use—will remain unchanged.

Master TradingView Like a Pro – Tools, Alerts, and Hidden Gems!Are you really using everything TradingView has to offer?
In this video, I’m breaking down 8 powerful features inside TradingView that most traders don’t fully use — even though they can save time, improve your analysis, and help you catch better setups.
Here’s what I’ll walk you through step by step:
✅ How I use Drawing Tools to map market structure
✅ Why I rarely use indicators — but why you should still know them
✅ How to scan markets fast using the Screener & Heatmap
✅ The right way to use the Economic Calendar and avoid news traps
✅ The feature I use daily: Price Alerts (a total game changer)
✅ How to practice with zero risk using Paper Trading
✅ Using Multi-Chart Layouts to watch multiple timeframes
✅ And finally — how the TradingView Community helped me grow and connect
Whether you're just getting started or already experienced — this video is packed with value.
Watch it till the end, and if you find it helpful — like, comment, and share it to support my work!
Best, Arman Shaban

Exchange Rate Dynamics & FluctuationsPart 1: What Are Exchange Rates?
An exchange rate is essentially the price of one currency in terms of another. For example:
Direct quote: 1 USD = 83 INR → How many rupees per dollar.
Indirect quote: 1 INR = 0.012 USD → How many dollars per rupee.
Functions of Exchange Rates
Facilitate international trade – exporters and importers settle payments.
Enable cross-border investment – FDI, FIIs, bonds, equity markets.
Act as indicators of competitiveness – strong vs weak currency matters for exports.
Transmit global shocks – inflation, oil prices, interest rate changes often flow through currency movements.
Part 2: Exchange Rate Systems
Countries adopt different systems to manage their currencies:
Fixed Exchange Rate System
Currency pegged to gold or another currency (e.g., Bretton Woods system).
Provides stability but reduces flexibility.
Floating Exchange Rate System
Currency value determined purely by demand and supply in forex markets.
More volatile but allows automatic adjustment.
Managed Floating (Dirty Float)
Combination of both: central banks intervene occasionally to prevent extreme volatility.
Example: India’s rupee is a managed float.
Currency Pegs & Boards
Some countries peg their currencies to the US dollar or euro (e.g., Hong Kong dollar).
Offers stability but imports inflation/monetary policy from the anchor country.
Part 3: Theories of Exchange Rate Determination
Economists have proposed several models to explain exchange rate movements:
Purchasing Power Parity (PPP)
Currencies adjust to equalize the purchasing power of different countries.
Example: If a burger costs $5 in the US and ₹400 in India, then PPP exchange rate = 400/5 = 80.
Interest Rate Parity (IRP)
Interest rate differences between countries affect forward exchange rates.
Higher interest rates attract capital inflows, strengthening the currency.
Balance of Payments Approach
Exchange rate depends on trade balance (exports-imports) and capital flows.
Trade surplus strengthens currency; deficit weakens it.
Monetary Approach
Currency value linked to money supply and inflation.
Higher inflation depreciates a currency.
Asset Market Approach
Exchange rate determined by demand and supply of financial assets across countries.
Part 4: Key Drivers of Exchange Rate Fluctuations
1. Demand and Supply of Currencies
Like any commodity, exchange rates are influenced by demand and supply. If more people want dollars (for oil imports, for example), the dollar strengthens.
2. Interest Rates
High domestic interest rates attract foreign capital → appreciation of the local currency.
Low interest rates cause outflows → depreciation.
3. Inflation Rates
Countries with lower inflation rates tend to see currency appreciation, as purchasing power is preserved.
4. Trade Balance
Export surplus → stronger currency.
Import-heavy economy → weaker currency.
5. Foreign Direct Investment (FDI) and Portfolio Flows
When investors buy stocks, bonds, or companies in a country, they demand that country’s currency → appreciation.
6. Speculation and Market Sentiment
Traders often buy or sell currencies based on expectations. If markets expect the rupee to fall, speculative selling accelerates the decline.
7. Central Bank Intervention
Central banks sometimes buy/sell foreign currencies to stabilize their domestic currency.
Example: RBI selling dollars to support the rupee.
8. Geopolitical Events and Political Stability
Wars, elections, coups, and policy changes can trigger sharp movements.
9. Commodity Prices
Oil-exporting nations’ currencies (like Russia’s ruble) rise when oil prices rise.
Oil-importing countries (like India) see their currency weaken when oil becomes expensive.
10. Global Risk Appetite
During crises, investors flock to “safe haven” currencies (USD, CHF, JPY), causing them to appreciate.
Part 5: Types of Exchange Rate Fluctuations
Appreciation – Currency value rises (e.g., USD/INR falls from 83 → 80).
Depreciation – Currency value falls (e.g., USD/INR rises from 83 → 86).
Devaluation – Government/central bank officially reduces the currency’s value under fixed system.
Revaluation – Official increase in value.
Volatility – Short-term fluctuations due to speculative trading, news, or shocks.
Part 6: Real-World Examples
Asian Financial Crisis (1997)
Thai baht collapse spread across Asia.
Triggered by excessive borrowing and weak reserves.
Eurozone Debt Crisis (2010–12)
Euro weakened due to fears of Greek and other sovereign defaults.
COVID-19 Pandemic (2020)
Investors rushed into the dollar as a safe haven.
Emerging market currencies depreciated sharply.
Russia-Ukraine War (2022)
Ruble crashed initially, then recovered after capital controls and oil exports.
Indian Rupee Movements
1991 crisis forced devaluation.
2008 crisis → rupee fell due to capital outflows.
Recent years: rupee under pressure due to oil imports and strong US dollar.
Part 7: Implications of Exchange Rate Fluctuations
1. On Trade
A weaker currency makes exports cheaper, boosting demand abroad.
But it makes imports more expensive, adding inflationary pressure.
2. On Inflation
Import-dependent economies (like India with oil) see higher inflation when their currency depreciates.
3. On Investment
FIIs gain/loss depends on both stock performance and currency movement.
Currency depreciation can wipe out returns.
4. On Government Policy
Central banks adjust interest rates, intervene in forex markets, and build reserves.
5. On Common People
Travelers, students abroad, NRIs, and businesses all feel the effect of currency changes.
Part 8: Managing Exchange Rate Risk
Hedging with Derivatives
Forwards, futures, options, and swaps help companies lock in exchange rates.
Natural Hedging
Matching foreign currency revenues with expenses.
Diversification
Spreading trade and investments across multiple currencies.
Government Policies
Building forex reserves, imposing capital controls, or adjusting interest rates.
Part 9: The Future of Exchange Rate Dynamics
Digital Currencies
Central Bank Digital Currencies (CBDCs) may change cross-border payments.
Geopolitical Realignment
De-dollarization attempts by BRICS could alter forex dynamics.
Climate & Commodity Shocks
Weather events affecting agriculture and energy may impact currencies.
AI & Algorithmic Trading
High-frequency forex trading will increase volatility.
Conclusion
Exchange rate dynamics and fluctuations are at the heart of the global economy. They result from a complex interplay of trade, investment, inflation, interest rates, speculation, and geopolitics. No single factor explains all movements—currencies reflect the combined pulse of global markets.
For policymakers, managing exchange rates is a balancing act between stability and flexibility. For businesses, it’s a constant risk to hedge against. For investors, it’s both a challenge and an opportunity.
Ultimately, exchange rates are more than numbers—they represent the relative strength, stability, and future expectations of nations in the interconnected global system.
Currency Wars & Competitive Devaluation1. Understanding Currency Wars
1.1 Definition
A currency war refers to a situation in which countries intentionally manipulate their exchange rates to gain trade advantages. This is usually done by keeping their currency undervalued against major global currencies (such as the US Dollar or Euro), making their exports cheaper and imports more expensive.
1.2 Difference between Normal Exchange Rate Policies and Currency Wars
Normal Exchange Rate Adjustments: Countries may let market forces or monetary policy determine currency values based on economic fundamentals.
Currency Wars: Deliberate interventions—such as excessive printing of money, cutting interest rates aggressively, or directly buying foreign currencies—to weaken domestic currency beyond fundamentals.
1.3 Why Nations Engage in Currency Wars
Boost Exports: Cheaper currency makes exports more competitive.
Reduce Imports: Costlier imports encourage domestic consumption.
Stimulate Growth: Export-led growth can help recover from recessions.
Tackle Deflation: Weak currency raises import prices, generating inflation.
2. Competitive Devaluation
2.1 Definition
Competitive devaluation occurs when multiple countries sequentially lower the value of their currencies in response to each other’s actions. It’s essentially a “race to the bottom,” where no one wins in the long run, but everyone suffers from instability.
2.2 Mechanisms of Devaluation
Monetary Policy Tools: Central banks reduce interest rates or engage in quantitative easing (printing money).
Foreign Exchange Interventions: Governments or central banks sell domestic currency and buy foreign reserves.
Capital Controls: Restrictions on inflows/outflows to maintain currency depreciation.
2.3 Historical Perspective of Competitive Devaluation
1930s Great Depression: Countries abandoned the gold standard and devalued currencies to boost exports.
1970s Bretton Woods Collapse: Exchange rate system breakdown triggered currency adjustments.
2008 Financial Crisis Aftermath: The US, Japan, and emerging economies engaged in aggressive monetary easing.
3. Historical Episodes of Currency Wars
3.1 The Great Depression (1930s)
Many countries abandoned the gold standard to devalue their currencies.
The US devalued the dollar under Roosevelt, while the UK left the gold standard in 1931.
This created a spiral of competitive devaluations, worsening global economic tensions.
3.2 Bretton Woods System Collapse (1971)
After World War II, the Bretton Woods system pegged currencies to the US dollar.
In 1971, the Nixon Shock ended dollar-gold convertibility.
Currencies began floating, leading to sharp adjustments and devaluations.
3.3 Plaza Accord (1985)
The US dollar had appreciated significantly, hurting American exports.
G5 nations (US, Japan, UK, France, West Germany) agreed to weaken the dollar.
A coordinated effort prevented disorderly currency competition.
3.4 Post-2008 Financial Crisis
The US Federal Reserve launched quantitative easing (QE), weakening the dollar.
Emerging markets like Brazil accused the US of starting a “currency war.”
Japan’s Abenomics policy in 2012–13 was also criticized as competitive devaluation.
4. Tools and Strategies of Currency Wars
4.1 Monetary Policy Tools
Lowering Interest Rates: Reduces returns for investors, weakening currency.
Quantitative Easing (QE): Increases money supply, pressuring currency downward.
4.2 Direct Interventions
Central banks buy foreign currencies (e.g., US dollars, euros) to push domestic currency lower.
Example: China’s PBoC interventions to keep the yuan undervalued.
4.3 Trade and Fiscal Measures
Export subsidies or import tariffs indirectly support devaluation effects.
Capital controls prevent appreciation from foreign investment inflows.
4.4 Communication & Market Signals
Central banks sometimes issue statements signaling dovish policies to influence expectations.
5. Impact of Currency Wars
5.1 Positive Effects (Short-Term)
Boosts Exports: Domestic products become cheaper abroad.
Supports Growth: Export-led demand revives economies.
Manages Deflation: Import inflation helps economies facing deflation.
5.2 Negative Effects (Long-Term)
Retaliation: Other countries devalue, nullifying initial benefits.
Inflationary Pressure: Rising import prices fuel inflation.
Loss of Investor Confidence: Sudden devaluations deter foreign investors.
Trade Tensions: Devaluation leads to accusations of currency manipulation.
Global Instability: Competitive devaluation creates uncertainty in capital flows.
6. Case Studies of Currency Wars
6.1 The US and China
The US has long accused China of keeping the yuan undervalued.
This helped China’s export-led growth model, but created global imbalances.
The 2019 US-China trade war also had a currency dimension, with the yuan weakening.
6.2 Japan’s Abenomics (2012–2013)
Japan used aggressive monetary easing to weaken the yen.
This helped Japanese exports but attracted criticism from trading partners.
6.3 Emerging Market Economies
Countries like Brazil, India, and South Korea faced currency inflows due to US QE.
To protect domestic industries, they intervened to curb currency appreciation.
7. Role of International Institutions
7.1 International Monetary Fund (IMF)
Monitors exchange rate policies.
Can label a country a “currency manipulator” if it deliberately undervalues its currency.
Provides a platform for coordination to avoid competitive devaluations.
7.2 G20 and G7
Forums where countries pledge to avoid competitive devaluation.
Example: G20 statement in 2013 against currency wars.
8. Theoretical Perspectives
8.1 Beggar-Thy-Neighbor Policy
Currency wars are a form of “beggar-thy-neighbor” policy—where one nation’s gain (through exports) comes at another’s expense.
8.2 Game Theory and Currency Wars
Each country has an incentive to devalue, but if all devalue, everyone loses.
This creates a prisoner’s dilemma in international economics.
9. Currency Wars in the 21st Century
9.1 Digital Currencies and Devaluation
Central Bank Digital Currencies (CBDCs) could alter how nations influence exchange rates.
Competition among digital currencies may add new layers to currency wars.
9.2 Geopolitics and Sanctions
The US dollar’s dominance gives the US leverage through sanctions.
Countries like Russia and China promote alternatives (yuan, ruble, gold).
9.3 Post-COVID Era
Pandemic recovery led to massive stimulus and QE across the world.
The risk of currency tensions resurfaced as nations pursued divergent recovery paths.
10. Preventing Currency Wars
10.1 Coordination through Global Forums
Stronger cooperation at IMF, G20, WTO levels can reduce unilateral actions.
10.2 Transparent Monetary Policies
Clear communication by central banks helps avoid misinterpretation of currency intentions.
10.3 Diversified Global Reserve System
Reducing dependence on the US dollar could limit imbalances.
10.4 Regional Currency Agreements
Like the Eurozone, regional cooperation may prevent internal currency competition.
Conclusion
Currency wars and competitive devaluation are complex phenomena that reveal the deep interconnectedness of global economies. While weakening a currency may bring short-term benefits in terms of exports and growth, the long-term consequences often outweigh the advantages. Retaliatory actions, inflationary pressures, trade tensions, and financial instability make currency wars a dangerous economic strategy.
In today’s globalized world, where supply chains and financial markets are deeply integrated, no country can devalue its way to prosperity without harming others. The challenge, therefore, lies in balancing domestic economic needs with global stability. International cooperation, transparency in monetary policies, and reforms in global financial governance remain essential to preventing destructive cycles of competitive devaluation.
Currency wars are, in essence, economic battles without winners. History shows us that the path of cooperation, not confrontation, leads to sustainable prosperity.
Emerging Markets vs Developed Markets1. Defining Emerging and Developed Markets
Emerging Markets
Defined by the World Bank, IMF, and MSCI as economies transitioning from low or middle-income to higher-income levels.
Often characterized by rapid GDP growth, increasing foreign investment, and structural reforms.
Have growing but still volatile financial markets.
Examples: India, China, Brazil, Mexico, Turkey, South Africa.
Developed Markets
Countries with high per-capita income (usually above $12,000-$15,000), strong institutions, and advanced infrastructure.
Financial systems are stable, liquid, and globally integrated.
Economies are more service-oriented rather than manufacturing-driven.
Examples: U.S., U.K., Germany, Japan, Canada, Australia.
2. Key Economic Characteristics
Feature Emerging Markets Developed Markets
GDP Growth Higher growth rates (5–8% in many cases) Lower growth (1–3%)
Per Capita Income Low to middle-income High-income
Industrial Structure Manufacturing & agriculture dominant, but services growing Services dominate (finance, technology, healthcare)
Innovation Catching up; dependent on FDI & imports Advanced R&D, global tech leaders
Currency Stability Volatile, prone to inflation Stable, globally traded (USD, Euro, Yen)
Emerging markets are often seen as growth stories, while developed markets represent stability and maturity.
3. Financial Market Differences
Emerging Markets
Stock markets are less liquid, meaning large trades can move prices dramatically.
Higher volatility due to political risk, regulatory uncertainty, and global capital flows.
Often more sector-concentrated (energy, banking, infrastructure).
Foreign Direct Investment (FDI) plays a big role in financing growth.
Developed Markets
Deep, highly liquid capital markets (e.g., U.S. stock market is the largest in the world).
Lower volatility, with strong institutional investors (pension funds, insurance companies).
More diverse sectoral representation (tech, healthcare, finance, industrials).
Better regulations, reducing systemic risks.
4. Investment Opportunities
Why Investors Choose Emerging Markets
Higher returns: Fast economic growth means higher equity and bond returns (though riskier).
Demographics: Younger populations, rising middle class, and urbanization.
Undervalued assets: Stocks and bonds often trade at cheaper valuations compared to developed markets.
Natural resources: Many emerging economies are rich in oil, gas, and minerals.
Why Investors Choose Developed Markets
Stability: Political stability, strong legal protections, and reliable institutions.
Liquidity: Easy entry and exit in large markets like the U.S. and Europe.
Innovation hubs: Developed countries lead in technology, biotech, and finance.
Lower risk: Investors prefer developed markets during global uncertainty.
5. Risk Factors
Emerging Markets Risks
Political Risk: Government instability, corruption, and inconsistent policy.
Currency Risk: Devaluation or inflation affecting returns.
Liquidity Risk: Difficulty in buying/selling assets without price disruptions.
Regulatory Risk: Sudden changes in trade policy, taxes, or financial rules.
Dependence on Commodities: Economies like Brazil or Russia depend heavily on oil/mineral exports.
Developed Markets Risks
Slower Growth: Returns are lower due to market maturity.
Aging Population: Japan and Europe face demographic challenges.
Debt Levels: High government debt (U.S., Japan).
Global Linkages: Developed markets are highly exposed to global downturns.
6. Role in Global Trade
Emerging Markets: Supply labor-intensive goods, commodities, and raw materials. They are key players in global manufacturing supply chains (China, Vietnam, India).
Developed Markets: Supply high-value goods and services like technology, finance, pharmaceuticals, aerospace, and luxury products.
Emerging economies are often the producers, while developed markets are the consumers and innovators.
7. Examples of Emerging vs Developed Markets
Emerging Markets Examples
India: Fastest-growing large economy, driven by services and IT.
China: World’s factory, now transitioning toward consumption-driven growth.
Brazil: Rich in natural resources but faces political and inflation challenges.
South Africa: Gateway to Africa, but troubled by inequality and governance issues.
Developed Markets Examples
United States: World’s largest economy, innovation hub (Silicon Valley, Wall Street).
Germany: Europe’s powerhouse, strong in engineering and manufacturing.
Japan: Technology-driven, though aging demographics challenge growth.
United Kingdom: Major financial center, diversified economy.
8. Performance Trends
Emerging markets tend to outperform during global booms due to higher growth and demand for commodities.
Developed markets perform better in downturns, as investors flock to safe assets.
Over the last two decades, China and India have been the growth engines, while the U.S. has remained the financial powerhouse.
9. Case Study: 2008 Financial Crisis vs COVID-19 Pandemic
2008 Crisis: Developed markets (U.S., Europe) were hit hardest due to financial exposure. Emerging markets recovered faster, supported by China’s stimulus.
COVID-19 Pandemic: Emerging markets struggled due to weak healthcare and high debt, while developed economies used fiscal stimulus and central banks to stabilize markets.
This highlights how resilience differs across categories.
10. Future Outlook
Emerging Markets: Expected to drive global growth due to demographics, urbanization, and technology adoption. India and Southeast Asia are especially promising.
Developed Markets: Will remain leaders in innovation, finance, and global institutions. However, slower growth and aging populations will challenge long-term momentum.
Integration: The line between emerging and developed is blurring. Countries like South Korea, Singapore, and Taiwan once considered “emerging” are now closer to developed status.
Conclusion
The distinction between emerging markets and developed markets is fundamental in understanding global economics and finance. Emerging markets offer growth, opportunities, and dynamism, while developed markets provide stability, maturity, and reliability.
For investors, businesses, and policymakers, the choice is not about preferring one over the other but about balancing exposure to both. A diversified portfolio that captures the growth of emerging markets while relying on the stability of developed markets is often the most effective approach.
The future will likely see more emerging economies transition into developed ones, reshaping the global economic order. India, China, and parts of Africa may become the next growth engines, while developed countries will continue leading in technology and governance.
In summary, emerging markets are the growth frontier, while developed markets remain the anchors of global stability. Understanding their differences is key to navigating global finance and economics.
Stock Market Crashes & Their Global ImpactIntroduction
Stock markets are often described as the heartbeat of modern economies. They reflect investor confidence, corporate performance, and broader macroeconomic conditions. When markets rise steadily, optimism spreads across societies—businesses expand, jobs are created, and wealth grows. But when they crash, the opposite happens: wealth evaporates, panic sets in, and economies often spiral into recession or even depression.
A stock market crash is typically defined as a sudden, dramatic decline in stock prices across major indexes, often accompanied by panic selling and loss of investor confidence. Crashes are not mere financial events; they ripple through entire economies, affecting employment, government policies, trade, and even geopolitical stability.
This essay explores the history of major crashes, their causes, consequences, and the global impact they leave behind. It also discusses the lessons learned and whether crashes can be prevented—or if they are an unavoidable feature of capitalism.
Understanding Stock Market Crashes
A stock market crash differs from a normal market correction. A correction is usually a modest decline (around 10–20%), often seen as healthy after strong rallies. A crash, however, is sudden and severe, typically involving a drop of 20% or more in a very short time.
Key characteristics of a crash include:
Panic selling – Investors rush to liquidate holdings, driving prices down further.
Liquidity crisis – Buyers disappear, making it difficult to sell assets at fair value.
Systemic contagion – Losses spread to other sectors like banking, housing, and commodities.
Psychological impact – Fear and loss of trust in financial systems exacerbate the downturn.
Historical Stock Market Crashes
1. The Panic of 1907
Triggered by a failed attempt to corner the copper market, the 1907 crash caused bank runs across the U.S. The absence of a central bank made matters worse until J.P. Morgan personally intervened to provide liquidity. The crisis directly led to the creation of the U.S. Federal Reserve in 1913.
2. The Great Depression (1929–1939)
The crash of October 1929 is the most infamous. The Dow Jones lost almost 90% of its value from peak to trough. Banks failed, unemployment in the U.S. reached 25%, and global trade collapsed as protectionist tariffs rose. The Great Depression reshaped the global order and gave rise to both welfare capitalism and extreme political movements.
3. Black Monday (1987)
On October 19, 1987, global markets lost trillions in value, with the Dow plunging 22% in a single day—the largest one-day percentage drop in history. Interestingly, the economic fundamentals were relatively strong, but computerized program trading amplified panic. This crash led to better circuit-breaker mechanisms.
4. Dot-Com Bubble (2000–2002)
Fueled by excessive speculation in internet startups, tech stocks soared in the late 1990s. When profitability didn’t match expectations, the bubble burst, erasing $5 trillion in market value. Many companies went bankrupt, but survivors like Amazon and Google emerged stronger.
5. Global Financial Crisis (2008–2009)
Triggered by the collapse of the U.S. housing bubble and subprime mortgages, this crash nearly collapsed the global banking system. Lehman Brothers’ bankruptcy sent shockwaves worldwide. Governments had to bail out banks, and trillions were injected into economies. The aftershocks shaped global monetary policy for over a decade.
6. COVID-19 Pandemic Crash (2020)
In March 2020, as the pandemic spread globally, markets experienced one of the fastest declines in history. Supply chains froze, oil prices collapsed, and entire economies went into lockdown. Central banks intervened with massive liquidity injections, and markets rebounded faster than expected, though inequality widened.
Causes of Stock Market Crashes
Speculative Bubbles – Excessive optimism leads investors to drive prices far beyond intrinsic values (e.g., tulip mania, dot-com bubble).
Leverage & Debt – Borrowed money magnifies gains but also magnifies losses when markets turn.
Banking Failures – Weak banking systems spread panic when liquidity dries up.
Geopolitical Events – Wars, oil shocks, or political instability can trigger sudden sell-offs.
Technological Factors – Automated trading systems can accelerate crashes.
Psychological Herding – Fear and greed amplify movements, leading to irrational decisions.
Economic & Social Consequences
A market crash is not just numbers falling on screens; it creates real-world damage:
Wealth Destruction – Households lose savings, pensions shrink, and corporate valuations collapse.
Unemployment – Businesses cut back, leading to layoffs and wage stagnation.
Banking Stress – Non-performing loans rise, banks tighten credit, stifling growth.
Government Debt – States often borrow heavily to stabilize economies, leading to long-term fiscal challenges.
Social Unrest – Rising inequality, poverty, and frustration often trigger protests and political upheaval.
Shift in Global Power – Crashes can weaken one region while strengthening another (e.g., U.S. decline in 1930s, rise of Europe and later Asia).
Global Ripple Effects
Stock markets are interconnected; a crash in one major market spills over into others.
Trade Decline: Reduced demand lowers imports/exports, hurting global supply chains.
Currency Volatility: Investors flee to safe havens like gold, U.S. treasuries, or the Swiss franc.
Capital Flight: Emerging markets often see massive outflows during global downturns.
Policy Shifts: Central banks coordinate interventions, lowering rates and providing stimulus.
Geopolitical Shifts: Crashes often weaken alliances, spark nationalism, or accelerate the rise of new powers.
Case Study: 2008 Crisis Global Impact
U.S.: Housing collapse, unemployment peaking at 10%, massive bailouts.
Europe: Sovereign debt crises in Greece, Spain, and Italy.
Asia: Export-driven economies like China saw slowed growth, but also emerged as stronger alternatives to Western dependence.
Developing Nations: Suffered from falling commodity prices, reduced remittances, and currency instability.
This showed how deeply integrated the global economy had become.
Lessons Learned
Stronger Regulation – The 2008 crash showed the need for tighter oversight of derivatives and shadow banking.
Central Bank Coordination – Global central banks now act in unison to stabilize liquidity.
Risk Management – Investors are more cautious about leverage and speculative excess.
Diversification – Global portfolios help mitigate region-specific risks.
Psychological Awareness – Understanding behavioral finance helps explain panic-driven moves.
Are Crashes Preventable?
History suggests crashes are not entirely preventable because markets are built on human behavior, which swings between fear and greed. However, their severity can be managed:
Circuit breakers and trading halts prevent extreme panic.
Transparent regulation reduces systemic risk.
Global cooperation cushions shocks.
Investor education lowers herd mentality.
The Future of Stock Market Crashes
Looking ahead, new risks emerge:
Algorithmic & AI Trading – Speed of trading could magnify volatility.
Cryptocurrency Integration – Digital assets could create new bubbles.
Climate Change – Extreme weather could disrupt industries, creating market shocks.
Geopolitical Tensions – Trade wars, cyber conflicts, and resource scarcity may fuel future crises.
While markets will continue to experience crashes, societies are better equipped to handle them—though not immune.
Conclusion
Stock market crashes are dramatic reminders of the fragility of financial systems. They destroy wealth, disrupt lives, and alter the trajectory of nations. From the Great Depression to COVID-19, each crash has reshaped global finance, politics, and society.
Yet, paradoxically, crashes also pave the way for renewal. They expose weaknesses, force reforms, and create opportunities for resilient businesses to thrive. In this sense, crashes are not just destructive—they are part of capitalism’s self-correcting cycle.
For investors, policymakers, and citizens, the lesson is clear: crashes cannot be avoided, but their impact can be mitigated through preparation, diversification, and prudent regulation. The challenge is not to eliminate volatility but to ensure societies are resilient enough to withstand it.
U.S. Housing DashboardU.S. Housing Market Dashboard. Grab the chart and study along!
Indicators used: USCSHPIYY, FIXHAI, USHST, USBP, USEHS, USMAPL, MORTGAGE30US, DRSFRMACBS
Row 1: Prices and affordability
Row 2: Supply
Row 3: Demand
Row 4: Financing conditions and mortgage stress
USCSHPIYY
Measuring : Case-Shiller Home Price Index (YoY)
Relevance : Benchmark measure of U.S. home price appreciation
Observe : Rising YoY = price inflation / tight supply; Falling YoY = correction risk
FIXHAI
Measuring : Housing Affordability Index (Fixed)
Relevance : Tracks if a median-income family can afford a median-priced home given current prices and mortgage rates
Observe : >100 = affordability is healthy; <100 = affordability stress
USHST
Measuring : Housing Starts
Relevance : Actual new residential construction activity, near-term supply
Observe : Growth = builder confidence; Decline = slowdown in new supply
USBP
Measuring : Building Permits
Relevance : Future housing pipeline, leading indicator of supply
Observe : Decline = pipeline drying up; Increase = expansion confidence
USEHS
Measuring : Existing Home Sales
Relevance : Resale activity, and demand in the housing market
Observe : Rising = strong demand/liquidity; Falling = frozen or weakening market
USMAPL
Measuring : Mortgage Applications
Relevance : Fast-moving gauge of homebuyer demand, reacts quickly to mortgage rate changes
Observe : Surges = buyers returning; Declines = affordability bite
MORTGAGE30US
Measuring : 30-Year Fixed Mortgage Rate
Relevance : Central financing cost, primary driver of affordability
Observe : Rising = demand slowdown; Falling = demand boost
DRSFRMACBS
Measuring : Delinquency Rate on Single-Family Residential Mortgages (Commercial Banks)
Relevance : Tracks financial stress in the housing market via late payments and defaults
Observe : Rising = cracks in housing/credit cycle; Falling = stability and healthier credit conditions

U.S. Macroeconomic DashboardThis is more of a cheatsheet/how-to for my own reference on my macro indicators charting layout. If the chart layout is helpful to the community, all the better! I find it useful for studying events and crises.
Indicators used: SPX, VIX, FEDFUNDS + US10Y + T10Y2Y, USIRYY + USCIR, UNRATE, USBCOI, BAMLH0A0HYM2, DXY
Row 1: Equity and volatility benchmarks
Row 2: Policy stance and inflation
Row 3: Unemployment and growth metrics
Row 4: Credit spreads and USD strength
SPX
Measuring : Equity benchmark
Relevance : Broadest market barometer
Observe : Trend direction, key levels, divergence vs other indicators
VIX
Measuring : Volatility index
Relevance : Market's implied volatility (read: "fear/greed gauge")
Observe : Spike --> risk-off, hedging demand; sustained lows --> complacency
FEDFUNDS + US10Y + T10Y2Y
Measuring : U.S. policy stance and yield curve
Relevance : Monetary tightening and loosening; yield curve recession slope
Observe : T10Y2Y curve inversion --> recession risk; bear steepening --> watch for inflation/deficit concerns; bull steepening --> Fed easing, recovery signal
USIRYY + USCIR
Measuring : Inflation
Relevance : Headline: all prices; Core: Excluding food + energy
Observe : Headline stat drives short-term moves. Core stat drives Fed policy
UNRATE
Measuring : Unemployment rate
Relevance : Labor market health (this is a lagging indicator)
Observe : Rising trend --> recession risk; very low --> possible overheating
USBCOI
Measuring : Manufacturing PMI; Business activity
Relevance : Leading growth indicator for manufacturing, services
Observe : >50 means expansion, <50 means contraction
BAMLH0A0HYM2
Measuring : U.S. High Yield Option-Adjusted Spread (the extra yield/spread investors demand to hold junk bonds vs risk-free Treasuries)
Relevance : Stress in corporate bond markets; risk sentiment
Observe : Widening --> investors demand more compensation for credit risk; narrowing --> investors are confident, low fear of defaults. 2-4 is normal, 4-6 is stressed, 6+ is distress, 10+ is crisis level
DXY
Measuring : USD strength
Relevance : Global liquidity, capital flows, financial conditions
Observe : Strong USD = tighter conditions and pressure on risk assets; inverse for weak USD

Global Private Equity Trends1. Introduction
Private equity (PE) has emerged as one of the most powerful forces in global finance. Over the last four decades, it has transformed from a niche investment strategy practiced by a handful of firms into a multi-trillion-dollar asset class that shapes industries, creates jobs, restructures companies, and influences the broader global economy.
The private equity model—raising capital from institutional investors, acquiring or investing in private companies, actively managing them, and ultimately exiting at a profit—has proven highly successful. Today, pension funds, sovereign wealth funds, university endowments, and family offices rely on private equity as a key component of their portfolios.
But the private equity industry is not static. It evolves in response to macroeconomic conditions, technological innovation, regulatory shifts, and investor demands. In recent years, global private equity trends have reflected both challenges—rising interest rates, geopolitical instability, inflation—and opportunities—digital transformation, ESG investing, and emerging market growth.
2. Historical Evolution of Private Equity
The origins of private equity date back to the mid-20th century. In the 1940s and 1950s, early venture capital firms in the U.S. funded technology startups and post-war industrial companies. The modern private equity boom began in the 1980s, with leveraged buyouts (LBOs) making headlines—most famously the $25 billion buyout of RJR Nabisco by KKR in 1989.
The 1990s saw PE expand into Europe and Asia, with institutional investors increasingly allocating capital. By the 2000s, private equity had become mainstream, with mega-funds raising tens of billions of dollars. The global financial crisis of 2008 slowed activity, but the industry rebounded strongly in the 2010s, fueled by low interest rates and abundant liquidity.
By the 2020s, private equity assets under management (AUM) exceeded $10 trillion, cementing its role as a dominant force in global finance.
3. The Global Scale of Private Equity
As of 2024, global private equity AUM is estimated to exceed $12 trillion, making it one of the fastest-growing segments of the alternative investment universe. North America remains the largest hub, followed by Europe and Asia-Pacific. However, new regions—such as the Middle East and Africa—are increasingly attracting investor interest.
Private equity firms vary in size, from global giants like Blackstone, KKR, Carlyle, and Apollo, to specialized boutique firms focused on specific sectors or geographies. This diversity contributes to a wide spectrum of investment strategies, from billion-dollar buyouts to small growth-capital investments.
4. Key Drivers of Private Equity Growth
Several forces underpin the rise of private equity:
Institutional Investor Demand: Pension funds and sovereign wealth funds allocate heavily to private equity for higher returns compared to public markets.
Low Public Market Returns: Sluggish equity markets push investors toward alternative assets.
Operational Value Creation: Unlike passive stockholders, PE firms actively manage portfolio companies, improving efficiency and profitability.
Globalization of Capital: Cross-border deals and global funds create opportunities beyond domestic markets.
Technological Innovation: PE firms increasingly invest in tech-driven companies and use data analytics to enhance decision-making.
5. Regional Trends in Private Equity
North America
The U.S. remains the largest and most mature private equity market.
Mega-funds dominate, but mid-market firms thrive in niche strategies.
Strong focus on technology, healthcare, and financial services.
Europe
Regulatory oversight is stronger, especially post-Brexit.
Countries like the U.K., Germany, and France are major PE hubs.
Infrastructure and ESG-driven deals are gaining traction.
Asia-Pacific
China and India are hotbeds of growth equity and venture deals.
Japan and South Korea are seeing more buyouts.
Sovereign wealth funds in Singapore and the Middle East play key roles as LPs.
Middle East & Africa
The Gulf states, especially Saudi Arabia and the UAE, are deploying sovereign wealth funds into global private equity.
Africa offers opportunities in infrastructure, fintech, and consumer markets, though risks remain high.
Latin America
Brazil and Mexico are leading PE markets.
Focus on energy, fintech, and consumer growth stories.
Political instability is a limiting factor.
6. Sectoral Trends in Private Equity
Technology
Cloud computing, cybersecurity, fintech, and AI startups attract significant PE capital.
Many PE firms are setting up tech-dedicated funds.
Healthcare
Aging populations and post-pandemic healthcare reforms drive investments.
Biotech, pharmaceuticals, and healthcare services are hotspots.
Infrastructure & Energy
Renewable energy projects are a major PE focus, especially in Europe and Asia.
Infrastructure funds targeting transport, logistics, and utilities are growing.
Consumer & Retail
PE firms are adapting to e-commerce-driven retail models.
Luxury brands and lifestyle companies remain attractive.
Financial Services
Fintech and digital banking are top priorities.
Insurance and asset management firms are also targets for buyouts.
7. Deal-Making Trends
Buyouts: Leveraged buyouts remain the backbone of PE, though high interest rates challenge traditional models.
Growth Equity: Rising interest in scaling innovative companies without full buyouts.
Venture Capital Convergence: Many PE firms are moving into late-stage venture deals.
Distressed & Special Situations: Economic uncertainty creates opportunities in restructuring and distressed debt.
Secondary Market Deals: The secondary market for PE fund stakes has grown into a $100+ billion segment.
8. Fundraising Dynamics
Mega-Funds vs. Mid-Market: Mega-funds raise over $20 billion each, while mid-market players thrive in niche areas.
Niche & Sector-Specific Funds: Focus on technology, ESG, healthcare, and infrastructure.
ESG & Impact Funds: Increasingly popular among institutional investors seeking responsible investing.
9. Exit Strategies
IPOs: Still attractive, though public market volatility poses challenges.
Strategic Sales: Corporations buying PE-backed firms remain a strong exit path.
Secondary Buyouts: Common in mature markets where PE firms sell to other PE players.
Recapitalizations: Partial exits allow firms to return capital while retaining ownership.
10. Role of Technology & Data in Private Equity
AI and machine learning enhance deal sourcing, due diligence, and risk assessment.
Big data analytics improve operational oversight of portfolio companies.
Digital transformation is now a value-creation strategy, not just a risk factor.
Conclusion
Private equity has grown into a cornerstone of global finance, shaping economies and industries. While challenges remain—rising interest rates, regulatory hurdles, and geopolitical risks—the long-term growth story of private equity remains intact. Its adaptability, global reach, and ability to create value beyond capital injection make it an enduring force.
Looking ahead, the industry will continue to evolve—becoming more technology-driven, more sustainability-focused, and more globally interconnected. For investors, entrepreneurs, and policymakers, understanding private equity trends is essential to navigating the future of finance.

Global Agricultural Commodities MarketWhat Are Agricultural Commodities?
Agricultural commodities are raw, unprocessed products grown or raised to be sold or exchanged. They fall broadly into two categories:
Food Commodities
Grains & cereals: Wheat, rice, maize, barley, oats.
Oilseeds: Soybeans, rapeseed, sunflower, groundnut.
Fruits & vegetables: Bananas, citrus, potatoes, onions.
Livestock & animal products: Beef, pork, poultry, dairy, eggs.
Tropical commodities: Coffee, cocoa, tea, sugar.
Non-Food Commodities
Fibers: Cotton, jute, wool.
Biofuel crops: Corn (ethanol), sugarcane (ethanol), palm oil, soy oil (biodiesel).
Industrial crops: Rubber, tobacco.
These commodities are traded on spot markets (immediate delivery) and futures markets (contracts for future delivery). Futures trading, which developed in places like Chicago and London, allows farmers and buyers to hedge against price fluctuations.
Historical Context of Agricultural Commodities Trade
Ancient Trade: The Silk Road and spice trade routes included agricultural goods like rice, spices, and tea. Grain storage and trade were central to the Roman Empire and ancient Egypt.
Colonial Era: European colonial powers built empires around commodities like sugar, cotton, tobacco, and coffee.
20th Century: Mechanization, the Green Revolution, and globalization expanded agricultural production and trade.
21st Century: Digital platforms, biotechnology, and sustainability initiatives shape modern agricultural commodity markets.
This long history shows how agriculture is not just economic, but political and cultural.
Key Players in the Global Agricultural Commodities Market
Producers (Farmers & Agribusinesses): Smallholder farmers in Asia and Africa; large-scale industrial farms in the U.S., Brazil, and Australia.
Traders & Merchants: Multinational corporations known as the ABCD companies—Archer Daniels Midland (ADM), Bunge, Cargill, and Louis Dreyfus—dominate global grain and oilseed trade.
Governments & Agencies: World Trade Organization (WTO), Food and Agriculture Organization (FAO), national agricultural boards.
Financial Institutions & Exchanges: Chicago Board of Trade (CBOT), Intercontinental Exchange (ICE), and hedge funds/speculators who trade futures.
Consumers & Industries: Food processing companies, retailers, biofuel producers, and ultimately, households.
Major Agricultural Commodities and Their Markets
1. Cereals & Grains
Wheat: Staple for bread and pasta, major producers include Russia, the U.S., Canada, and India.
Rice: Lifeline for Asia; grown largely in China, India, Thailand, and Vietnam.
Corn (Maize): Used for food, feed, and ethanol; U.S. and Brazil dominate exports.
2. Oilseeds & Oils
Soybeans: Key protein for animal feed; U.S., Brazil, and Argentina lead.
Palm Oil: Major in Indonesia and Malaysia; used in food and cosmetics.
Sunflower & Rapeseed Oil: Important in Europe, Ukraine, and Russia.
3. Tropical Commodities
Coffee: Produced mainly in Brazil, Vietnam, Colombia, and Ethiopia.
Cocoa: Critical for chocolate; grown in West Africa (Ivory Coast, Ghana).
Sugar: Brazil, India, and Thailand dominate.
4. Livestock & Dairy
Beef & Pork: U.S., Brazil, China, and EU major players.
Poultry: Fastest-growing meat sector, strong in U.S. and Southeast Asia.
Dairy: New Zealand, EU, and India lead in milk and milk powder exports.
5. Fibers & Industrial Crops
Cotton: Vital for textiles; India, U.S., and China are leading producers.
Rubber: Largely grown in Southeast Asia for tires and industrial use.
Factors Influencing Agricultural Commodity Markets
Weather & Climate: Droughts, floods, hurricanes, and heatwaves strongly affect supply.
Technology: Mechanization, biotechnology (GM crops), digital farming, and precision agriculture boost productivity.
Geopolitics: Wars, sanctions, and trade disputes disrupt supply chains (e.g., Russia-Ukraine war and wheat exports).
Currency Fluctuations: Commodities are priced in USD; exchange rates impact competitiveness.
Government Policies: Subsidies, tariffs, price supports, and export bans affect markets.
Consumer Demand: Rising demand for protein, organic food, and biofuels shapes production.
Speculation: Futures and derivatives markets amplify price volatility.
Supply Chain of Agricultural Commodities
Production (Farmers).
Collection (Local traders & cooperatives).
Processing (Milling, crushing, refining).
Storage & Transportation (Warehouses, silos, shipping lines).
Trading & Export (Grain merchants, commodity exchanges).
Retail & Consumption (Supermarkets, restaurants, households).
The supply chain is global—soybeans grown in Brazil may feed livestock in China, which supplies meat to Europe.
Global Trade in Agricultural Commodities
Top Exporters: U.S., Brazil, Argentina, Canada, EU, Australia.
Top Importers: China, India, Japan, Middle East, North Africa.
Trade Routes: Panama Canal, Suez Canal, Black Sea, and major ports like Rotterdam, Shanghai, and New Orleans.
Agricultural trade is often uneven—developed nations dominate exports, while developing nations rely heavily on imports.
Price Volatility in Agricultural Commodities
Agricultural commodities are highly volatile due to:
Seasonal cycles of planting and harvest.
Weather shocks (El Niño, La Niña).
Energy prices (fertilizers, transport).
Speculative trading on futures markets.
Volatility impacts both farmers’ incomes and consumers’ food security.
Role of Futures and Derivatives Markets
Commodity exchanges such as CBOT (Chicago), ICE (New York), and NCDEX (India) allow:
Hedging: Farmers and buyers reduce risk by locking in prices.
Speculation: Traders bet on price movements, adding liquidity but also volatility.
Price Discovery: Futures prices signal supply-demand trends.
Challenges Facing the Global Agricultural Commodities Market
Climate Change: Increased droughts, floods, and pests reduce yields.
Food Security: Rising global population (10 billion by 2050) requires 50% more food production.
Trade Wars & Protectionism: Export bans (e.g., rice from India, wheat from Russia) destabilize markets.
Sustainability: Deforestation for soy and palm oil, pesticide use, and water scarcity are major concerns.
Market Power Concentration: Few large corporations dominate, raising fairness concerns.
Infrastructure Gaps: Poor roads, ports, and storage in developing nations lead to waste.
Future Trends in Agricultural Commodities Market
Sustainability & ESG: Demand for eco-friendly, deforestation-free, and fair-trade commodities.
Digitalization: Blockchain for traceability, AI for crop forecasting, precision farming.
Biofuels & Renewable Energy: Growing role of corn, sugarcane, and soy in energy transition.
Alternative Proteins: Lab-grown meat, plant-based proteins reducing demand for livestock feed.
Regional Shifts: Africa emerging as a key producer and consumer market.
Climate-Resilient Crops: GM crops resistant to drought, pests, and diseases.
Case Studies
Russia-Ukraine War (2022–2025): Disrupted global wheat, corn, and sunflower oil supply, driving food inflation.
COVID-19 Pandemic (2020): Supply chain breakdowns exposed vulnerabilities in agricultural trade.
Palm Oil in Indonesia: Tensions between economic growth and environmental concerns over deforestation.
Conclusion
The global agricultural commodities market is one of the most important pillars of the world economy. It determines food security, influences geopolitics, and drives livelihoods for billions of farmers. However, it is also one of the most vulnerable markets—shaped by climate change, population growth, technological advances, and political instability.
In the future, balancing food security, sustainability, and fair trade will be the central challenge. With the right policies, innovation, and cooperation, agricultural commodity markets can continue to feed the world while protecting the planet.

Global Supply Chain Challenges1. Complexity and Interdependence
One of the biggest challenges of global supply chains is their complexity. Unlike traditional domestic supply chains where most processes are localized, global supply chains involve:
Multiple countries producing different components.
Long transportation routes across oceans and continents.
Coordination among suppliers, manufacturers, warehouses, and retailers.
Dependence on international trade regulations and customs.
For instance, a single smartphone may include rare earth minerals from Africa, semiconductors from Taiwan, assembly in China, and distribution worldwide. If one link fails—say, a port strike in the U.S. or a political dispute in Asia—the entire chain suffers delays and shortages.
This high interdependence means companies cannot operate in isolation. A disruption in one country cascades globally, making supply chain resilience a top concern for businesses.
2. Geopolitical Risks
Geopolitical tensions have always influenced global trade, but recent years have seen an escalation in conflicts that directly impact supply chains:
Trade Wars: The U.S.-China trade war led to tariffs on hundreds of billions worth of goods, forcing companies to rethink their sourcing strategies.
Sanctions and Restrictions: Sanctions on countries like Russia and Iran disrupt the supply of vital energy resources and raw materials.
Conflicts and Wars: The Russia-Ukraine war has severely disrupted grain and energy supplies, causing ripple effects worldwide.
Rising Nationalism: Many countries are moving toward “protectionism,” encouraging local manufacturing instead of relying on imports.
These risks make global supply chains unpredictable. Companies are increasingly exploring China+1 strategies (diversifying production beyond China) and regional supply chain models to reduce exposure.
3. Transportation and Logistics Bottlenecks
The efficient movement of goods is critical for supply chains, but several issues plague the global logistics industry:
Port Congestion: Major ports such as Los Angeles, Shanghai, and Rotterdam often face severe backlogs, delaying shipments for weeks.
Container Shortages: The COVID-19 pandemic revealed imbalances in container availability, as containers got stuck in regions with low exports.
Rising Freight Costs: Shipping costs have skyrocketed in recent years, sometimes increasing fivefold, which directly affects product pricing.
Infrastructure Limitations: Developing countries often lack efficient road, rail, and port infrastructure, adding delays.
Disruptions in Key Routes: Blockages like the 2021 Suez Canal crisis showed how a single incident can paralyze global trade.
Logistics providers are adopting digital tracking, automation, and AI-driven route optimization to address these challenges, but the issues remain significant.
4. Climate Change and Natural Disasters
Climate change has emerged as a critical threat to supply chain stability. Extreme weather events disrupt production, transportation, and distribution. Examples include:
Flooding in Thailand (2011) that severely impacted global electronics and automotive supply chains.
Hurricanes in the U.S. causing oil refinery shutdowns and fuel shortages.
Wildfires in Australia and California disrupting agricultural production.
Moreover, climate change brings regulatory challenges. Many countries are now implementing carbon border taxes, demanding cleaner supply chains. Companies must invest in sustainability—using renewable energy, reducing emissions, and adopting circular economy models—while still managing costs.
5. Pandemics and Health Crises
The COVID-19 pandemic exposed the fragility of global supply chains like never before. Lockdowns, labor shortages, and border closures created massive disruptions:
Factories shut down, halting production of critical goods.
Global demand patterns shifted (e.g., rise in demand for PPE and semiconductors).
Transportation capacity was severely limited.
Panic buying and hoarding caused shortages of essentials.
Even post-pandemic, supply chains continue to struggle with aftershocks—semiconductor shortages, rising e-commerce demand, and workforce restructuring. This has led companies to explore resilient supply chain models focusing on agility, redundancy, and digital monitoring.
6. Labor and Workforce Challenges
Global supply chains rely heavily on human labor at every stage—manufacturing, warehousing, shipping, and retail. However, several issues create challenges:
Labor Shortages: Many industries, particularly trucking and shipping, face chronic labor shortages.
Poor Working Conditions: Sweatshops, low wages, and unsafe working environments create ethical concerns.
Union Strikes: Port worker or factory strikes can halt production for weeks.
Skill Gaps: The shift to digital technologies requires skilled workers in areas like data analytics and AI, but there is a global shortage of such talent.
Companies must invest in workforce development, automation, and fair labor practices to ensure long-term stability.
7. Supply Chain Visibility and Transparency
One of the toughest challenges is the lack of visibility across complex supply chains. Many companies only know their first-tier suppliers but have little knowledge of second- or third-tier suppliers. This lack of transparency creates risks in:
Identifying bottlenecks.
Ensuring compliance with regulations.
Tracking unethical practices such as forced labor or environmental harm.
Digital technologies like blockchain, IoT sensors, and AI analytics are increasingly being used to improve visibility and traceability. However, implementing these systems across global networks is expensive and time-consuming.
8. Cybersecurity Risks
As supply chains become digitized, they are also exposed to cyber threats. Cyberattacks on logistics firms, shipping companies, and manufacturers can cripple operations. For example:
The Maersk cyberattack (2017) disrupted global shipping for weeks.
Ransomware attacks on manufacturing plants caused production halts.
Data breaches expose sensitive supplier and customer information.
Securing global supply chains requires strong cybersecurity protocols, international cooperation, and investment in resilient IT systems.
9. Regulatory and Compliance Challenges
Operating across multiple countries means companies must navigate a complex web of laws and regulations:
Customs Regulations: Varying import-export rules increase costs and delays.
Environmental Laws: Stricter sustainability standards demand cleaner processes.
Product Standards: Different countries have different quality and safety requirements.
Data Protection Laws: With digital trade, compliance with laws like GDPR adds complexity.
Failure to comply can result in fines, reputational damage, and disrupted operations.
10. Rising Costs and Inflation
Another major challenge is the rising cost of operating global supply chains:
Raw Materials: Prices of commodities such as oil, metals, and agricultural products fluctuate widely.
Transportation: Higher fuel costs and freight rates directly impact profitability.
Labor Costs: Wages are rising in traditional manufacturing hubs like China, pushing companies to explore alternatives such as Vietnam and India.
Inflation: Global inflation reduces consumer demand, making supply chains less predictable.
Companies are balancing cost efficiency with resilience—sometimes choosing more expensive but reliable regional sourcing models.
Conclusion
Global supply chains are both the strength and vulnerability of the modern economy. While they enable efficiency, affordability, and innovation, they are also highly exposed to risks—geopolitical, environmental, technological, and social. The challenges are vast and interconnected, meaning solutions require not just corporate strategies but also international cooperation, regulatory reforms, and technological innovation.
In the coming decades, the most successful supply chains will be those that balance cost, resilience, and sustainability. They will not just deliver products efficiently but also adapt quickly to disruptions, respect environmental standards, and uphold ethical values. The challenges are immense, but they also offer opportunities to build stronger, smarter, and more sustainable global supply networks.

The Four Different Sideways TrendsIn the modern Market Structure, stocks, indexes and industry indexes move sideways or trend moving horizontally most of the time. Understanding this phenomenon and how to use it to your advantage is important to learn.
There are 4 different types of price moving sideways:
1. The consolidation is a very narrow price range, often less than 5% but can be wider. The consolidation trend usually lasts a few days to a few weeks. The price action is very tight and small. Pro traders dominate consolidations usually. Price pings between a narrow price range low and high. Price is a penny spread or few pennies at most. This means the candlesticks are very very small and tightly compacted.
Consolidations are relatively easy to identify on a stock chart. These pattern create a liquidity shift which an HFT AI algo discovers and triggers its automated orders to drive price up or down based on the positions the pro traders are holding.
Consolidations create fast paced momentum and velocity runs that you can take advantage of IF you learn to enter the position BEFORE HFTs and then the smaller funds, retail day traders and gamblers drive price upward. You and pro traders ride the run until you see a Pro trader exit candle pattern to close the position.
2. The Platform Position sideways trend is also very precise with consistent highs and lows. These are the realm of the Dark Pools hidden accumulation and if you are trying to day trade a platform then it will whipsaw and cause losses. The width is too narrow for day trading. The platform is about 10% of the price in width. Platforms form after a market has had a correction and numerous stocks are building bottoms. Once the bottom completes and the Dark Pools recognize that the stock price is below fundamental levels the Dark Pool raise their buy zone price range to a new level. Often HFTs gap up a stock and then Dark Pools resume their hidden accumulation at that higher level. The goal is to enter just before the HFT gap up to the new fundamental level for swing or day trading.
Platforms offer low risk and the position can be held for weeks or months generating excellent income with minimal time for busy trades who do not have the time to swing trade. Platforms are also good for swing traders if they time their entry correctly.
3. Sideways trends are a mix of retail investors and retail day traders, smaller funds managers and sometimes Dark Pools hidden within the wider sideways trend. These trends with the wider mix of market participants have inconsistent highs and lows which often times causes retail day traders losses as they do not understand the dynamics of the wide sideways trend. These sideways trends are more than 10% and as wide as 20% of the stock price.
4. The Trading Range is the hardest to trade and often causes the most losses as frequently the trading range is so wide it is not easily recognized on the daily charts but is visible and obvious on a weekly chart. The inconsistent highs and lows within the very wide trading range cause problems and losses for most day and swing retail traders.
The size differential of each sideways trend tells you WHO is in control of price and how to trade it for maximum profits, lower risk, and to make trading fun rather than harder.

Trading Probability Index – A Simple Framework to Judge Trade Qu📖 Description:
Most traders enter positions without measuring probability. This framework solves that.
The Trading Probability Index (TPI) combines:
✔️ Confluences (indicators & structure)
✔️ Liquidity zones
✔️ Market structure shifts
✔️ Historical edge
It categorizes setups from Very Low → High Probability so traders know when to stay flat, go small, or go big with conviction.
📊 In this example, the trade scored 64 → High Probability Zone, meaning the setup has strong confluence and is worth taking—with proper risk management.
This tool helps traders filter noise, focus on quality setups, and avoid overtrading.
👉 Do you have your own system to measure trade quality? Or do you go by gut feeling?
Impact of Trade Wars on Global CommoditiesUnderstanding Trade Wars
Definition
A trade war occurs when countries engage in escalating retaliatory trade barriers, such as tariffs (taxes on imports), export bans, or quotas. Unlike routine trade disputes resolved through institutions like the World Trade Organization (WTO), trade wars are prolonged confrontations that can severely disrupt global supply chains.
Causes of Trade Wars
Protection of domestic industries – Governments impose tariffs to shield local producers from cheaper foreign imports.
Geopolitical tensions – Strategic rivalry between powers (e.g., U.S.–China).
Perceived unfair trade practices – Accusations of currency manipulation, dumping, or intellectual property theft.
Political populism – Leaders appeal to domestic audiences by promising to revive manufacturing or agriculture.
Mechanisms of Impact
Trade wars affect commodities through:
Tariffs: Increasing the cost of imports reduces demand.
Supply chain disruptions: Restrictions create shortages or gluts in certain markets.
Currency fluctuations: Retaliatory measures often cause volatility in exchange rates.
Investor sentiment: Commodities markets react to uncertainty with price swings.
Historical Trade Wars and Commodities Impact
The U.S.–China Trade War (2018–2020)
The most notable recent example is the U.S.–China trade war, where both nations imposed tariffs on billions of dollars’ worth of goods. Its impact on commodities was profound:
Agricultural Products: China, a major buyer of U.S. soybeans, shifted its purchases to Brazil and Argentina. U.S. farmers faced significant losses, while South American exporters gained.
Metals: U.S. tariffs on Chinese steel and aluminum disrupted global metals supply, increasing costs for downstream industries.
Oil and Gas: China reduced imports of U.S. crude oil, turning to Russia and the Middle East instead.
1970s Oil Crisis and Resource Nationalism
While not a conventional “trade war,” the OPEC oil embargo of 1973 illustrates how commodity trade restrictions can destabilize global markets. By restricting oil exports, OPEC caused a dramatic rise in crude oil prices, triggering global inflation and recessions.
Japan–U.S. Trade Disputes (1980s–1990s)
The U.S. imposed restrictions on Japanese automobiles, semiconductors, and steel. While not as aggressive as the China case, it influenced global steel and automotive commodity supply chains.
Impact on Different Commodities
1. Agricultural Commodities
Trade wars hit agriculture hardest because food products are politically sensitive and heavily traded.
Soybeans: In the U.S.–China conflict, soybean exports from the U.S. plummeted by over 50% in 2018. Brazil emerged as the biggest beneficiary.
Wheat and Corn: Farmers faced surplus production when markets closed, leading to lower farm incomes.
Meat and Dairy: Tariffs on pork and beef reduced demand, leading to oversupply and lower domestic prices.
Key Point: Agricultural producers in exporting countries often lose, while rival exporters in neutral countries gain market share.
2. Energy Commodities
Energy is both a strategic and economic commodity. Trade wars disrupt supply chains and create uncertainty.
Crude Oil: During the U.S.–China dispute, China reduced U.S. crude imports. Instead, it boosted imports from Russia, reshaping global oil flows.
Liquefied Natural Gas (LNG): China, a top LNG importer, reduced its contracts with U.S. suppliers, affecting American energy exports.
Coal: Tariffs on coal imports can shift demand toward domestic suppliers, though with environmental consequences.
Result: Trade wars encourage diversification of energy suppliers, altering global energy geopolitics.
3. Metals and Minerals
Metals are essential inputs for manufacturing and construction. Tariffs in this sector ripple across industries.
Steel and Aluminum: U.S. tariffs in 2018 raised global prices temporarily, hurting consumers (e.g., automakers) but boosting U.S. domestic producers.
Copper: As a key industrial metal, copper prices fell due to weaker global demand expectations from trade wars.
Rare Earth Elements: China, controlling over 80% of rare earth supply, threatened export restrictions during tensions—causing panic in tech and defense industries.
Observation: Strategic metals become bargaining chips in geopolitical disputes.
4. Precious Metals
Gold, silver, and platinum group metals behave differently in trade wars:
Gold: Seen as a “safe haven,” gold prices typically rise during trade war uncertainty. Example: Gold surged during U.S.–China tensions.
Silver and Platinum: Both industrial and investment commodities, they experience mixed effects—falling demand from industries but rising investor interest.
Economic Consequences of Commodity Disruptions
For Producers
Loss of export markets (e.g., U.S. soybean farmers).
Price crashes in domestic markets due to oversupply.
Increased costs if reliant on imported raw materials.
For Consumers
Higher prices for finished goods (e.g., cars with more expensive steel).
Reduced availability of certain products.
Inflationary pressures in commodity-importing nations.
For Global Markets
Increased volatility in commodity exchanges (CME, LME).
Shifts in global trade flows, creating winners and losers.
Distortion of investment decisions in commodities futures markets.
Case Studies
Case Study 1: U.S. Soybean Farmers
When China imposed tariffs on U.S. soybeans, American farmers saw exports fall from $12 billion in 2017 to $3 billion in 2018. Despite government subsidies, many small farmers struggled. Brazil, however, expanded its exports to China, reshaping global agricultural trade.
Case Study 2: Steel Tariffs and the U.S. Auto Industry
The Trump administration’s tariffs on steel and aluminum in 2018 increased input costs for U.S. automakers. While domestic steel producers benefited, car manufacturers faced rising costs, reducing their global competitiveness.
Case Study 3: Rare Earths and Tech Industry
China’s threat to restrict rare earth exports during trade tensions with the U.S. in 2019 raised concerns for tech manufacturers, as rare earths are critical for smartphones, batteries, and defense equipment. Prices surged globally, forcing nations to seek alternative suppliers.
Long-Term Structural Shifts
Trade wars don’t just have short-term impacts; they reshape global commodity systems.
Diversification of Supply Chains
Importers diversify sources to reduce dependence on hostile nations. Example: China diversifying soybean imports beyond the U.S.
Rise of Regional Trade Blocs
Countries form regional agreements (e.g., RCEP, USMCA) to secure commodity flows.
Strategic Stockpiling
Nations build reserves of critical commodities (oil, rare earths, grains) to withstand disruptions.
Technological Substitution
Trade wars accelerate R&D in substitutes (e.g., battery technologies reducing dependence on cobalt).
Shift in Investment Flows
Investors prefer politically stable commodity suppliers, leading to long-term realignments.
Winners and Losers
Winners
Neutral exporting countries that capture lost market share (e.g., Brazil in soybeans).
Domestic producers shielded by tariffs (e.g., U.S. steel).
Investors in safe-haven commodities like gold.
Losers
Farmers and exporters in targeted nations.
Consumers facing higher prices.
Global growth, as uncertainty reduces trade volumes and investment.
Future Outlook
Increasing Commodities Nationalism
Countries may increasingly weaponize commodities as tools of leverage in geopolitical disputes.
Technology and Substitutes
Trade wars may accelerate innovation, such as renewable energy reducing reliance on imported fossil fuels.
Institutional Reforms
The WTO and other institutions may need reforms to mediate commodity-related disputes more effectively.
Climate Change Factor
As climate change reshapes commodity production (e.g., agriculture, water, energy), trade wars could worsen resource scarcity and volatility.
Conclusion
The impact of trade wars on global commodities is multi-dimensional and far-reaching. From agriculture to energy, metals to precious resources, trade disputes disrupt flows, distort prices, and realign global supply chains. While some nations or industries benefit temporarily, the broader effect is one of uncertainty, inefficiency, and economic loss.
In the long run, trade wars reshape the architecture of commodity markets—encouraging diversification, regionalism, and innovation. However, they also raise questions about the sustainability of globalization and the ability of international institutions to maintain stability in a fracturing world.
Ultimately, commodities—being the backbone of human survival and industrial growth—remain at the heart of trade wars. Understanding their dynamics is crucial not only for policymakers and businesses but also for ordinary citizens whose livelihoods are directly or indirectly tied to global trade.