Swing trade ticker SMHI company Seacor MarineBullish swing trade on a daily chart. I need a pullback to the bullish fair value gap 13.05 for entry. Pullback will take liquidity from Fridays low before continuing uptrend. The ideal setup would have the of the touch of the fair value gap and touch of the 21 EMA at the same time.

SONY MASSIVE BEARISH DIVERGENCE SPOTTEDFundamentals also point down, the company just clones code and stops video game innovation.
Good game, bad manners.
LONG SQUEEZE POSSIBLE, THEY CAN'T PUMP OVER $111
Love,
dysonring2050

Citigroup is looking like an obvious buy!🔉Sound on!🔉
Thank you as always for watching my videos. I hope that you learned something very educational! Please feel free to like, share, and comment on this post. Remember only risk what you are willing to lose. Trading is very risky but it can change your life!

GME Gamestop Technical Analysis and Trade IdeaHistorically, GME (Gamestop) has been in a downtrend when we look at the monthly time frame. However, recent developments indicate a potential shift in the trend. As we zoom in on shorter time frames (weekly and daily), we observe signs of bullish momentum. Buyers may find opportunities in these tim

PFE long-term analysis, consolodating for new ATHI've used a few methods to understand potential price movement on NYSE:PFE , including a fib pitchfork, going back to 1972 as well as key support levels. I believe we're oversold and consolidating, soon to start the journey to ATH at the $75 level

Tesla Bull Or Bear TrendLike and Subscribe for live up to date trades!!
I'm personally buying calls ,($170ish calls) (stop loss $167) 2weeks
out!
I will also reverse my trade to short below $167
Will update daily on Tesla for you All

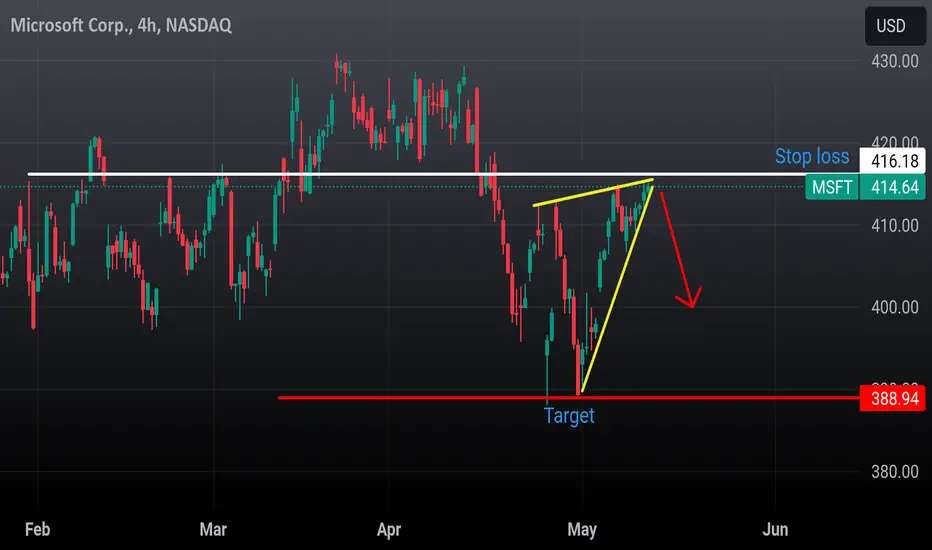
MSFT Bear pennant here. Looking for a move to close gap a 390 in the next 2weeks.!
Larger picture is a correction through a rising wedge (See link)..
That correction is still on going and i think Msft will retest 366 before this fall via H&S
XLK sector also at resistance here.. Overbought and se
AMD UpdateStill waiting for AMD carve out it's B wave of ii. I am still tracking the possibility of this being all we get for ii, but as stated previously, I don't feel that is the case. I would like to see us create a basic 3-wave move up into the target box labeled B before falling again for c of ii. Howeve

things may get spicy soon 🌶️🚀boost and follow for more 🔥 GME had a trend resistance zone break, retest, short trap below local support zone as the retest happened as well.
I Like what I'm seeing, my moon senses are tingling ;) looking for a explosive rally to 30-40-58 once we can close above 19.74 long trigger 🎯

Apple Nears Deal with OpenAI to Bring ChatGPT to iPhoneApple is reportedly close to finalizing a deal with OpenAI to integrate the popular large language model ChatGPT into its iPhone devices, marking a significant step in the company's efforts to bolster artificial intelligence (AI) features. This move comes as Apple strives to stay competitive in the

See all popular ideas
Community trends
Stock collections
All stocksLarge-capSmall-capLargest employersHigh-dividendHighest net incomeHighest cashHighest profit per employeeHighest revenue per employeeTop gainersBiggest losersMost activePre-market gainersPre-market losersPre-market most activePre-market gapAfter-hours gainersAfter-hours losersAfter-hours most activeUnusual volumeMost volatileHigh betaBest performingHighest revenueMost expensivePenny stocksPink sheetOverboughtOversoldAll-time highAll-time low52-week high52-week lowSee all
Sector 10 matches | Today | 1 week | 1 month | 6 months | Year to date | 1 year | 5 years | 10 years |
|---|---|---|---|---|---|---|---|---|
| Technology Services | ||||||||
| Finance | ||||||||
| Electronic Technology | ||||||||
| Health Technology | ||||||||
| Retail Trade | ||||||||
| Consumer Non-Durables | ||||||||
| Energy Minerals | ||||||||
| Producer Manufacturing | ||||||||
| Consumer Services | ||||||||
| Commercial Services |
Trade directly on the supercharts through our supported, fully-verified and user-reviewed brokers.

