Short EUR/AUD setup looking for retest of 1.6000Thursday's bearish engulfing candle has seen the price move below 1.6188, a level that has acted as both support and resistance over recent weeks.
If the price can remain beneath this level into the European open, consider shorting below with a stop above for protection.
The initial target would

The Payment Card Titan: Comparing Visa, Mastercard, and Amex◉ Abstract
The global credit card market is projected to grow from USD 559.18 billion in 2023 to USD 1,146.62 billion by 2033, driven by advancements in digital payment technologies, e-commerce growth, increased financial literacy, and urbanization, especially in Asia-Pacific.
Visa leads the marke

Update to Dow Jones Industrials Time At Mode Back in 2015 I had published a chart with annual data for the Dow Jones Industrials. I will provide a link at the bottom.
The research for this patterning is something I did myself by hand using pencil and paper back in the 1980's. These patterns show up in all time frames.
There is plenty of room

Tracking Inflation with this Ratio - Crude Oil vs Gold RatioThe Fed is using this Crude Oil vs Gold ratio in tracking inflation.
The one in white is the inflation and the one in yellow is the Crude Oil vs Gold ratio.
We saw that when inflation peaked at 9% in June 2022, so did this ratio.
Although we recently saw a cut in interest rates, the yields are n

Bitcoin Breakout or Pullback Zone Before Heading Higher? In this video we examine the current Bitcoin chart at resistance.
Most likely, we retrace here for a bit and then push higher into the next resistance zone of around $70k and possibly to retest the previous ATH zone @72k - 74k.
Lots of sell pressure at the previous ATH which can also be seen on th

SUI needs small correction to continue again...Currently, SUI is moving near the Resistance lines and the Potential Reversal Zone; as you see in 4h channel. SUI has been increase about 360% in two months. It seems that according to the good news that has come for the Sui project, the increase of the SUI token may continue, but it will experience

Traders could veer towards the yen with risk events loomingIt is no coincidence that VIX futures have been creeping higher in recent weeks despite Wall Street hitting record highs, as traders are presumably hedging downside risk as we approach the US election. And that means it may not take much to spook traders out of bullish bets with markets at frothy le


See all editors' picks ideas
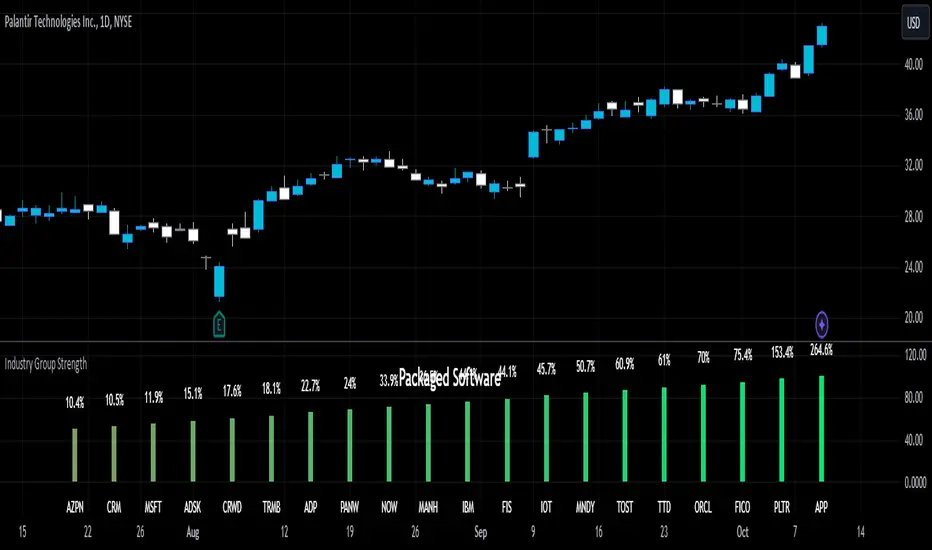
Industry Group StrengthThe Industry Group Strength indicator is designed to help traders identify the best-performing stocks within specific industry groups. The movement of individual stocks is often closely tied to the overall performance of their industry. By focusing on industry groups, this indicator allows you to
Periodic Linear Regressions [LuxAlgo]The Periodic Linear Regressions (PLR) indicator calculates linear regressions periodically (similar to the VWAP indicator) based on a user-set period (anchor).
This allows for estimating underlying trends in the price, as well as providing potential supports/resistances.
🔶 USAGE
The Period

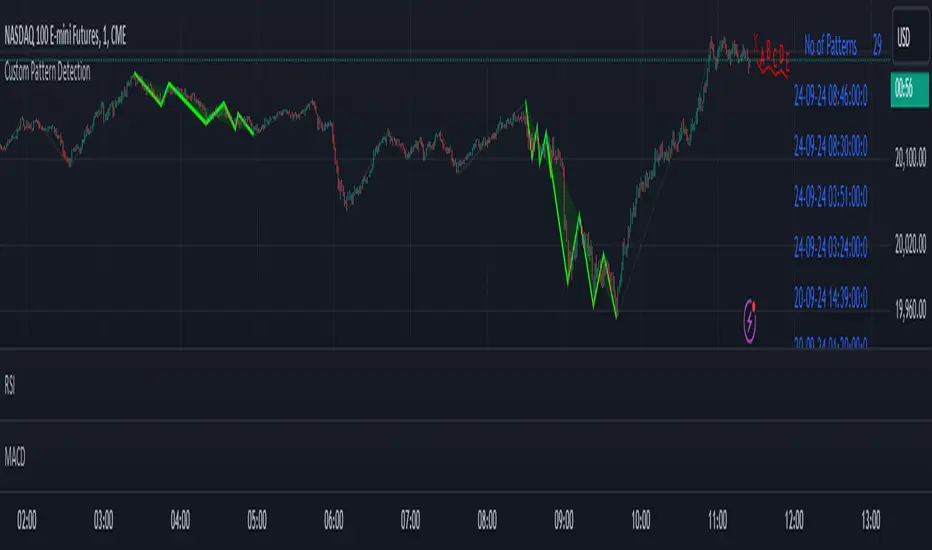
Custom Pattern DetectionOverview
Chart Patterns is a major tool for many traders. Pattern formation at specific location on the chart is used for investment/trading decisions.
This indicator is designed in a way to allow investors/traders to define patterns of their choice based on certain input parameters and then detec
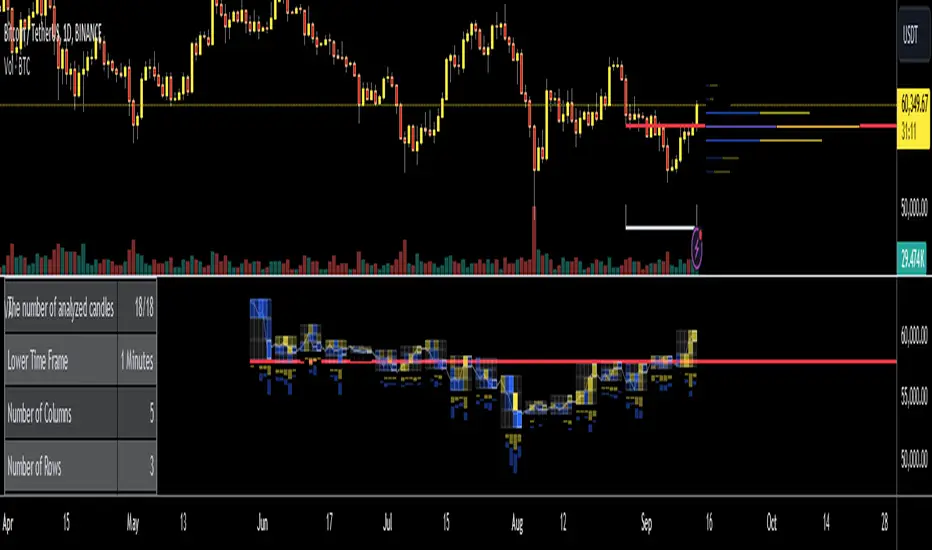
Volume Analysis - Heatmap and Volume ProfileHello All!
I have a new toy for you! Volume Analysis - Heatmap and Volume Profile . Honestly I started to work to develop Volume Heatmap then I decided to improve it and add more features such Volume profile, volume, difference in Buy/Sell volumes etc. I tried to put my abilities into this script
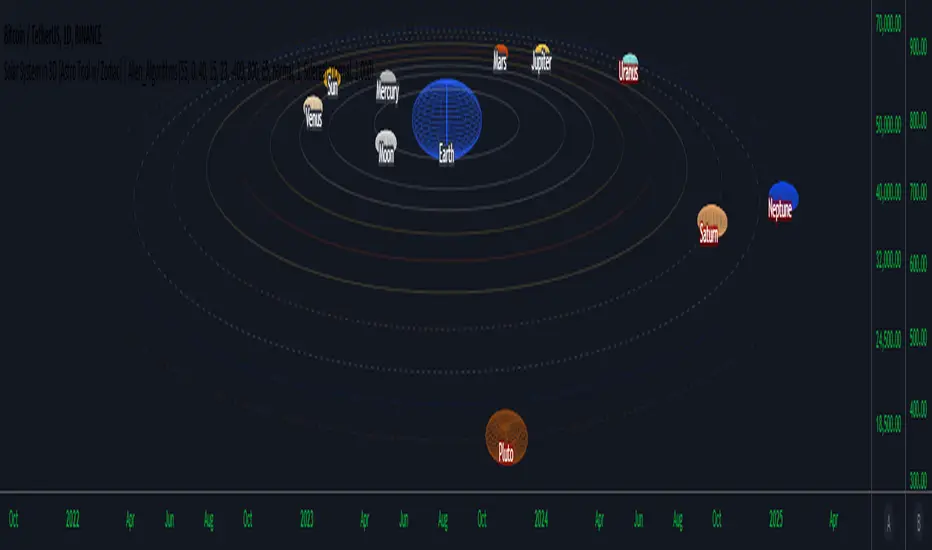
Solar System in 3D [Astro Tool w/ Zodiac]Hello Traders and Developers,
I am excited to announce my latest Open Source indicator. At the core, this is a demonstration of PineScript’s capabilities in Rendering 3D Animations, while at the same time being a practical tool for Financial Astrologists.
This 3D Engine dynamically renders all th
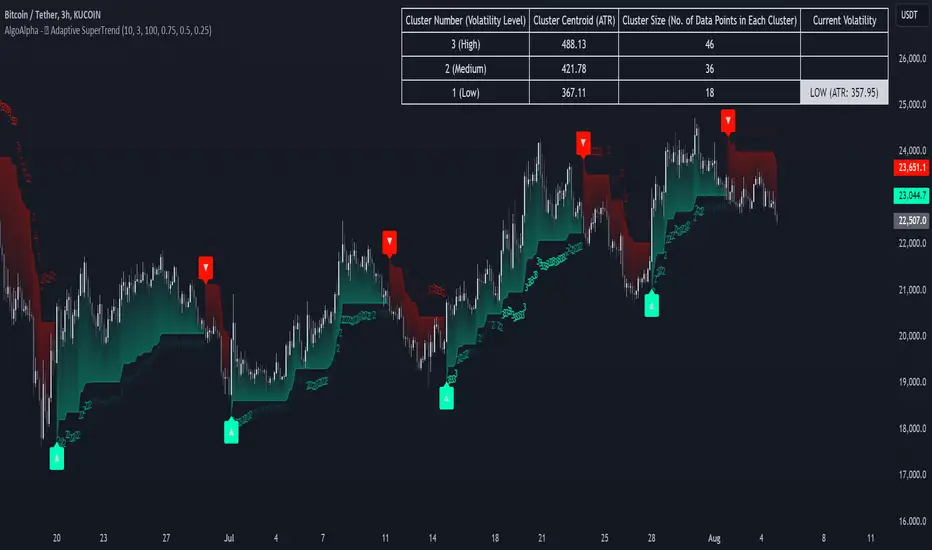
Machine Learning Adaptive SuperTrend [AlgoAlpha]📈🤖 Machine Learning Adaptive SuperTrend - Take Your Trading to the Next Level! 🚀✨
Introducing the Machine Learning Adaptive SuperTrend , an advanced trading indicator designed to adapt to market volatility dynamically using machine learning techniques. This indicator employs k-means clustering
D-Shape Breakout Signals [LuxAlgo]The D-Shape Breakout Signals indicator uses a unique and novel technique to provide support/resistance curves, a trailing stop loss line, and visual breakout signals from semi-circular shapes.
🔶 USAGE
D-shape is a new concept where the distance between two Swing points is used to creat

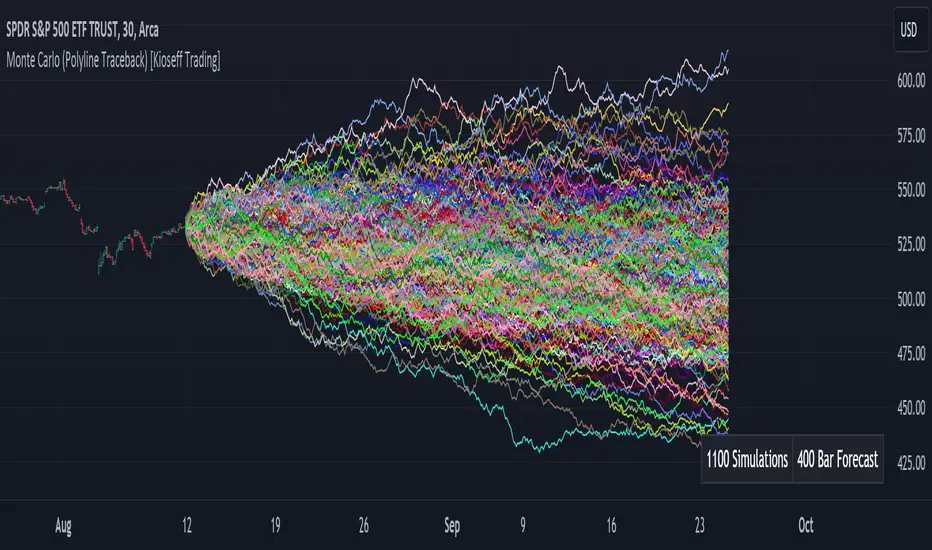
Monte Carlo (Polyline Traceback) [Kioseff Trading]Hello!
This script "Monte Carlo (Polyline Traceback) " performs a Monte Carlo simulation using polylines!
By using polylines, and tracing back the initial simulation to its origin point, we can better replicate the ideal output of a Monte Carlo simulation!
Such as:
The image above shows the
LOWESS (Locally Weighted Scatterplot Smoothing) [ChartPrime]LOWESS (Locally Weighted Scatterplot Smoothing)
⯁ OVERVIEW
The LOWESS (Locally Weighted Scatterplot Smoothing) [ ChartPrime ] indicator is an advanced technical analysis tool that combines LOWESS smoothing with a Modified Adaptive Gaussian Moving Average. This indicator provides traders with

Adaptive Trend Finder (log)In the dynamic landscape of financial markets, the Adaptive Trend Finder (log) stands out as an example of precision and professionalism. This advanced tool, equipped with a unique feature, offers traders a sophisticated approach to market trend analysis: the choice between automatic detection of th

See all indicators and strategies


