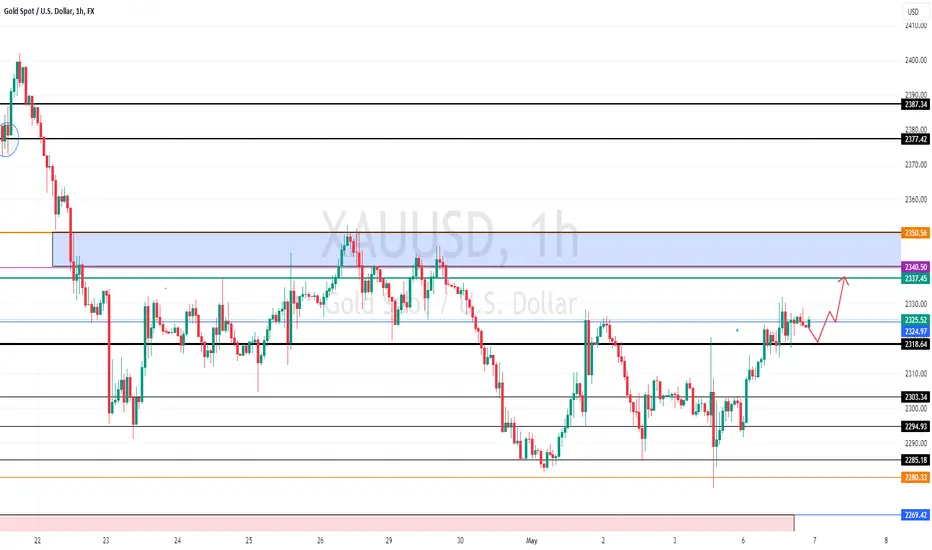
/
The best trades require research, then commitment.
$0 forever, no credit card needed
Leo Houlding, explorer
Where the world does markets
Join 100 million traders and investors taking the future into their own hands.
Love in every #TradingView
100M+
Traders and investors use our platform.
#1
Top website in the world when it comes to all things investing.
1.5M+
Mobile reviews with 4.9 average rating. No other fintech apps are more loved.
Netflix Pops as Earnings Top Estimates. Are Tariffs a Threat?Netflix NASDAQ:NFLX dropped its first-quarter earnings Thursday after market close and the headlines practically wrote themselves: a record net income, an earnings beat, and a 3% implied jump for the stock at the opening bell. All in a market where the Nasdaq is crying in the corner.
But as alwa
Gold - 7000 USD by 2027 (must see, sell here!)Gold is extremely bullish, but nothing lasts forever. To trade gold profitably, you need to always trade with a trend. Clearly the trend is bullish, so we want to open only long positions and avoid short positions to increase the probability of success, and it doesn't matter if you are an intraday o
S&P 500 - Key Levels and April 7-11 Weekly Candle StructureApril 7-11 will easily be remembered in 2025 as one of the craziest weeks in modern history.
Intraday swings were face ripping all from a Monday "fake news" becoming Wednesday "real news" with the US pausing tariffs for 90 days
5500 major resistance on S&P
4800 major support on S&P
I believe the
XAUUSD is in buy zone!After a short break on daily timeframe XAUUSD managed to breakout in the major direction of the trend with strong momentum with multiple liquidity grab from the support level. 5min shows a break of structure and drop to 3254.00 followed by strong rejection to the upside showing a high probability of
GOLD Trending Higher - Can buyers push toward 3,300$?OANDA:XAUUSD is trading within a well-defined ascending channel, with price action consistently respecting both the upper and lower boundaries. The recent bullish momentum indicates that buyers are in control, suggesting a potential continuation.
The price has recently broken above a key resistanc
How low Can the Dollar Go? And What It Could Mean for EUR/USDThe US dollar index has handed back all of its Q4 gains with traders betting that Trump's trade war will do more damage than good to the US economy. I update my levels on the US dollar index and EUR/USD charts then wrap up market exposure to USD index futures.
Crypto update 2025.04.14The current market moves due to tariffs are pushing away the interest from cryptos, as those are stuck somewhere between potentially being a safe-haven and still classed as a risky asset.
Let's dig in.
CRYPTO:BTCUSD
CRYPTO:BCHUSD
CRYPTO:ETHUSD
CRYPTO:LTCUSD
Let us know what you th
Tokenized AI-Agent. History and evolutionTokenized AI agents: a new foundation or a pretty wrapper?
If you spend at least some time on crypto Twitter or went to one of the fall crypto conferences, or even more so if you trade on on-chain, you can't have failed to hear about AI agents and the tokens around them. You're probably wondering wh
Ethereum Hits Critical Resistance — Is a Drop to $1400 Next?Introduction
Ethereum has been in a sustained downtrend over the past weeks, struggling to gain any real bullish traction. After a sharp decline last Sunday, the market remains under pressure, and although we’ve seen short-term attempts to recover, the broader trend still points downward. Technical
GOLD Price Analysis: Key Insights for Next Week Trading DecisionIn this video, I break down the key forces pushing gold to record highs. Learn how factors such as US-China trade tensions, global inflation pressures, and geopolitical uncertainty—combined with a weakening US Dollar and safe-haven demand—are reshaping the gold market.
In this quick analysis, we co
See all editors' picks ideas
Machine Learning RSI ║ BullVisionOverview:
Introducing the Machine Learning RSI with KNN Adaptation – a cutting-edge momentum indicator that blends the classic Relative Strength Index (RSI) with machine learning principles. By leveraging K-Nearest Neighbors (KNN), this indicator aims at identifying historical patterns that resembl
Half Causal EstimatorOverview
The Half Causal Estimator is a specialized filtering method that provides responsive averages of market variables (volume, true range, or price change) with significantly reduced time delay compared to traditional moving averages. It employs a hybrid approach that leverages both historica
BIN Based Support and Resistance [SS]This indicator presents a version of an alternative way to determine support and resistance, using a method called "Bins".
Bins provide for a flexible and interesting way to determine support and resistance levels.
First off, let's discuss BINS:
Bins are ranges or containers into which your
Probability Grid [LuxAlgo]The Probability Grid tool allows traders to see the probability of where and when the next reversal would occur, it displays a 10x10 grid and/or dashboard with the probability of the next reversal occurring beyond each cell or within each cell.
🔶 USAGE
By default, the tool displays deciles
Correlation Heatmap█ OVERVIEW
This indicator creates a correlation matrix for a user-specified list of symbols based on their time-aligned weekly or monthly price returns. It calculates the Pearson correlation coefficient for each possible symbol pair, and it displays the results in a symmetric table with heatmap
Tetris with Auto-PlayThis indicator is implemented in Pine Script™ v6 and serves as a demonstration of TradingView's capabilities. The core concept is to simulate a classic Tetris game by creating a grid-based environment and managing game state entirely within Pine Script.
Key Technical Aspects:
Grid Representation:
Log Regression Oscillator Channel [BigBeluga]
This unique overlay tool blends logarithmic trend analysis with dynamic oscillator behavior. It projects RSI, MFI, or Stochastic lines directly into a log regression channel on the price chart — offering an intuitive way to detect overbought/oversold momentum within the broader price structure.
Multitimeframe Fair Value Gap – FVG (Zeiierman)█ Overview
The Multitimeframe Fair Value Gap – FVG (Zeiierman) indicator provides a dynamic and customizable visualization of institutional imbalances (Fair Value Gaps) across multiple timeframes. Built for traders who seek to analyze price inefficiencies, this tool helps highlight potential ent
Relative Crypto Dominance Polar Chart [LuxAlgo]The Relative Crypto Dominance Polar Chart tool allows traders to compare the relative dominance of up to ten different tickers in the form of a polar area chart, we define relative dominance as a combination between traded dollar volume and volatility, making it very easy to compare them at a glan
Multi-Anchored Linear Regression Channels [TANHEF]█ Overview:
The 'Multi-Anchored Linear Regression Channels ' plots multiple dynamic regression channels (or bands) with unique selectable calculation types for both regression and deviation. It leverages a variety of techniques, customizable anchor sources to determine regression lengths, and
See all indicators and strategies
Community trends
Netflix Pops as Earnings Top Estimates. Are Tariffs a Threat?Netflix NASDAQ:NFLX dropped its first-quarter earnings Thursday after market close and the headlines practically wrote themselves: a record net income, an earnings beat, and a 3% implied jump for the stock at the opening bell. All in a market where the Nasdaq is crying in the corner.
But as alwa
Tesla - This Is Actually Not Gambling!Tesla ( NASDAQ:TSLA ) still looks quite bullish:
Click chart above to see the detailed analysis👆🏻
Just a couple of weeks ago I published a bunch of analysis, explaining all the reasons for a potential -40% drop on Tesla. However on the higher timeframe, Tesla still looks quite strong and with
UnitedHealth (UNH) Share Price PlummetsUnitedHealth (UNH) Share Price Plummets
UnitedHealth shares crashed by nearly 23% yesterday after the healthcare giant reported weaker-than-expected Q1 2025 results:
→ Earnings per share: actual = $7.20, expected = $7.29
→ Revenue: actual = $109.5bn, expected = $111.5bn
Technical Analysis o
TSLA Eiffel Tower Not CompleteEiffel tower patterns are rare but very powerful TA structures when they develop.
They are very hard patterns to short since we can never know when the wave up ends. However, there is so much information we can extract from them during and after the collapse.
When they are rising and going vertic
AMD to Retest SupportAMD has been in a descending price channel since November of 2024 with clear support and resistance established. On Monday we saw an attempt to breakout however it was rejected at the establish resistance line. Given the rejection and the significant drop that followed I think we will likely see AMD
Nvidia: Bullish Monday?A new week is about to get started and we would like to know if the NVIDIA Corporation (NVDA) chart supports a bullish Monday.
What is the chart saying on the daily timeframe?
The chart has many positive signals and support a strong week but...
Good Sunday my fellow Cryptocurrency trader, how ar
TSLA LONG ~ All the technicals are there!TSLA will still hit $2600 ~ Says Cathie Wood
Will it? Let's take a look ~
ELON is pissing people off and investors are worried, Tarrif FUD, brand deterioration.
All of this doesn't matter
Why?
Pull up TSLA YoY earnings since 2013 and you will see that their revenue growth is outrageous, this p
We potentially about to see a HUGE move on TSLAWe broke a SUPER LONG-TERM BEARISH TRENDLINE (blue) on the weekly timeframe.
+
We have been RANGING for quite some time...
+
TSLA has a personality of explosive, crazy moves
+
TSLA builds HUMAN ROBOTS... (SUPER HIGH VALUE in my opinion, the potential for this is astronomical)
What do we actually ne
See all stocks ideas
Today
GMGIGolden Matrix Group, Inc.
Actual
−0.03
USD
Estimate
−0.00
USD
Today
CWBCCommunity West Bancshares
Actual
—
Estimate
0.42
USD
Today
PCBPCB Bancorp
Actual
—
Estimate
0.49
USD
Today
BJDXBluejay Diagnostics, Inc.
Actual
—
Estimate
—
Today
LSBLakeShore Biopharma Co., Ltd
Actual
—
Estimate
−0.59
USD
Today
WMPNWilliam Penn Bancorporation
Actual
—
Estimate
−0.05
USD
Today
BLXBanco Latinoamericano de Comercio Exterior, S.A.
Actual
—
Estimate
—
Today
AIREreAlpha Tech Corp.
Actual
—
Estimate
−0.04
USD
See more events
Community trends
Bitcoin - Who Will Take Control: Bulls or Bears?Bitcoin is currently exhibiting a prolonged phase of sideways movement, trading within a clearly defined consolidation range. After a sharp move to the upside earlier this month, price has stalled and started to range between the resistance zone near $86,000 and support around $82,000. This type of
Bitcoin & ... Top Altcoins Choice— Your Pick (Session 2—2025)Bitcoin continues to do great and today moved for the first time above $86,000 after the 7-April 2025 market correction bottom and low. This is the lowest price before the 2025 bull market bullish cycle, phase and wave.
The 2025/26 bull market will be an extended bull market. The next All-Time High
BTCUSD: 4H Golden Cross to skyrocket it to $100kBitcoin has stabilized from the strong correction earlier in the month and that is reflected on its neutral 1D technical outlook (RSI = 53.619, MACD = 70.800, ADX = 32.691). This suggests that the market has priced a bottom and since it already broke over the LH trendline, the 4H Golden Cross that w
HelenP. I Bitcoin will drop, thereby breaking trend lineHi folks today I'm prepared for you Bitcoin analytics. Recently, price has been trading in a narrowing structure, forming a triangle pattern with a strong ascending trend line acting as support. This bullish line began developing after the price reversed from the 78500 - 79000 support zone, where bu
BITCOIN's secret catalyst. The Gold-to-Crypto Rotation Is ComingBitcoin (BTCUSD) is attempting to form a new medium-term bottom here, following the Tariffs-led sell-off of the past 2 months. While the crypto market is consolidating and accumulating, the Gold market is smashing every historic All Time High (ATH) after the other.
This is not the first time we see
BITCOIN - Price can little correct and then make impulse upHi guys, this is my overview for BTCUSDT, feel free to check it and write your feedback in comments👊
Recently price broke through the $79500 zone after a long phase of flat consolidation and sharp shakeout.
Once bulls reclaimed control, price formed a clean breakout and started building structure
SOL – Small pullback to then grab the liquidity?This 1H chart of SOLUSDT on Bybit showcases a clean bullish continuation setup after a strong impulsive move upward. The current price action suggests a strategic retracement into a high-probability zone of interest before a potential continuation toward buy-side liquidity.
---
1. Market Structur
Bitcoin Bearish Reversal Setup: Rising Wedge Breakdown Targeting1. Entry Point:
Marked around $86,853, this is where a potential short (sell) trade might have been initiated.
2. Stop Loss:
Placed above $88,783, protecting the trade in case the market goes against the position.
3. Target Point (Take Profit):
Aiming down toward $74,443.76, suggesting a la
TradeCityPro | Bitcoin Daily Analysis #65👋 Welcome to TradeCity Pro!
Let’s move on to the analysis of Bitcoin and key crypto indicators. In this analysis, as usual, I want to review the New York futures session triggers for you.
🔄 Yesterday, the market was range-bound again, and none of my triggers were activated. Today, a high has formed
SOLANA → Pre-breakout consolidation relative to 136.00BINANCE:SOLUSDT relative to the range support forms a false breakdown. The market reacts quite positively and the price recovers, forming a consolidation in front of strong resistance
Bitcoin is also in consolidation, as well as SOL, in general the movements coincide, but lately bitcoin is lea
See all crypto ideas
GOLD Bullish Continuation - Is $3,600 the Next Stop?OANDA:XAUUSD is trading within a well-defined ascending channel, signaling strong bullish momentum. The price has consistently respected the channel boundaries, forming higher highs and higher lows, which aligns with the continuation of the uptrend.
It has recently broken above a key resistance zo
Gold - 7000 USD by 2027 (must see, sell here!)Gold is extremely bullish, but nothing lasts forever. To trade gold profitably, you need to always trade with a trend. Clearly the trend is bullish, so we want to open only long positions and avoid short positions to increase the probability of success, and it doesn't matter if you are an intraday o
GOLD → Correction to support. What's next?FX:XAUUSD updates a new high to 3357. A correction is forming after Powell's speech. On the background of the bullish trend it is worth looking for stronger support levels
Gold halted gains at $3,358 as traders take profits and assess the implications of Trump's tariff policy.Gold's gains on t
OIL – Bearish Setup at FVG + Golden Pocket ConfluenceThis 4H chart of Crude Oil Futures highlights a clean bearish setup forming as price approaches a confluence zone of imbalance and premium pricing. After a sharp downward move, the current rally appears to be a retracement into areas of interest for potential distribution.
---
1. Context & Market
Hellena | Oil (4H): SHORT to support area of 55.204.Colleagues, I believe that the price will continue its downward movement. At the moment we are observing a combined correction. I expect the completion of wave “Y”. Even if it is already completed, the price is still waiting for a downward correction to the support area of 55.204. Therefore, I think
Lingrid | GOLD potential Trend Continuation FormationsOANDA:XAUUSD market pulled back as expected and retested 50% of the previous daily range. The market is forming bullish flag pattern or triangle pattern which are both trend continuation formations. If the price breaks above, it may trigger more upward pressure pushing price toward the channel bord
Gold - Why a drop to 3250 could be the perfect buy!Gold has been in a strong and sustained uptrend, showing impressive momentum with minimal pullbacks along the way. At the moment, Gold is forming a rising wedge pattern, which could indicate potential short-term downside price action. If we see a retracement from current levels, I’ll be watching clo
Gold can exit from wedge and drop to support levelHello traders, I want share with you my opinion about Gold. Price action on Gold has shown strong bullish momentum earlier, as it broke out of the previous upward channel and started forming an upward wedge. The rally gained traction once the price left the buyer zone between 3006 - 3025 points, pus
THE KOG REPORT - UpdateEnd of day update from us here at KOG:
Due to the holiday weekend we've taken it easy on the gold, only one short over for a fantastic capture and that's us done for the week.
Some levels to look for:
3224-26 resistance needs to break to go higher.
3280 needs to break to go lower.
Today's bias
The Secret Behind Stop-Loss Sweeps & How to Escape the Psycholog“You’re not losing trades because you’re unlucky…
You’re losing because someone out there is smarter — and they're hunting your stop.”
It’s time you see the real game behind every wick, fakeout, and reversal.
This isn’t guesswork. It’s called Liquidity Hunting — and it’s how institutions profit off
See all futures ideas
EURUSD - at Resistance: Will it drop to 1.11300?OANDA:EURUSD price is now at a strong resistance level, this is an area where it has struggled to break through in the past and reversed to the downside. It's also where sellers have stepped in before, so it’s worth keeping an eye on, especially for anyone considering short trades.
If we start see
USDCHF Discretionary Analysis: Bounce at 0.85Hello traders.
I'm anticipating the momentum on USDCHF to carry on. Got my eyes locked on the 0.85 area. It might turn into a strong bounce point. If the signs are there, I'm jumping in with a short.
Discretionary Trading: Where Experience Becomes the Edge
Discretionary trading is all about making
Euro may correct to support area and then rebound upHello traders, I want share with you my opinion about Euro. Looking at the chart, we can see that the price started its growth from the buyer zone between 1.0730 - 1.0785 points, where the price found strong support near the lower boundary of the broadening wedge. After bouncing off that zone, Euro
GBPUSD at Key Resistance - Time to Sell?OANDA:GBPUSD has reached a key resistance level, marked by significant selling pressure. This area has historically acted as a key supply zone, increasing the likelihood of a bearish reaction if sellers step in again.
The current market structure suggests that if the price confirms a rejection fro
HelenP. I Euro can make correction movement to $1.1150 pointsHi folks today I'm prepared for you Euro analytics. After testing the upper boundary of the ascending channel, the price showed signs of slowing momentum. Earlier, the price steadily climbed within the upward channel, forming consistently higher lows while bouncing from the lower trend line and supp
Could the price bounce from here?GBP/AUD is falling towards the pivot which is an overlap support and could bounce to the 1st resistance which acts as an overlap resistance.
Pivot: 2.0624
1st Support: 2.0413
1st Resistance: 2.1029
Risk Warning:
Trading Forex and CFDs carries a high level of risk to your capital and you should o
DeGRAM | GBPJPY Broke Down Triangle📊 Technical Analysis
GBP/JPY continues to move within a triangle, staying below the 189 level.
The 189.00 level remains a strong ceiling; rejection here signals continued downside.
If pressure holds, price may retest support around 184.75.
✨ Summary
Technical weakness + soft UK data + JP
USDJPY - Already Over-Sold!Hello TradingView Family / Fellow Traders. This is Richard, also known as theSignalyst.
📈USDJPY has been overall bearish trading within the falling wedge pattern marked in blue and it is currently hovering around the lower bound of it.
Moreover, the orange zone is a strong weekly support.
🏹 Thu
See all forex ideas
- | - | - | - | - | - | - | ||
- | - | - | - | - | - | - | ||
- | - | - | - | - | - | - | ||
- | - | - | - | - | - | - | ||
- | - | - | - | - | - | - | ||
- | - | - | - | - | - | - | ||
- | - | - | - | - | - | - | ||
- | - | - | - | - | - | - |
Trade directly on the supercharts through our supported, fully-verified and user-reviewed brokers.