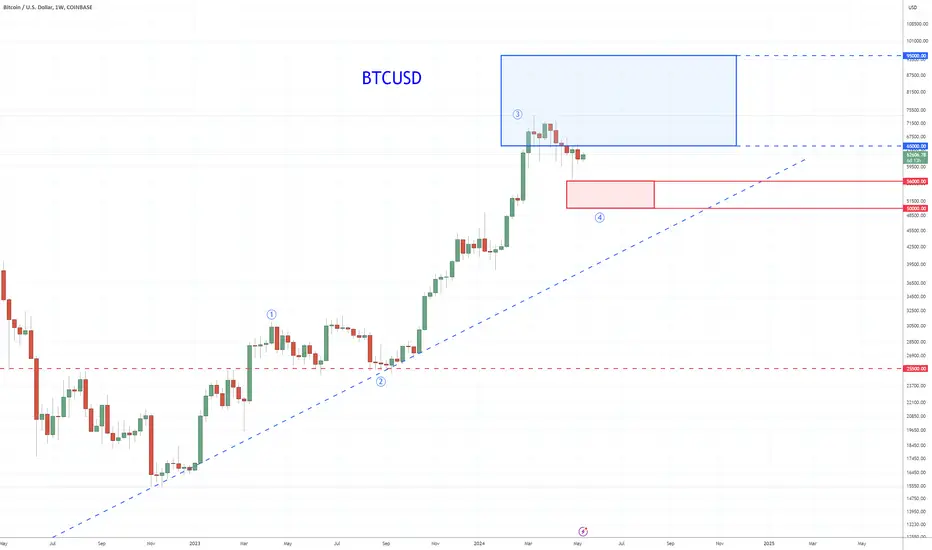
S&P 500
S&P 500 E-mini Futures
Crypto Market Cap, BTC/USD, ETH/USD, USDT/USD, XRP/USD, Bitcoin
Apple, Advanced Micro Devices Inc, Amazon Com Inc, TESLA INC, NETFLIX INC, Facebook Inc
S&P 500, Nasdaq 100, Dow 30, Russell 2000, U.S. Dollar Index, Bitcoin Index
US 10Y, Euro Bund, Germany 10Y, Japan 10Y Yield, UK 10Y, India 10Y
Continuing the few posts I want to do on basic indicators/setups that I personally use, I'd like to talk about a super effective and very simple chart setup that uses a very common indicator: Bollinger Bands . I'll reiterate that TA is never, ever, ever 100% accurate and wild cards come up that break the mold of even the most reliable setups, so keep that in mind...
Hello everyone, this video is about one thing that i have been struggeling with in the beginning for my charting career. Choosing a proper timeframe and scale on your charts can be the key for being profitable in your trades. This is my first actual video idea so feel free to let me know what i can improve (the audio was kinda off, sorry :)) cheers, Ares ...
Afternoon fun - doodle. Barts Head on BTC! where next?? Disclaimer This idea does not constitute as financial advice. It is for educational purposes only, our principle trader has over 20 years’ experience in stocks, ETF’s, and Forex. Hence each trade setup might have different hold times, entry or exit conditions, and will vary from the post/idea shared...
Hello Traders. Welcome to Chapter 3.5, where we talk further about two more different types of triangles - the Barrier and Expanded triangle. In the previous chapter we talked about the running flat and contracting triangle, but for these two, they are essentially the same but different overall shape! Most importantly, these are very common patterns within the...
I've been reading texts and messages at an increasing rate that Bitcoin is currently forming the Top/ Peak/ All Time High of the current Cycle (Bull Market). Even though this noise is not alarming as historically an increase in sell positions always goes wrong, I can't claim that I am not concerned for those who are going to miss out (again) on the rally that is...
Tron gained about 250% in just 6 trading days and, after an initial correction to 0.1, has recovered about 50% of the drop. In my opinion, a new leg down will follow from this point and we can see the price under 0.1 soon. On the other hand, if the price manages to rise above 0.13 again this scenario is invalidated
AUDIO is one of the big winners of the current bull-run, seeing more than 2500% profit in a mere two months. After hitting the $5 mark, however, AUDIO has seen some steep losses, losing almost 60% value in that process. Luckily for us, the price bounced off strongly from the bottom support line, potentially starting a new push upward. Seeing the current big...
Afternoon fun - doodle. Barts Head on BTC! where next?? Disclaimer This idea does not constitute as financial advice. It is for educational purposes only, our principle trader has over 20 years’ experience in stocks, ETF’s, and Forex. Hence each trade setup might have different hold times, entry or exit conditions, and will vary from the post/idea shared...
Hello traders: GBPUSD has broken out of the HTF ascending channel structure, and is finished forming its continuation correction. We can see price has already been in a bearish trend from the top of the HTF ascending channel. Price managed to make the first impulse, follow by correction, then another impulse out of the HTF channel, good indication of...
Targets and best entry point all shown on chart and we are looking for short position on EURUSD as we talked about but we are not going to fight with market that is getting bullish again and we explained reasons of this strength here : here are some...
USDJPY D4: PT BULLS 111.50. IHS BULLS (UPDATE) IMPORTANT NOTE: speculative setup. do your own due dill. use STOP LOSS. don't overleverage. Tagged as LONG because I expect more gains. 🔸 Summary and potential trade setup ::: USDJPY 2days/candle chart review ::: updated/revised outlook ::: setup still valid as of right now ::: great progress since initiated...
Overview - EUR/JPY has reversed from the double top at 130.60. So, let us take a look at a possible sell entry which might play out in the next few days. Analysis - As you can see from the chart, 130.60 level is a resistance for EUR/JPY which the bulls could not break previously. Price has reversed from the double top with bearish candlestick formation. ...
Long and short C Activation of the transaction only when the blue zone is fixed/broken. The author recommends the use of anchoring fixed the blue zone, this variation is less risky. If there is increased volatility in the market and the price is held for more than 2-3 minutes behind the activation zone after the breakdown, then the activation of the idea occurs...
These days in many stocks we have seen many patterns that have formed on top of each other. This is showing a strong bullish moment that continues to grow. Short Term Targets: $8.25 or 7% $8.79 or 13.90% Extended Targets: $9.60 $10.67 $11.52 Thank you and Good Luck!
Why get subbed to me on Tradingview? -TOP author on TradingView -15+ years experience in markets -Professional chart break downs -Supply/Demand Zones -TD9 counts / combo review -Key S/R levels -No junk on my charts -Frequent updates -Covering FX/crypto/US stocks -24/7 uptime so constant updates NFLX D1:PT BEARS 320/340USD SHORT IT(SL/TP)(STOCKS) IMPORTANT...
I want to make this short and sweet. Smart money is simply not buying here. Let's take a look at the RSI level on the 4 hour chart. I have circled every area that the RSI has been at these levels in the past. See the correlation of price action shortly after. Sure I am a long term bull and the March dip is over.... but we ripped a little too far too fast. As...
If we get a push here then next target would be IH&S pattern bottom up to neck line around 4240.
earlier we have analyzed the market cap and hedged our portfolios with its Alpha Ratio Calculate based on this analysis: as we can see it has followed the prediction up move, up to 2 Trillion Dollars. fundamentals: The total market value of...
projecting tops is difficult but the weekly is too over bought, laying fib ratios from the bottom shown and taking it up (my lazy projection method) to the point where other bounces from the past obey the lines puts us right at the 4200 psych level...makes sense, thougths?
We can see that strong support for the Dollar has been broken. A retest of the resistance and more downside continuation!
According to Bank Of America, more public money has been invested into the stock market, in the last five months, 569 Billion $, than had been invested previously (452 Billion) in the last 11 years ! since the start of the bull market in 2009. That is an extraordinary vote of confidence of public dollars into the stock market, as investors seek "yield "...
Gold reached yesterday the 1760 Resistance which is a very critical level as it may currently be the Resistance (since March 01) but is a Pivot as it was formerly a Support (two contacts: November 30, 2020 and February 18, 2021). It is no surprise that the price got rejected there as besides the 1760 Resistance, it also touched the 1D MA50 (light blue...
After a good rise, price approached to the resistance level at 1760 and dropped. There are two trend lines here: 1. The descending trend line which has been broken to the upside and price started to grow after that breakout. 2. The ascending trend line to which price is approaching right now. On the other hand, since price has made a reversal head & shoulders...
Why get subbed to me on Tradingview? -TOP author on TradingView -15+ years experience in markets -Professional chart break downs -Supply/Demand Zones -TD9 counts / combo review -Key S/R levels -No junk on my charts -Frequent updates -Covering FX/crypto/US stocks -24/7 uptime so constant updates VIX W1: Setting up for 450% BURST TP 80/85 (UPDATE) IMPORTANT...
We teamed up with a behavioral psychologist to look into the science behind the best song choices for trading and investing. We identified a formulae based on the five essential components of music — Tempo (BPM), Tone (T), Length and Volume (LV), Lyrics (L) and Mood (M). We then used these formulae to create two specialized playlists: Playlist #1: Zero In -...
What is a Whale, and Why is Archegos Capital One? Archegos Capital is what's called a "whale," meaning it's a big enough hedge fund that it can drive prices higher all by itself. Since a lot of traders buy "momentum" stocks, whales can make money by manipulating prices higher and then selling to "dumb money" that buys momentum stocks without regard to...
Pitchfork , is a technical indicator for a quick and easy way for traders to identify possible levels of support and resistance of an asset's price. It is presents and based on the idea that the market is geometric and cyclical in nature * Developed by Alan Andrews, so sometimes called Andrews’ Pitchfork * It is created by placing three points at the end of...
In this article, we will present some basic information about the bedrock of technical analysis – the trend. Technical research is founded on one main assumption: market prices move in trends as they are freely traded. Traders and investors hope to buy a security at a low price at the outset of an upward trend, ride the trend, and then sell the security at a...
This script is a grid bot simulator for ranging/choppy markets. Prices are divided into grids, or trade zones, that will trigger signals each time a new zone is entered. During ranging markets, each transaction is followed by a “take profit.” As the market starts to trend, transactions are stacked (compare to DCA), until the market consolidates. No signals are...
Fibonacci Speed and Resistance Fan is an analytical drawing tool used to indicate the support and resistance levels of an existing trend and the price level at which possible changes in the trend may occur. A Fibonacci Speed Resistance Fan consists of a trend line drawn between two extreme points - a trough and opposing peak or a peak and opposing trough - on...
This script isn't about creating a correlation script with labels, there is a perfect working example of @Mango2Juice (Correlation Matrix, which was inspired by @Daveatt's Correlation Matrix) The intention was making it with the use of as less code as possible, looping through array's The Pine correlation function doesn't work consistently in a local scope...
Hello Traders, here is the full analysis for this pair, let me know in the comment section below if you have any questions, the entry will be taken only if all rules of the strategies will be satisfied. I suggest you keep this pair on your watchlist and see if the rules of your strategy are satisfied.
BNB, broke the trend line exactly as I told you many days ago. Time to Fix part of the profit.
Hi Everyone! Yes, it has been a while. No, I'm not back yet... Sorry... I still have a lot of work to do. Simply thought I would post an update to avoid getting rusty. "If you don't use it, you lose it." The purpose of this title is to emphasize we need to wait to see if the Green Line in the Daily (24h), 2-Day, 3-Day and 4-Day time frames can turn back up...
ADA as confirm strong support at 1.20$, now going sideways before the break to the upside. A lot of work on the ecosystem.... the fundamentals are looking promising & exciting. Don't expect this price action to continue for too long, volatility is imminent.