Gold Price - XAU/USD Q4 2026: Can the Support Drive a Recovery?In Q3 2026, gold ETFs and central banks together bought nearly 296 tonnes of gold, one of the strongest quarters of buying in 23 years of data.
Yet the average gold price for the quarter fell 5.4% , the steepest drop of any quarter with total demand above 150 tonnes since 2003.
This article w
Where the world does markets
Join 100 million traders and investors taking the future into their own hands.
Get started for free$0 forever, no credit card needed

Supercharged
Supercharts

Heading toward strong resistance?AUD/USD is rising toward the resistance level, which is an overlap resistance that aligns with the 127.2% Fibonacci extension and the 61.8% Fibonacci projection and could reverse from this level to our take profit.
Entry: 0.7004
Why we like it:
There is an overlap resistance level that aligns with
Breakout & Confirmed Re-TestFFIV is displaying one of the cleanest and strongest bullish trends in the current market environment. The structural price action here is exceptionally well-defined.
The Technical Picture:
The stock recently cleared a major multi-month resistance wall around $460. Following that breakout, the price
NZD/CHD Daily AnalysisNZD/CHF has pulled back sharply from the 0.4800 region and is now testing a well-established ascending trendline around 0.4630–0.4640. Previous reactions show buyers have repeatedly defended this structure, making it a critical decision area. A bullish rejection could target 0.4700–0.4740, while a d
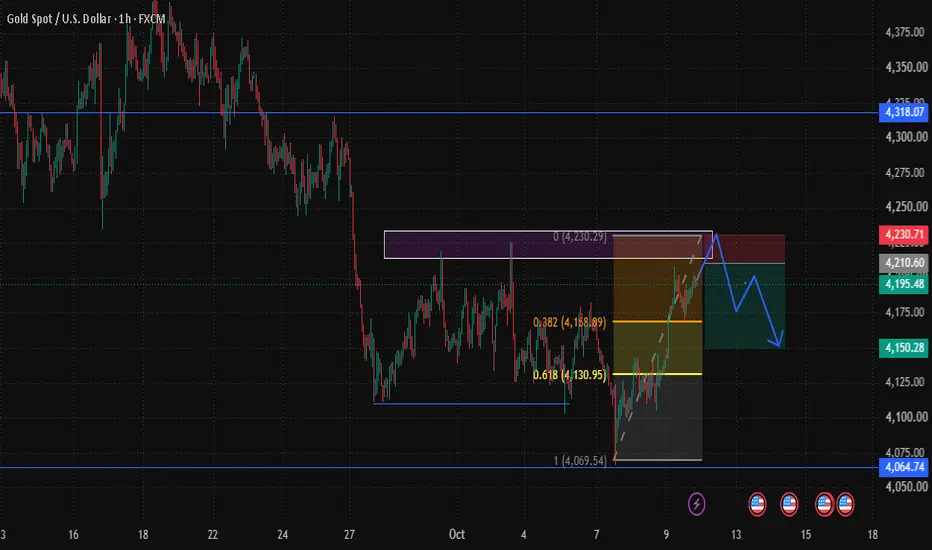
XAUUSD Gold Hits the Supply Zone at 4,205-4,229Gold has bounced from 4,066 to 4,195 and is now testing a supply zone that lines up with the 61.8% Fibonacci retracement of the drop. The 1H chart shows lower highs and lower lows, and the bounce is stalling under resistance. This idea covers the backdrop, the structure, and a defined trade plan wit
Can Consumer Confidence Predict S&P 500 Corrections?This chart compares the SPY (top panel) with the University of Michigan Consumer Sentiment Index, USCCI (bottom panel), from 1997 to 2026.
The chart uses a weekly timeframe to better identify market turning points. The vertical lines mark the beginning of S&P 500 corrections, while the green lines
DAX: Aiming its 1M MA50 at 21,000.DAX remains bearish on its 1D technical outlook (RSI = 36.976, MACD = -170.928, ADX = 18.868) despite today's strong gains as it remains on a 2 month decline since the August ATH. The 17 year pattern may be a Channel Up bu having traded within its Top range (Fibonacci 0.786-1.0) for the majority of
PYTH 2x Setup Loading! Breaks the Three-Year DowntrendBINANCE:PYTHUSDT Weekly Time Frame
PYTH (1W) spent more than two years in a descending channel after the 2024 high near 1.16, and it bottomed near 0.0295 in 2026. Price has since rallied sharply, breaking above the upper channel trendline and reclaiming the lower red anchored VWAP, which acted as
Is a Neutral Bias Becoming More Evident in WTI?Price action around WTI crude oil has begun to reflect an increasingly evident neutral bias in the short term. This can be seen in the performance of the last three trading sessions, where the commodity has gained only around 1.4%, without developing the type of directional move that would suggest a
6J Yen Futures Eye Key Support as BOJ and Fed Paths DivergeYen Caught Between a Hawkish Fed, a Cautious BOJ and Tokyo’s Warnings
Yen futures are consolidating after a volatile stretch driven by policy, fiscal and energy headlines. On Sep 2, Bank of Japan board member Hajime Takata said the central bank should raise rates nimbly rather than follow a fixed
See all editors' picks ideas
RedK Indicator Amplifier (RedK i-Amp)🟩 What is RedK i-Amp?
-------------------------------
RedK i-Amp is not an indicator in itself - it's a "wrapper" utility that "amplifies" another "source" indicator by improving its visual and alerting capabilities.
RedK i-Amp hooks to another indicator's plot and enables the addition of the fol
TASC 2026.10 A Low-Risk ETF-Trading Strategy█ OVERVIEW
This script implements concepts from a short-term ETF investment strategy outlined by Markos Katsanos in the article "Selecting Strong ETFs While Avoiding Sharp Overbought Reversals" from the October 2026 edition of TASC Traders' Tips . The strategy analyzes Katsanos' custom relative s
Buyers & Sellers Profile + Dynamic S/R (Zeiierman)█ Overview
Buyers & Sellers Profile + Dynamic S/R (Zeiierman) is a volume-profile and market-structure indicator designed to combine a large rolling Buyers/Sellers Volume Profile with dynamically generated support and resistance levels.
Instead of treating the volume profile and swing structure
Vol-Control Fund PositioningThe investors who sell because nothing happened
In 2017 the American stock market was so calm that a whole class of institutional portfolios held more equities than their own capital, simply because the rules they follow told them to. Reconstructed with the model behind this indicator, their estim
RedK Multi-Modal TrailingStop (RedK MMTStop)█ RedK MMTStop - Release Notes
Introduction & background
RedK MMTStop is a Multi-Modal Trailing Stop indicator - Let's quickly explore the "trailing stop" concept first as a refresher - then explain what a multi-modal trailing stop indicator does.
A "Trailing Stop" is what helps traders avoi
Trend Target Ribbon [BOSWaves]Trend Target Ribbon - ALMA Conviction Trend Detection with Integrated Structure-Based Position Planning and R-Multiple Target Tracking
Overview
Trend Target Ribbon is an ALMA-based trend identification system that combines slope-normalized momentum confirmation with standard deviation band
Wyckoff [theUltimator5]This indicator was designed to be a comprehensive, intuitive, overly engineered algorithm that plots Wyckoff accumulation and distribution patterns on the chart as they arise. It shows the current status of the regime on a side panel, while also overlaying the accumulation or distribution schematic
XeL OnlineRecursionXeL OnlineRecursion is a Pine Script library for online and streaming statistical estimation on continuous numerical and financial data.
The library is designed around recursive statistical populations whose retained state is updated observation by observation. Most recursive components use consta
Dual-Phase Reversal by DGTDual-Phase Reversal • Exhaustion, Pivots & Pressure
Dual-Phase Reversal (DPR) is a two-phase market exhaustion framework that tracks directional momentum through Momentum Exhaustion and Terminal Exhaustion . It combines sequential price conditions, Momentum Shift initiation, phase qualificatio
Zeiierman Trend Pressure (Zeiierman)█ Overview
Zeiierman Trend Pressure (Zeiierman) is a multi-layer trend pressure and exhaustion oscillator designed to visualize short-term momentum, persistent trend structure, directional pressure, and exhaustion states within a normalized 0 to -100 range.
Instead of relying on a single osci
See all indicators and strategies
Community trends
NVIDIA (NVDA) Stock Price Prediction | Bullish Reversal, Key SupTitle:
NVIDIA (NVDA) Stock Price Prediction | Bullish Reversal, Key Support & $240 Target
Description:
Writing
📊 **NVIDIA (NVDA) Stock Analysis – 1-Hour Chart**
In this technical analysis, we look at NVIDIA stock’s recent price action, market structure, and key support and resistance levels to
SPCX (SpaceX) : Ascending Channel Continuation SetupExecutive Summary
Space Exploration Technologies Corp (SPCX) is currently consolidating near the $162.57 level following a steady intermediate recovery. Price action has pulled back into a high-confluence demand zone aligning with a rising structural trendline and short-term Fibonacci retracement l
UBER: Massive Head-Shoulder-Formation, Important Level to Watch!Hello Community,
welcome to my new analysis of UBER on the weekly timeframe perspective. In the recent times, I have spotted important setups within the stock market that could lead to pivotal trading opportunities on the short side. One of them is UBER. The stock is forming a crucial formation th
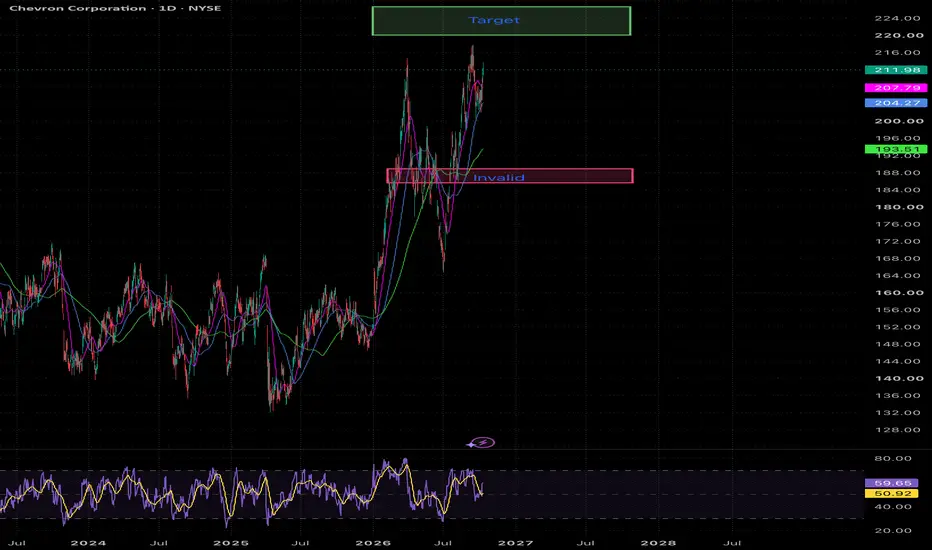
CVX Daily Chart: Momentum Building Toward $220 TargetHere is the technical analysis of the Chevron Corporation (NYSE: CVX) daily chart in English, structured in accordance with TradingView community guidelines and compliance rules:
Technical Chart Analysis: Chevron Corporation (NYSE: CVX)
1. Market Structure & Trend Overview
Primary Trend: Bullish Co
CIFR: Testing the Nov 25 low, historical demand zone belowCipher Digital (formerly Cipher Mining) has fallen since its June high. The sell-off was mainly driven by macro factors. Inflation concerns and expectations of further rate hikes pushed bond yields to multi-decade highs, which weighs heavily on debt-financed, rate-sensitive names like CIFR. The Open
Breakout & Confirmed Re-TestFFIV is displaying one of the cleanest and strongest bullish trends in the current market environment. The structural price action here is exceptionally well-defined.
The Technical Picture:
The stock recently cleared a major multi-month resistance wall around $460. Following that breakout, the price
Park-Ohio (NASDAQ:PKOH)Park-Ohio Holdings Corp. (NASDAQ:PKOH) is a diversified industrial company headquartered in Cleveland, Ohio. The company operates through three primary business segments: supply chain management services, capital equipment, and manufactured components. Its supply chain management segment provides ou
MU: Horizontal ConsolidationMicron Technology Inc. (MU) closed its most recent trading session at $1,029.00, experiencing a minor dip of -0.66%. Despite short term fluctuations, the company continues to see immense tailwinds from AI driven demand for High Bandwidth Memory (HBM) and (DRAM) chips, pushing its market capitalizati
See all stocks ideas
Today
VFSVinFast Auto Ltd.
Actual
—
Estimate
−0.27
USD
Today
CHRNChronoScale Holdings Corporation
Actual
—
Estimate
−0.09
USD
Today
NRIXNurix Therapeutics, Inc.
Actual
—
Estimate
−0.60
USD
Today
AEHRAehr Test Systems
Actual
—
Estimate
—
Today
CMTLComtech Telecommunications Corp.
Actual
—
Estimate
−0.51
USD
Today
PGRProgressive Corporation (The)
Actual
—
Estimate
4.31
USD
Tomorrow
DPZDomino's Pizza Inc
Actual
—
Estimate
4.36
USD
Tomorrow
JNJJohnson & Johnson
Actual
—
Estimate
2.50
USD
See more events
Community trends
BITCOIN: The Fourth Historical Bullish Triangle is Forming!Hello Community,
welcome to my new analysis of BITCOIN and its underlying historical bullish triangle developments. BITCOIN, in the current state of the market, is trading in a decisive development as the sentiment switches from bearish to bullish, since BITCOIN has bounced heavily in the range. T
BTCUSDTHello Traders! 👋
What are your thoughts on Bitcoin ?
Bitcoin is currently trading around $83,000 after facing selling pressure in the $86,000–$87,500 resistance zone, where price previously failed to break higher and was rejected.
From a technical perspective, BTC has broken below its ascending t
Bitcoin Price Update – Clean & Clear ExplanationBitcoin is showing signs of a potential bullish recovery after a sharp sell-off toward the 81k region, where buyers stepped in aggressively and pushed price back toward the 83k area This structure suggests that bullish momentum is gradually building as the market approaches a key breakout area.
Rec
BTCUSD — Bearish Structure & Key Support at 75,130BTCUSD is showing a potential bearish setup on the daily timeframe, with price consolidating near the 82,900–83,000 resistance area. The marked Weak High and Buy-Side Liquidity (BSL) represent an important upside liquidity zone, where price could make a liquidity sweep before the next directional mo
BTC/USD Technical Analysis – Bullish Recovery Setup
Timeframe: 45-Minute Chart
Current Price: $83,052
Market Bias: Short-Term Bullish, Overall Trend Still Cautious
### 1\. Market Structure
Bitcoin experienced a strong decline from the $87,000 resistance area toward $80,500 support. After reaching this low, price recovered and began consolidating a
BTCUSDT 4H: Key Demand Zone Could Trigger the Next Leg HigherHi!
Market Outlook: Bullish Scenario
BTC is consolidating below the 100 SMA after printing a potential double top near the $87K region. Price is now approaching a key demand zone between $79K and $80K, which aligns with the lower boundary of the ascending channel.
I’m watching for a potential l
BTCUSDT – Bearish Breakdown & Downside Continuation Setup📊 BTCUSDT – Bearish Breakdown & Downside Continuation Setup
🔍 Market Overview
Bitcoin is showing bearish momentum on the 4H timeframe after breaking below its rising trendline and losing the previous bullish market structure. Price faced rejection near the 86,800–87,500 resistance zone, followed
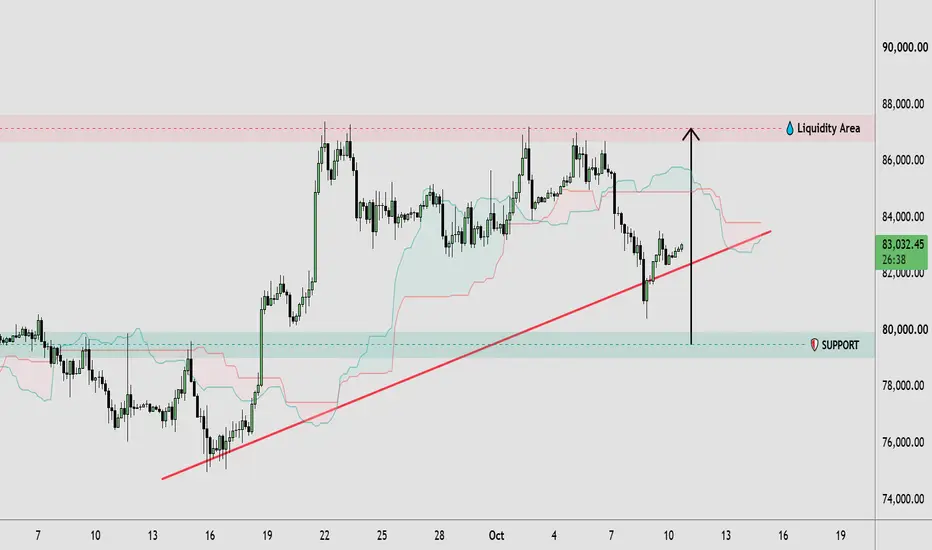
BTCUSDT — Rising Trendline Holds as Price Targets 87K Liquidity🔹 BTCUSDT is showing a recovery after a sharp bearish move from the 86,000–87,000 resistance area. Price has rebounded from the recent low near 81,000 and is currently trading around 82,980, with the rising trendline acting as an important dynamic support. The broader price action suggests that buye
BTCUSD 1D | SMC Market Structure Liquidity & Trendline AnalysisBTCUSD 1D | SMC Market Structure, Liquidity & Trendline Analysis
Detailed Educational Description — Candle-by-Candle Analysis
This BTCUSD 1D chart focuses on Smart Money Concepts (SMC), market structure, liquidity zones, support and resistance, Fair Value Gaps (FVG), Order Blocks, and trendline b
BTC Breakdown Alert: Can Bulls Reclaim $85K?CRYPTOCAP:BTC Update: Breakdown Below the Rising Trendline
#Bitcoin has broken below the rising trendline and slipped out of its recent consolidation range around $84,000–$87,000. The price is currently trading near $83,000, attempting to recover after the breakdown.
In my view, the short-term st
See all crypto ideas
XAUUSD — KEY DECISION ZONE | BEARISH MARKET STRUCTUREXAUUSD — KEY DECISION ZONE | BEARISH MARKET STRUCTURE
Gold is approaching a critical support area, with the current price shown near 4,194. The overall chart structure remains bearish, with lower highs, bearish breaks of structure, and a descending trendline indicating continued selling pressure. H
XAUUSD 1D | Institutional Liquidity & Bullish Repricing FrameworXAUUSD 1D | Institutional Liquidity & Bullish Repricing Framework
Gold on the Daily timeframe is currently developing around the 4,194 area, with price reacting from the broader discount region and attempting to rebuild bullish momentum. The chart is structured around liquidity, FVGs, market struct
XAUUSDHello Traders! 👋
What are your thoughts on Gold?
Gold is currently trading within a consolidation range, fluctuating between the key support zone at 4,080–4,120 and the resistance zone at 4,200–4,225.
As long as price remains within this range, choppy, back-and-forth movements are likely to conti
XAUUSD — Weekly Outlook: Bullish Repricing Toward External BSLMarket Context
Gold enters next week with improving short-term momentum after recovering from the early-week selloff. Spot Gold reached around 4,194 on Friday and was on track for a weekly gain, supported by a softer U.S. dollar and easing Treasury yields. However, the macro backdrop remains mixed:
XAUUSD: Descending Trendline Breakout or Another Rejection?🔹 XAUUSD is showing a short-term recovery after finding support around the 4,080–4,100 zone. Price has rebounded toward 4,195, suggesting improving bullish momentum following the recent consolidation. However, the broader price action still reflects a descending structure, with the red trendline mar
THE KOG REPORTTHE KOG REPORT
In last week’s KOG Report we gave the defence boxes and the hot spots together with the bias levels. The first part of the move worked extremely well coming down into the region we actually wanted to break. As you can see, it didn’t and the algo level was defended giving us the op
XAUUSD Daily Market Structure, Liquidity & Potential Reversal.
Gold is approaching a technically significant decision zone, with price currently trading near 4,194 following a sustained corrective move from previous highs. The daily chart highlights a developing interaction between key demand, internal market structure, and liquidity levels, creating an import
Gold’s Rising Trend Line Offers Bulls a Route Back To ResistanceHello traders! Here’s my technical outlook based on the current XAUUSD (3H) chart structure. XAUUSD previously traded inside a range before breaking higher and later forming a descending structure after turning around from the highs. Price then tested the Buyer Zone and bounced, showing signs of buy
Buy-Side Liquidity Target | ICT Market Structure Analysis This Gold (XAUUSD) analysis highlights the 5,018 level as a potential Higher Time Frame (HTF) Buy-Side Liquidity (BSL) target within the ICT market structure framework. Price may be drawn toward this area to test liquidity resting above previous swing highs, where pending buy orders and stop-loss or
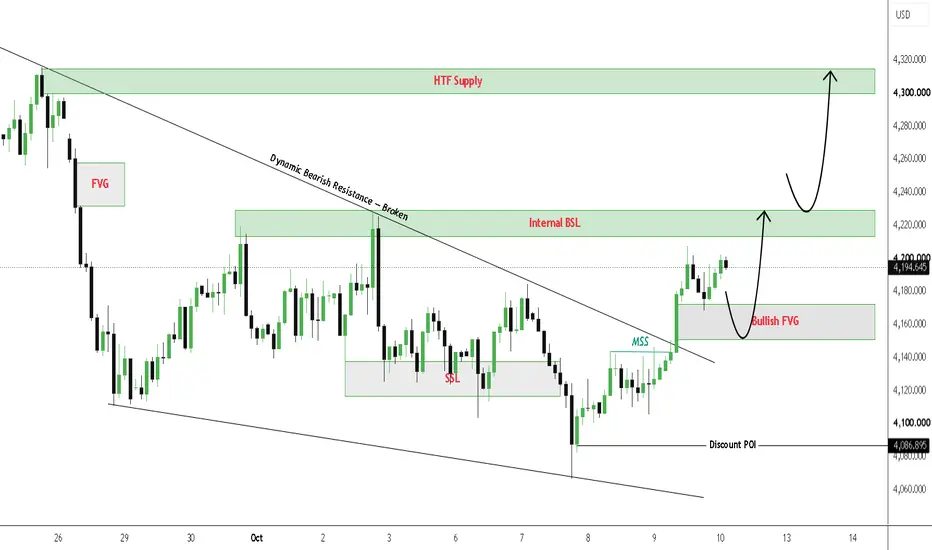
GOLD H1 Institutional Liquidity Levels Bulls/Bears▪️ My read: Gold held the 4,110–4,120 breaker, put in a double bottom against the late-September low and rallied about 90 pts off 4,105 straight back into 4,204. That level has capped the range since Sep 30, with three wicks through it and no close above. Short-term structure now favors bulls, but p
See all futures ideas
EURUSD Bullish Reversal Setup – Targets at 1.1280 and 1.1380 EURUSD is consolidating near the 1.1200 support area after a previous bearish move. Price is showing signs of a potential bullish recovery, with the chart suggesting an upward move toward the resistance zone at 1.1280. If bullish momentum continues and price breaks above this level, the next target
EURUSD 4H: MSS + Order Block Setup ExplainedEURUSD 4H: Understanding the MSS + Order Block Entry Model
1. Market Overview — The Bigger Picture
EURUSD remains in a broader bearish structure on the 4-hour chart, characterized by a sequence of lower highs and lower lows. The recent price action shows consolidation near the lows following an ex
EURUSD Bullish Reversal: Trendline Retest Toward ResistanceEURUSD is showing a potential bullish setup on the 30-minute chart, with price testing an ascending trendline near the support zone around **1.1170–1.1180**. The market may pull back to retest this trendline before attempting another upward move.
If buyers defend the support area and bullish moment
EURUSD EURUSD is currently trading around 1.11973, facing selling pressure after rejection from the supply zone near 1.1230–1.1240. The 1H chart shows bearish momentum, with sellers attempting to push price toward lower support and liquidity zones.
KEY RESISTANCE ZONES
The immediate resistance lies aroun
GBP/USD – Bearish Rejection Setup | Support Target Ahead**
GBP/USD is showing bearish pressure after facing rejection from the resistance zone around **1.3245–1.3250**. Price is currently trading near **1.3236**, and sellers may push the market lower toward the key support area. If resistance continues to hold, a downside move toward the marked target zone
EURJPY: Double-Bottom Support at 176.22: Recovery Toward 178.95?EURJPY: Double-Bottom Support at 176.22: Recovery Toward 178.95?
EURJPY is showing signs of a potential bullish reversal after repeatedly testing the 176.20–176.50 support zone. Buyers have defended this area twice, creating a possible double-bottom structure after the pair's extended decline.
Pr
EURUSD: Support Holds, Buyers Eye Trendline Breakout🔹 EURUSD Technical Analysis: EURUSD continues to show a bearish market structure, with lower highs and lower lows developing beneath a descending trendline. Recent price action suggests that sellers remain active, although the pair has started to recover from the highlighted support zone around 1.11
EURUSD – H4 – Descending Trendline Breakout & Bullish Reversal SEURUSD – H4 – Descending Trendline Breakout & Bullish Reversal Setup
EURUSD is currently trading around 1.12250 and showing signs of recovery after a sustained bearish move. Price is testing the descending trendline, while the 1.11402–1.11650 support zone remains a key area to watch.
📌 Support Zon
EURUSD: Support & Resistance Analysis for Next Week 🇪🇺🇺🇸
Here is my latest structure analysis and important supports & resistances
for EURUSD for next week.
Consider these structures for pullback/breakout trading.
❤️Please, support my work with like, thank you!❤️
I am part of Trade Nation's Influencer program and receive a monthly fee for using thei
GBPJPY Will Go Lower! Short!
Please, check our technical outlook for GBPJPY.
Time Frame: 9h
Current Trend: Bearish
Sentiment: Overbought (based on 7-period RSI)
Forecast: Bearish
The market is testing a major horizontal structure 209.494.
Taking into consideration the structure & trend analysis, I believe that the market w
See all forex ideas
Trade directly on Supercharts through our supported, fully-verified, and user-reviewed brokers.