Bitcoin loses 75k: lower highs, two buy zones, CPI weekBitcoin lost the 75k floor overnight. Price hit 73.5k on Binance while around $800M in leveraged positions were liquidated in four hours, mostly longs.
What the chart shows:
1. Trend first: five weekly closes lower in a row. Price sits under the EMA50 (79.3k) and the EMA200 (76.5k).
2. Lower highs:
Where the world does markets
Join 100 million traders and investors taking the future into their own hands.
Get started for free$0 forever, no credit card needed

Supercharged
Supercharts

BTC: Is $66K the Last Stand Before $50K?Bitcoin continues to show significant bearish weakness, forming lower highs and lower lows within a descending channel.
Price has broken below the critical $74,965 support level and is now testing the $66K region. If this level fails to hold, BTC could potentially decline toward the $58K support zo
Don't Chase Shorts Into Macro SupportDon't Chase Shorts Into Macro Support: BTC Nears 64–65K Pattern Target, Is a Liquidity Rebound to 74K Next?
Traders rushing to chase short positions as Bitcoin slides aggressively from its 87,000 USD peak down to 68,299 USD need to exercise extreme caution near the approaching demand floor! Examini
What If Jensen Huang Returns? Would It Change My Bearish OutlookNASDAQ:NVDA NASDAQ:TSLA After looking further into the situation surrounding Nvidia, one thing that caught my attention was the growing support for bringing Jensen Huang back as CEO. Some Nvidia employees have reportedly expressed their support for his return, and even Elon Musk has publicly back
TSLA fade from the 400 wall: flush to 384 or bear trap at 390?Tesla knocked on 400 twice and got slapped both times. Was that the top for the week?
📊 The read: bearish lean on the hourly. The forecast path drifts from about 391 down to roughly 384 by Monday pre-market (Nov 16), about -3.8%. Its whole projected range runs from -4% to barely +0.2%, so the path
Macro Bearish Divergence & "The Big Reset" RoadmapAfter peaking near 7,820-7,850 in October, SPX (7,535) is testing the underside of its steep post-2023 ascending trend line on the monthly timeframe. While price carved out higher highs over the past two years, the underlying momentum histogram has printed a textbook macro bearish divergence, formin
NVDA - Climactic Selling and Strong BounceThis is the type of trade setup where if it appeared everyday we could all retire already.
Rarely do so many clearing events come together so clearly. Below I outline each:
Mean reversion: Price came down and breached the 365 day SMA and closed with a strong bounce back above signaling rejection b
Will Oil Extend Its Decline?Fundamental Outlook
US crude has fallen roughly 17.5% from its late-October peak near $105 to a ten-week low of $86 on 10 November, as geopolitical tensions eased and the risk premium priced into the market faded. Supply-side pressure added to the decline after OPEC+ output jumped in October, led
DXY - US Dollar Hits Multi-Month Highs as Fed Hike Bets RiseMacro approach:
- The US dollar strengthened to multi-month highs as sticky inflation data and hawkish Fed commentary reinforced expectations of further policy tightening.
- US Oct CPI rose 0.4% MoM, exceeding forecasts, while core inflation held at 0.3% MoM, keeping price pressures elevated. Fed of
USD/MXN: lower highs into supply, short back towards 18.41USD/MXN surged from below 18.00 in early October to a spike high near 18.97 after the Bank of Mexico (Banxico) surprised markets with a rate cut on 5 November. Since then, the rally has been losing steam. Each bounce has stalled at a lower level, from 18.97 to 18.81 and then around 18.70, a classic
See all editors' picks ideas
RedK DualTF Volume-Accelerated CCI (RedK VA-CCI)🟩 RedK VA-CCI Release Notes
===========================
RedK VA-CCI is a modern take on the Commodity Channel Index (CCI) classic indicator.
RedK VA-CCI leverages the core CCI concept, and builds around it to provide traders with comprehensive insights, dual timeframe capabilities, and many other
Volume Profile Anatomies (D / B / P / Double Zone)You know how volume profiles all kind of look like blobs, and people talk about "D-shaped" and "P-shaped" profiles like everyone's supposed to just see it? This indicator does the squinting for you — it builds a real volume profile from the chart's bars, finds the POC and value area, then politely t
Higher Timeframe Trend Frontier (Zeiierman)█ Overview
Higher Timeframe Trend Frontier (Zeiierman) is an adaptive higher-timeframe indicator designed to visualize HTF opening levels, developing price structure, directional movement, and potential trapped buyers and sellers.
Unlike traditional HTF indicators that simply plot historical
PineTunnel█ OVERVIEW
PineTunnel is a Pine Script library that re-implements TradingView's
strategy.* broker emulator for indicator() scripts. It mirrors the full
strategy.* namespace one-to-one — 114 exports: 88 functions, 18
constants and 8 types — covering entries, brackets, trailing stops,
OCA groups,
Confluence Profile█ OVERVIEW
Confluence Profile is a tool for finding places where several independent technical factors point to a similar price level. It does not give buy or sell signals. Instead, it shows where Fibonacci levels, Order Blocks, Fair Value Gaps and volume nodes cluster on the chart, and how many of
Rolling Candle Profile with Buy/Sell Signals (Zeiierman)█ Overview
Rolling Candle Profile with Buy/Sell Signals (Zeiierman) is a dynamic price-pressure indicator that visualizes buying and selling dominance, directional pressure concentrations, and weak-pressure regions directly on the chart.
The indicator constructs a 12-layer Rolling Pressure Prof
Innovation Adaptive Kalman Filter Oscillator█ OVERVIEW
The Innovation Adaptive Kalman Filter (IAKF) is a modern implementation of the Kalman filter that uses its own prediction errors to detect abnormal measurements and adapt its measurement-noise estimate.
This indicator is an oscillator that adapts recent research in GPS and inertial nav
Market Matrix (Zeiierman)█ Overview
Market Matrix (Zeiierman) is a multi-timeframe market analysis dashboard that brings together price structure, trend, momentum, and market strength into six compact indicator panels.
Instead of switching between multiple indicators and timeframes, Market Matrix displays higher-timefr
RedK Indicator Amplifier (RedK i-Amp)🟩 What is RedK i-Amp?
-------------------------------
RedK i-Amp is not an indicator in itself - it's a "wrapper" utility that "amplifies" another "source" indicator by improving its visual and alerting capabilities.
RedK i-Amp hooks to another indicator's plot and enables the addition of the fol
TASC 2026.10 A Low-Risk ETF-Trading Strategy█ OVERVIEW
This script implements concepts from a short-term ETF investment strategy outlined by Markos Katsanos in the article "Selecting Strong ETFs While Avoiding Sharp Overbought Reversals" from the October 2026 edition of TASC Traders' Tips . The strategy analyzes Katsanos' custom relative s
See all indicators and strategies
Community trends
What If Jensen Huang Returns? Would It Change My Bearish OutlookNASDAQ:NVDA NASDAQ:TSLA After looking further into the situation surrounding Nvidia, one thing that caught my attention was the growing support for bringing Jensen Huang back as CEO. Some Nvidia employees have reportedly expressed their support for his return, and even Elon Musk has publicly back
NVIDIA Jensen is out but a MASSIVE BUY SIGNAL is approaching.NVIDIA Corporation (NVDA) is experiencing its worst period in terms of leadership as CEO and co-founder Jensen Huang resigned in the aftermath of his affairs. Naturally this has caused the stock and A.I. industry flagship to correct aggressively the past 2 weeks, even dropping significantly below it
TSLA fade from the 400 wall: flush to 384 or bear trap at 390?Tesla knocked on 400 twice and got slapped both times. Was that the top for the week?
📊 The read: bearish lean on the hourly. The forecast path drifts from about 391 down to roughly 384 by Monday pre-market (Nov 16), about -3.8%. Its whole projected range runs from -4% to barely +0.2%, so the path
NVDA — Primary Wave II Macro Corrective Roadmap...Following the completion of Primary Wave I ((5)) at $243.37 inside the Maximum Valuation Band, NASDAQ:NVDA has entered a macro Primary Wave II corrective cycle triggered by the management/succession uncertainty and pre-earnings volatility.
Elliott Wave & Structural RoadMap
Wave ((A)) Capitu
NVDA Into Earnings: $170 Reclaim or $158.39 Breakdown?NVDA heads into earnings with a useful question: was Thursday's rebound a durable low, or a pause in the selloff?
On November 12, the stock fell to $148.80 before recovering to close at $166.19. On November 13, it reached $170.00 but closed at $162.85, above the session low of $158.39. The chart sh
NVDA - Climactic Selling and Strong BounceThis is the type of trade setup where if it appeared everyday we could all retire already.
Rarely do so many clearing events come together so clearly. Below I outline each:
Mean reversion: Price came down and breached the 365 day SMA and closed with a strong bounce back above signaling rejection b
Double Major BEARISH Channel Intact $0.68 to $1.19 PRICE TARGETNIO is seeing high selling pressure accelerating equipped with double bearish channels at play. We see a gap from about $1.50 with price objective at the $1.19 area. 2nd price target is at around $0.68. Double short opportunity at play. Fundamentals are also deteriorating which would add more se
NVDA | Order Block First, Flip Zones Decide NextThis chart has two trades in it, in sequence, and they point in opposite directions. The order matters more than the direction.
━━━━━━━━━━━━━━━━━━━━
THE STRUCTURE
━━━━━━━━━━━━━━━━━━━━
The larger trend was bullish and it was not subtle: repeated BOS to the upside, each one launched from the
Eastern Co ($EML): sales up, margin up, backlog up 70%The Eastern Company, of Shelton, Connecticut, is an industrial holding company. Its businesses make truck mirror assemblies, returnable transport packaging and latch and handle assemblies, and since June, through Sungear and Crown Precision, aerospace and defense components.
On 10 November the comp
See all stocks ideas
Community trends
BITCOIN hit its 1W MA200 again! They said it would never happen!A month ago (see charts below), we signaled a medium-term correction Bitcoin (BTCUSD) after it broke below its 1D MA50, giving a 1W MA200 Target around $68000:
At the time our view was met with huge skepticism, denial and mockery, but 7 weeks later BTC reached our Target. The reason that en
BTCUSDTHello Traders! 👋
What are your thoughts on Bitcoin ?
Bitcoin continues to trade within a well-defined descending channel, with the broader market structure remaining bearish. Recently, price reached the upper boundary of the channel but faced significant selling pressure and was rejected, reinforc
BTCUSD Weekly Analysis Key Support Resistance & Next Market Move BTCUSD WEEKLY ANALYSIS – WHY BITCOIN DROPPED FROM $75K TO $67K & WHY A RECOVERY COULD COME NEXT
BITCOIN (BTCUSD) – WEEKLY TIMEFRAME
CURRENT MARKET STRUCTURE: BEARISH CORRECTION
Bitcoin has experienced significant selling pressure, falling from the $75,000 region towards $67,000. The important
Don't Chase Shorts Into Macro SupportDon't Chase Shorts Into Macro Support: BTC Nears 64–65K Pattern Target, Is a Liquidity Rebound to 74K Next?
Traders rushing to chase short positions as Bitcoin slides aggressively from its 87,000 USD peak down to 68,299 USD need to exercise extreme caution near the approaching demand floor! Examini
Bitcoin - Approaching the final support again!👑Bitcoin ( CRYPTO:BTCUSD ) still remains above the support:
🔎Analysis summary:
For the past couple of weeks, Bitcoin has just been creating quite a lot of volatility. But looking at the higher timeframe, Bitcoin is also once again approaching its major support area. If Bitcoin creates some bu
ETHUSD 1H: Support Zone Retest & Bullish Recovery SetupETHUSD 1H: Support Zone Retest & Bullish Recovery Setup
ETHUSD (CRYPTO:ETHUSD) is retesting its primary Support zone (1,880.00 - 1,900.00) on the 1H timeframe, positioned directly above the descending channel lower trendline. Price is currently holding near 1,906.29 (trading around 1,904.34), buildi
13-Nov. Venus & Mercury Station Direct · BTC-Bullish ResumptionGood morning and Friday 13th my fellow Cryptocurrency, stock and Gold market trader, how are you feeling in this wonderful day?
Bitcoin continues moving within a very strong correction, a correction that was supposed to be a retrace, but instead, it is many times worse than expected... Or maybe not
Bitcoin or Deadcoin !!In the previous year, the market was bearish, and it now appears to have shifted into a range-bound phase that could continue for at least 3 to 9 more months. The typical sequence is a strong dump, followed by a boring range, after which the market shifts and a new all-time high appears. This patter
FVRP+VFP+IFABTCUSDT — H4 MARKET OUTLOOK
Buyer Control Zone | Bearish Pressure | Volume Confirmation
The BTC H4 candlestick is approaching its close within the next hour. This close could be crucial in determining the next potential market direction.
From my perspective, if the H4 candlestick closes below the
BTCUSDT Bearish Breakdown | Will Bitcoin Hold the $60K Support?🔹 BTCUSDT is showing a clear bearish shift in market structure after facing strong rejection near the 86,000–88,000 resistance and liquidity zone. Price initially moved within a descending channel, forming consistent lower highs and lower lows before breaking below the channel's lower boundary. The
See all crypto ideas
GOLD - Countertrend correction before continued declineIC:XAUUSD remains under pressure from a weak fundamental backdrop: hot CPI, the Fed’s hawkish stance, Trump’s statement on refusing a deal with Iran, and continuous outflows from Western ETFs. PPI is being published today...
Gold’s recovery is fragile. Recovering oil, a strong dollar, and gold
XAUUSD H4 | Liquidity Sweep, Bullish Expansion & Key Resistance XAUUSD 4H – Institutional Price Action, Discount Zone & Potential Bullish Recovery
The current Gold 4H chart presents an important market structure scenario where a prolonged bearish movement has brought price into a significant Discount Zone. The main focus is now on how price reacts around the ma
Gold is Nearing a Strong Resistance Area!Hey Traders, in today trading session we are monitoring XAUUSD for a selling opportunity around 3940 zone, Gold is trading in a downtrend and currently is in a correction phase in which it is approaching the trend at 3940 support and resistance area.
Trade safe, Joe.
DeGRAM | XAUUSD — Bears Are Ready to Strike Again📊 Technical Analysis
● XAUUSD remains under strong bearish pressure after a sharp decline, with price now making a short-term rebound from the lower part of the structure.
● The former support around 3,920–3,930 has turned into a key resistance zone, while the descending support line remains the ma
XAUUSD — Discount Reaction Before Deeper Sell-Side Expansion
Market Structure
XAUUSD remains in dominant bearish delivery inside the descending structure.
Successive BMS events have maintained lower order flow, while corrective rebounds have repeatedly failed to produce a meaningful structural reclaim.
Price is currently balancing around the high-3,880s a
Institutional Market Reversal And Liquidity Engineering BlueprinThis comprehensive technical analysis provides an in-depth breakdown of advanced price action mechanics, market structure shifts, institutional order blocks, and liquidity distributions illustrated on the attached chart, helping traders understand complex multi-timeframe market behaviors.
Resist
GOLD | Premium Rejection and Potential Bearish Continuation.Market Overview :
Gold is currently showing signs of bearish pressure after facing strong rejection from the premium supply region. The recent price action indicates that sellers are maintaining control, while the market continues to develop a lower-high structure. This analysis focuses on market st
XAUUSD – Bearish Market Structure | Key Demand & Liquidity ZonesMarket Analysis
Gold (XAUUSD) is currently showing strong bearish pressure following a rejection from the major resistance zone around 4132–4153.
After failing to sustain bullish momentum near this higher-timeframe resistance, price started forming lower highs and lower lows, indicating a shift in
XAUUSD H4: Below 3,900 - Can Gold Defend 3,730?
Market Context - Weekly Recap
Gold ends the week near 3,885 after another aggressive selloff, reinforcing the broader bearish structure.
At the beginning of the week, buyers attempted to extend the recovery towards 4,140-4,148. However, repeated rejections around major supply triggered a sharp r
Gold 4H: Lower Highs Since 4,755 - Bears in Control Below 3,985Gold has been in a clean 4H downtrend since the August top at 4,755.
STRUCTURE
- Top: 4,755 (Aug 24)
- Lower highs: 4,558 (Sep 3) > 4,440 (Sep 18) > 4,259 (Oct 2) > 4,158 (Nov 9)
- Lower lows: 4,329 > 4,273 > 4,143 > 3,989 > 3,879 > 3,857 (Nov 12)
The early-November rally printed a bullish CHoCH a
See all futures ideas
EUR/USD - Breakout Pattern (12.11.2026)Setup Overview
EUR/USD has broken below the lower boundary of its descending channel on the 4H timeframe, indicating increasing bearish pressure. Price is currently trading below the broken trendline. A potential retest followed by bearish rejection could provide an opportunity for further downsid
EURUSD: Major Support Test | Potential Bullish Reversal
The market is approaching a critical support zone after an extended bearish movement, with price currently reacting around the 1.1044–1.1058 region. The overall market structure remains bearish, as multiple Breaks of Structure (BOS) confirm continued selling pressure. However, the current support a
USDCAD is Nearing a Strong Support Area!Hey Traders, in the coming week we are monitoring USDCAD for a buying opportunity around 1.42200 zone, USDCAD is trading in an uptrend and currently is in a correction phase in which it is approaching the trend at 1.42200 support and resistance area.
Trade safe, Joe.
EURUSD: Latest Price Formation Favors a Return to Lower SupportHello everyone, here is my breakdown of the current EURUSD setup.
Market Analysis
EURUSD previously traded inside a range and an upward channel before entering a wedge structure. Price then tested the Resistance Zone near 1.1100 with breakouts and was rejected, confirming the bearish bias.
Curre
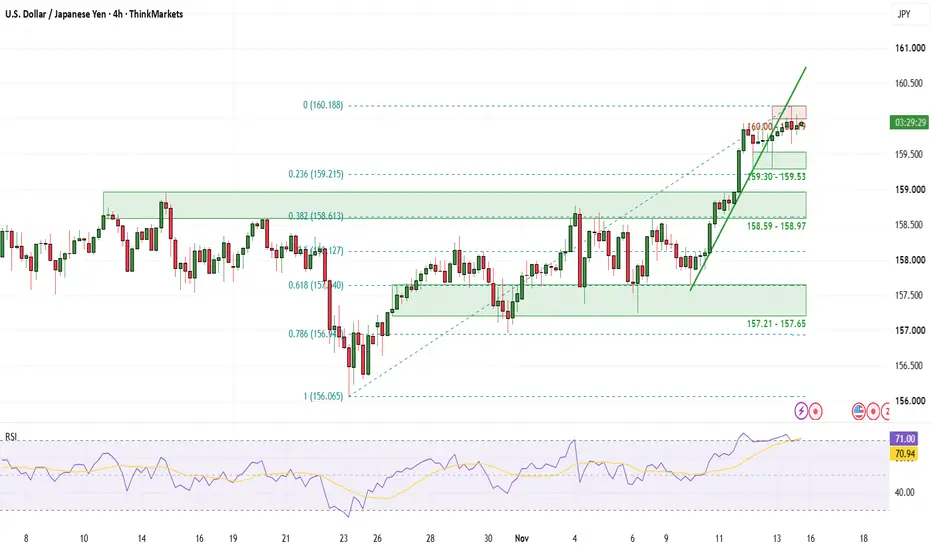
USD/JPY breakout stalls at 160 amid intervention riskFor a month, USD/JPY rallies stalled at the same resistance zone. The 158.59 to 158.97 band capped the pair in mid-October and again several times in early November. On Wednesday, USD/JPY broke above the band, with the 18:00 candle closing at 159.552. The pair reached 160.188 this afternoon, up 2.53
EURUSD 4H: Three Lower Highs, Selling the Supply Into 1.1000EURUSD has been grinding lower all week, and the 4H structure is about as clean as it gets: every bounce is getting sold lower than the last one.
Structure
Three lower highs in a row: 1.1170 on Nov 11, 1.1103 on Nov 12 and 1.1073 on Nov 13. On Friday price broke the 1.1046 low (BOS) and is now trad
GBPUSD | Watching Major Daily Support for Rejection**GBPUSD | NEW WATCHLIST — NOVEMBER 13, 2026**
GBPUSD is approaching a significant Daily support zone around **1.3200–1.3230**, an area that has produced several bullish reactions over recent months.
We're adding this pair to our watchlist as price approaches another potential decision point.
**S
USDJPY - EXHAUSTION AT RESISTANCE
USDJPY shows a structural 🧭 bearish exhaustion as price fails to maintain momentum above the long-term resistance line. Following the breakout from the recent triangle, the pair is currently oscillating at a key liquidity pivot point, signaling potential rejection.
⚡️ Compression at the ceiling s
EURUSD H4 | The Order Block Trap – Bearish Liquidity ExpansionEURUSD H4 | The Order Block Trap – Bearish Liquidity Expansion
📊 MARKET OVERVIEW – BEARISH STRUCTURE IN FOCUS
EURUSD is displaying a notable bearish structure on the H4 timeframe. Recent price action highlights a combination of liquidity sweeps, Market Structure Shift (MSS), Break of Structure (BO
The 212.50 OB Could Decide the Next Move | GBPJPY 14/11🌐 Market Context
GBPJPY is approaching a critical H4 decision area after experiencing a corrective decline from the 213.60–213.75 resistance zone.
The previous bullish expansion was supported by consecutive BOS formations, pushing price from the 207.20 demand region toward the 213.60 highs. Howeve
See all forex ideas
Trade directly on Supercharts through our supported, fully-verified, and user-reviewed brokers.