


Where the world does markets
Join 60 million traders and investors taking the future into their own hands.
Explore featuresExplore featuresExplore features
SILVER TO $750 IN THE NEXT DECADE ?This has to be the biggest Cup & Handle Formation in Human History. Holy Smokes.
Ok, let's dive into the Fundamentals:
1) Industrial Demand: Silver is essential in various high-growth industries such as electronics, solar energy, and medical devices. As technological advancements continue, the dem

ON Semiconductor - betting on corrective UT rallyOn Semi conductor's selling has been weakened since Nov 23 and the larger falling wedge is pointing towards a larger bullish reversal pattern. First the cup and handle is close to a completion and will confirm the pattern once it breaks above US$72.84 resistance.
Volume is low but is a potential s

Nvidia Q1 25 earnings preview – will the Kraken awake?Due to report shortly after market close on 22 May (typically 06:20 AEST / 21:20 UK).
“The most important stock in the world” - That was the label given to Nvidia (NVDA) throughout February as we geared up for its highly anticipated Q424 earnings results. Where, at the time, the sheer number of a

Gold Price (XAU/USD) Is Testing an Important Resistance ZoneGold Price (XAU/USD) Is Testing an Important Resistance Zone
On April 16, we wrote why the $2,380 zone is an important resistance area.
The XAU/USD chart shows that:
1) After fading fluctuations (they formed a narrowing consolidation triangle - shown in green), the price of gold dropped sharply

XAU/USD 13 May 2024 Intraday AnalysisH4 Analysis:
Bias/Analysis remains the same as analysis dated 12 May 2024.
-> Swing: Bullish.
-> Internal: Bullish.
Price has printed a bullish BOS.
After bullish BOS expectation is for price to pullback.
We have nested Daily and H4 supply levels where price is expected to initiate pullback.

GameFi, Blockchain games, Top projectsGameFi
GameFi is a combination of gaming and decentralized finance that combines blockchain technology, NFT (non-flammable tokens), DeFi (decentralized finance), and the play-to-earn (P2E) model to create a unique gaming experience. This innovative approach lets players enjoy the game and earn real


Trading opportunity. What to buy?In the crypto market, the largest assets are currently experiencing similar situations.
On the charts, we can see that six assets have formed sideways trends. Prices for all six assets are currently at the bottom of these sideways trends. For four assets, the price temporarily dropped below the lo

Why will Ethereum drop toward 2500 levelLiquidity is slowing off Etherum toward Bitcoin as show on the ETH/BTC pair
structure at lower timeframe is respecting the 50% fib level and also trending downward inside the channel , as it repeats is similar pattern!!
Thank you for watching
Follow me for more crypto analysis

See all editors' picks ideas
Gamestop- Idiosynchratic Systemic RiskThe rise and fall of GameStop's stock in 2021 became a landmark event in financial history, captured in the recent film "Dumb Money." This saga, fueled by unprecedented social media buzz and retail investor sentiment, culminated in a historic short squeeze and raised critical questions about market

Intel trap is set IMO. Maybe a 5% pump here??The area around $14-16 looks like a place I might want to jump in BUT I DOUBT I WILL!!
NOT FINANCIAL ADVICE!!!

AMD correction is over. Buy for the long-term.Back on March 13 (see chart below) we gave a bold (for the majority of the market) sell signal on Advanced Micro Devices (AMD), as we saw the stock topping at the top (Higher Highs trend-line) of its 2-year Channel Up:
Our signal was delivered and the price corrected significantly by -37% and h

things may get spicy soon 🌶️🚀boost and follow for more 🔥 GME had a trend resistance zone break, retest, short trap below local support zone as the retest happened as well.
I Like what I'm seeing, my moon senses are tingling ;) looking for a explosive rally to 30-40-58 once we can close above 19.74 long trigger 🎯

Riot Platforms, Inc. to $1000 / 100xOn the above 8-day chart price action has corrected 95% from $80 in early 2021. A number of reasons now exist to be consider a long position. They include:
1) Price action and RSI resistance breakouts.
2) Price action confirms trend reversal. Higher highs higher lows.
3) Price action confirms sup
Short to 861 - no lines neededThis is doomed. Always dangerous to short NVDA, but if we get a break below 894 in the next day or two I'll buy puts with target 861 by end of May (nice 30 point drop).
Could go a lot lower. I'm going to leg into puts before the bell and then add bigger if we get the break below 894.
Had a great r

The Stock Price of Pepsico Is Retracting from Its Yearly HighThe Stock Price of Pepsico (PEP) Is Retracting from Its Yearly High
On April 23, the quarterly report of PepsiCo's performance for the first quarter was published, which was awaited anxiously.
The issue stemmed from the fact that in December 2023, the U.S. Food and Drug Administration (FDA) annou

GME About To WaterfallGME SAVE THE TAPE!
Back in June 2021, I warned people to GTFO out $GME when it was trading at $212 Today it trading at $20
and about to waterfall again. Despite my several follow-up warnings over the last year and a half people
continue to fight me on this. SMH!

golden cross on amc is in the works... the bull run begins.huge moves are coming, huge gains will be made. patience, and dont be overleveraged. goodluck guys

Nvidia - Still a correction?Hello Traders and Investors, today I will take a look at Nvidia .
--------
Explanation of my video analysis:
Over the course of the past seven years, Nvidia stock has been trading in a pretty obvious rising channel formation. As we are speaking, Nvidia stock is approaching once again the upper

See all stocks ideas
Community trends
SMCI
Super Micro Computer, Inc.CB
Chubb LimitedA
AWIN
AERWINS Technologies Inc.DELL
Dell Technologies Inc.FFIE
Faraday Future Intelligent Electric Inc.MSTR
MicroStrategyCSCO
Cisco Systems, Inc.COIN
Coinbase GlobalE
EDBL
Edible Garden AG IncorporatedAMD
Advanced Micro Devices IncGamestop- Idiosynchratic Systemic RiskThe rise and fall of GameStop's stock in 2021 became a landmark event in financial history, captured in the recent film "Dumb Money." This saga, fueled by unprecedented social media buzz and retail investor sentiment, culminated in a historic short squeeze and raised critical questions about market
Intel trap is set IMO. Maybe a 5% pump here??The area around $14-16 looks like a place I might want to jump in BUT I DOUBT I WILL!!
NOT FINANCIAL ADVICE!!!
AMD correction is over. Buy for the long-term.Back on March 13 (see chart below) we gave a bold (for the majority of the market) sell signal on Advanced Micro Devices (AMD), as we saw the stock topping at the top (Higher Highs trend-line) of its 2-year Channel Up:
Our signal was delivered and the price corrected significantly by -37% and h
things may get spicy soon 🌶️🚀boost and follow for more 🔥 GME had a trend resistance zone break, retest, short trap below local support zone as the retest happened as well.
I Like what I'm seeing, my moon senses are tingling ;) looking for a explosive rally to 30-40-58 once we can close above 19.74 long trigger 🎯
Riot Platforms, Inc. to $1000 / 100xOn the above 8-day chart price action has corrected 95% from $80 in early 2021. A number of reasons now exist to be consider a long position. They include:
1) Price action and RSI resistance breakouts.
2) Price action confirms trend reversal. Higher highs higher lows.
3) Price action confirms sup
Short to 861 - no lines neededThis is doomed. Always dangerous to short NVDA, but if we get a break below 894 in the next day or two I'll buy puts with target 861 by end of May (nice 30 point drop).
Could go a lot lower. I'm going to leg into puts before the bell and then add bigger if we get the break below 894.
Had a great r
The Stock Price of Pepsico Is Retracting from Its Yearly HighThe Stock Price of Pepsico (PEP) Is Retracting from Its Yearly High
On April 23, the quarterly report of PepsiCo's performance for the first quarter was published, which was awaited anxiously.
The issue stemmed from the fact that in December 2023, the U.S. Food and Drug Administration (FDA) annou
GME About To WaterfallGME SAVE THE TAPE!
Back in June 2021, I warned people to GTFO out $GME when it was trading at $212 Today it trading at $20
and about to waterfall again. Despite my several follow-up warnings over the last year and a half people
continue to fight me on this. SMH!
golden cross on amc is in the works... the bull run begins.huge moves are coming, huge gains will be made. patience, and dont be overleveraged. goodluck guys
Nvidia - Still a correction?Hello Traders and Investors, today I will take a look at Nvidia .
--------
Explanation of my video analysis:
Over the course of the past seven years, Nvidia stock has been trading in a pretty obvious rising channel formation. As we are speaking, Nvidia stock is approaching once again the upper
See all stocks ideas
SymbolPrice & chgMarket cap
SymbolMarket cap / Price
SymbolPrice & chgEmployees
SymbolEmployees / Price
SPY: Week of April 13Hey everyone,
Going into next week, it seems like we my start with selling first.
Going into Monday probability is particularly bearish.
Based on the assessment of the week it actually seems like we can expect dramatic moves in both directions, so if we head down first, I would expect the CPI cat

TGR pt.2 - SPY vs. gravityThis chart uses symmetric trajectories from the early distribution phases to estimate the path price will take to initiate markdown.
Initial target = 506-508. If SPY finds resistance at 516 then the initial target could hit by the end of this week (5/10). If SPY breaks above 516 it should find res

Bearish cypher by AD/MONEY FlowAD running a bearish cypher pattern on the 4hr. Also money flow/AD peaking with price action. Price action also hit my 1.618 fib level which is bearish. Money Flow and AD needs to breakout above b leg, however the down trend looks In tact. Short term bearish outlook.

Long SQQQ 9.95Target 12
As you can see, SQQQ RSI (9) never has been so low in this time frame ....8
Market is ultraoverbought and I expect a huge reversal.
Regards,

$SPY May 15, 2024AMEX:SPY May 15, 2024
15 Minutes
The SPY is not retracing. It is resolving divergences and aligning moving averages through sideways movement.
Now as expected once 522.75 was crossed we are back in business.
I will consider two numbers.
The rise from 515.15 to 532.582 and 520.56 to 523.82.
Mai

US Small Caps ContinuationSurprised to see IWM fairly restrained in this upward trend as long term interest rates dropped significantly on todays CPI report. Really expect to see a quick catchup over the next few days as SPY and QQQ make new highs.

SPY Short 3-8% Correction I Don't Think So Goo Long Bull RunThe correction??? In my opinion and chart theory suggest its time to go long and find the proper to stocks to be in
Subscribe for update stock pick and the best sectors to be in so your not left behind!!
as for todays daily chart set up I suggest calls at least a week out as chart indicates
Goodluc

Rising supply could act as a headwind for uranium pricesThe price of uranium, known as yellow cake, has more than doubled in the past year amid a significant imbalance between supply and demand in the global market, sending uranium-related assets soaring to the sky. In addition, the return of Japanese appetite for carbon-free energy and the restart of tw

QQQ Potential Paths Moving ForwardQQQ made a new ATH today and may close even higher. I think it will run up until it retests its ascending channel from earlier in the year.

$SPY Triple Top...AMEX:SPY getting spicy here, looks like a triple top for now headed into a lot of world news, ie Iran/Israel/Biden ... I think we've been overdue for a correction, this is a VERY solid base to start a downtrend and fill some gaps before heading back up for Trump Presidency... Buy the rumor stuff...
See all ETF ideas
Community trends
IBIT
iShares Bitcoin TrustSLV
iShares Silver TrustTLT
Ishares 20+ Year Treasury Bond ETFTMF
Direxion Daily 20-Yr Treasury Bull 3x ShrsTQQQ
ProShares UltraPro QQQBITX
Volatility Shares Trust 2x Bitcoin Strategy ETFBITO
ProShares Bitcoin Strategy ETFGBTC
Grayscale Bitcoin Trust (BTC)SOXL
Direxion Daily Semiconductor Bull 3x SharesVOO
Vanguard S&P 500 ETFSymbolPrice & chgNAV total return 1Y
SymbolNAV total return 1Y / Price
SymbolPrice & chgDividend yield FWD
SymbolDividend yield FWD / Price
Bitcoin Fail in the ⚔️Third Attack⚔️ on the Resistance zone⚠️First, I must say that the Consumer Price Index(CPI) rates will be published today ( so be careful about your positions when they are published ).
🏃♂️ Bitcoin is currently moving in the 🔴 Resistance zone($63,440-$62,690) 🔴 (this is the third time it has attacked this zone).
🌊According to

🅱️ Expert Confirms: Bitcoin Set To Crash Below 30KSignals are available everywhere... And new data is coming in all of the timing.
The market is great.
Even though we get confirmation after confirmation, doubts still creeps in.
Even though we see the market moving just as we would expect it to move based on the cycle, sentiment and chart signals;

BNB Coin's Journey to Major Resistance After a Parabolic Surge
After experiencing a parabolic increase of 200% over 200 days, BNB coin has now reached a significant resistance zone ranging from $616 to $660.
Current Market Perspective:
Given the current conditions and Bitcoin's behavior, a correction and consolidation period for BNB is highly likely. For thos

BTC Big move soon and Ask about your altcoins !BTC / USDT
BTC has printed big falling wedge
and the chance for big breakout is high however more corrections and final shakeout can also happen
The bottom about to be formed
So Keep accumulating BTC and strong altcoins and enter market partially
In meanwhile you can ask about your favorite alt

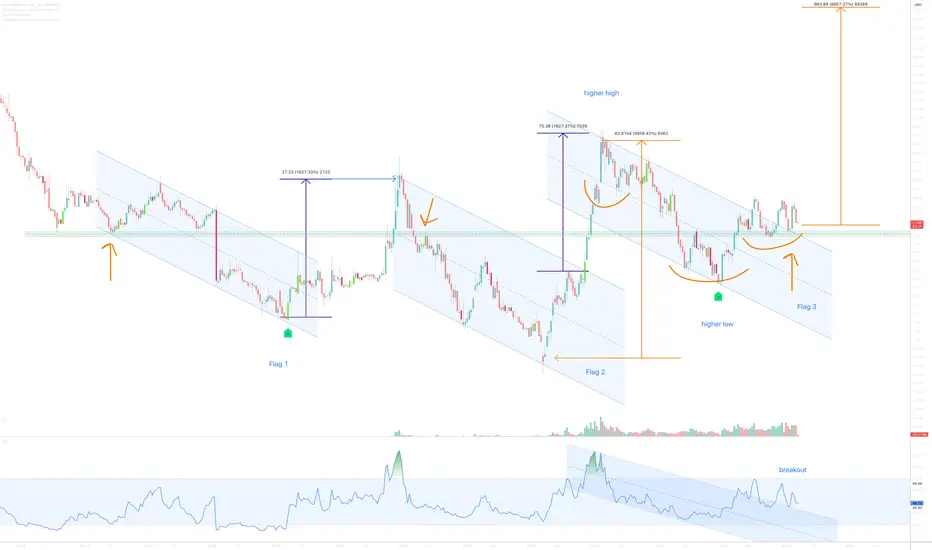
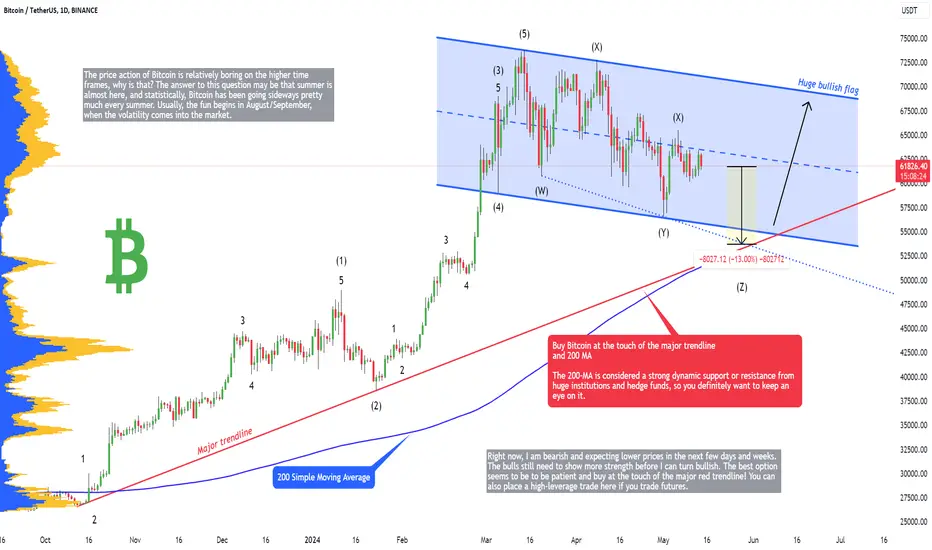
Bitcoin - Ultimate bottom will be here, but now 13% crash!The price action of Bitcoin is relatively boring on the higher time frames, why is that? The answer to this question may be that summer is almost here, and statistically, Bitcoin has been going sideways pretty much every summer. Usually, the fun begins in August/September, when the volatility comes
🔥 Bitcoin Inverse Head & Shoulders! New All-Time High Soon 🚀Over the last week or so I've made a few posts on Bitcoin's inverse head & shoulders pattern, which is a bullish reversal pattern.
In my initial post below I expected the reversal to come in earlier, but apparently we first had to go down more before the right shoulder was completed.
As of now,

The cyclic nature of Bitcoin's price Hello, dear friends! Much has been said about Bitcoin cycles, and you've seen many charts, including mine! But today, I'll summarize everything that has been said before: briefly and clearly!So...
What Defines the Bitcoin Market Cycle?
The Bitcoin market cycle signifies the repetitive trend of p

BITCOIN → Why did it drop to 60K? When do we expect 75K?BINANCE:BTCUSDT has been showing bullish prospects all week and has been consolidating above key zones, preparing to go higher, but on Friday the market changed to bearish and there is a reason for that.
BTC lost 3.3% on Friday and is currently painting a bearish picture. There are two reasons

Request Any Instrument - Celebrating 3k Ideas on TradingView🎉Hello TradingView Family / Fellow Traders. This is Richard, also known as theSignalyst.
🎉I am thrilled and grateful to announce that we have reached 3,000 ideas on this amazing platform.
Your support, engagement, and feedback have been invaluable in making this possible. It is an honor to be part

Aevousdt Trading ideaAEVOUSDT is currently displaying signs of a potential falling wedge formation, with the price exhibiting a pronounced downward movement towards a slanting downtrend trendline. We have identified a potential ending point for the wedge pattern, coinciding with a major demand zone suitable for accumula

See all crypto ideas
Community trends
FTMUSDT
Fantom / TetherUSNEARUSDT
NEAR / TetherUSSOLUSDT
SOL / TetherUSB
BOMEUSDT
BOME / TetherUSSOLUSD
SolanaA
AEVOUSDT
AEVO / TetherUSPEOPLEUSDT.P
PEOPLE / TetherUS PERPETUAL CONTRACTSEIUSDT
SEI / TetherUSONDOUSDT.P
ONDO / TetherUS PERPETUAL CONTRACTGRTUSDT
GRT / TetherUSSymbolPrice & chgMarket cap
SymbolMarket cap / Price
SymbolPrice & chgTVL
SymbolTVL / Price
GBPUSD - 4hrs ( Most Accurate buy and sell area's / Tp 250 PIP )Pair Name : GBP/USD
🗨Time Frame : 4hrs Chart / Close
➕Scale Type : Large Scale
------
🗒 spreading knowledge among us and to clarify the most important points of entry, exit and entry with more than 5 reasons
We seek to spread understanding rather than make money
✔️ Key Technical / Direction (

EURUSDHello traders ,what do you think about EURUSD?
This currency pair has reached the ceiling of the channel and a resistance zone. It is expected that after a correction to the specified zone, it will grow at least to the specified level.
If this post was useful to you, do not forget to like and commen

SELL EURUSDAhead of CPI I am looking to short EURUSD, my targets are below 1.07000 stops above 1.086 area. Use proper risk management. The box shapes drawn on my chart are from GOLD BACH. If you want to learn about it let me know. Cheers

🤟EURUSD: New MULTITIMEFRAME analysis is here🤟☝️Do not act based on my analysis, do your own research!!
The main purpose of my resources is free, actionable education for anyone who wants to learn trading and improve mental and technical trading skills. Learn from hundreds of videos and the real story of a particular trader, with all the mistak

EURUSD Broke out the main trend amidst soft cpiHey Traders, in today's trading session we are monitoring EURUSD for a buying opportunity around 1.08350 zone, EURUSD was trading in a downtrend and successfully managed to break it out. Currently is in a correction phase in which it is approaching the retrace area at 1.08350 support and resistance

EURUSDWe are going short on this pair. we wat for the pair to take out the previous momentum at 1.085 we have a Break of Market structure. waiting for 1.085 to go short

USDCAD → Weak dollar. Currency pair in the correction phase FX:USDCAD is declining on the back of a weak dollar index and breaking the support of the descending triangle, which generally allows bears to dominate the market. The price may go down to 0.355
The uptrend is not broken, a correction is forming after a retest of resistance. A descending triangle

MY ONGOING EURUSD TRADE BEFORE CPI + CPI ENTRYI had an ongoing trade before CPI, then added another position after CPI... My trades are based on structure and liquidity. I'll give an update on the outcome...

Lingrid | AUDUSD trend CONTINUATION formationThe price perfectly fulfilled my last idea, and it went down to support level and hit the target. FX:AUDUSD has broken through the triangle formation, a classic trend continuation pattern, and it is now making higher highs and higher lows. The market is persistently testing the resistance zone at

AUDUSD DAILY SETUP Hello, traders here is a setup of AUDUSD as you can see the market has broken the resistance zone that the market has tested multiple times in the past and now I will wait for a pullback and then look for bullish opportunities afterward.

See all forex ideas
16+HR/DAY CONTINUOUS GOLD FORECAST, CPI-PPI 80-POINT FAT M!!Intro - Saturday I published first draft with "regular M". Before Sunday open, I thought it should be - in the words of the crypto guys who named it originally - "big-dick M". Within 2 hours of Sunday open I knew it was just regular looking M. Monday, price spent too much time going flat at 2336

GOLD MARKET UPDATEHey Everyone,
Another PIPTASTIC day on the chart today buying dips all the way into our Bullish target!!!
After completing the retracement range earlier this week, we got the bounce into 2357 yesterday followed with the lock above 2357 opening the 2389 bullish target once again.
- This played ou

Gold 🟡 | Bullish Movement Towards 2400?Gold was on a downtrend, but now, following the break of this downtrend line and considering the bearish trend of the dollar index and important news today, we could expect a bullish move towards 2400 - 2417. 📈

SILVER TO $750 IN THE NEXT DECADE ?This has to be the biggest Cup & Handle Formation in Human History. Holy Smokes.
Ok, let's dive into the Fundamentals:
1) Industrial Demand: Silver is essential in various high-growth industries such as electronics, solar energy, and medical devices. As technological advancements continue, the dem
GOLD → Will the bullish sentiment persist after the news?FX:XAUUSD is growing and testing local descending resistance. Growth is associated with the decline in the dollar index on the background of Powell's comments. Ahead of the news on inflation...
Technically, on H4 the price overcomes the correction phase and returns to the bullish rut, testing th

⭐️ XAU/USD : CPI is coming , Bull or Bear ? (READ THE CAPTION)By analyzing the gold chart in the 2-hour timeframe, we observe that after the price drop to $2332, there was a demand surge, allowing the price to rise to higher levels as expected. After the price entered the Bearish BB zone at $2372, we saw a price drop to $2368. Currently, the price is trading a

THE KOG REPORT - Update (BOOM)End of day update from us here at KOG:
Yesterday we suggested looking for the support level to hold and the move to the upside should continue. While CPi was looming we identified the regions we wanted to target and although the support level fell just short, we got a move up again from the order

GODL - will continue his bull run? Or not?#GOLD.. market reached at his 3 weeks high.
There is only one area that is 2392 93 around.
So guys keep close it because it's final hope for sellers.
It will be your key level in today and swing level as well.
If market hold it, in that case any kind of selling expected with supporting area of 237

XAUUSDHello traders ,what do you think about GOLD?
After breaking its trend line, gold has now reached the resistance zone of 2400. It is expected to grow at least up to the specified level after the pullback to the broken trend line.
If this post was useful to you, do not forget to like and comment.❤️

GOLD Will Move Lower! Short!
Here is our detailed technical review for GOLD.
Time Frame: 12h
Current Trend: Bearish
Sentiment: Overbought (based on 7-period RSI)
Forecast: Bearish
The market is on a crucial zone of supply 2389.250.
The above-mentioned technicals clearly indicate the dominance of sellers on the market. I r

See all futures ideas
The INFAMOUS Blow Off Top!!! US10Y US02Y $TLTThe indicators from this chart which backtested to call the 1990s Gulf War recession, the Thai Baht, the 1998 LTCM, the 2000 dotcom bubble, the great financial crisis, and the COVID pandemic all before they officially happened. It is calling for whatever this next crisis is going to be called. I pla

US10Y - US Ten Year Yields WeeklySome weekly consolidation; Possible yields haven't topped yet. These inflection points lead to weekly and monthly trend changes which I will be looking for a potential spike as momentum shifts back down and rates test the keltner channel mid or upper line. There is also a possibility that rates brea

Rates are breaking recent up trends, $TNXGood Morning Everyone!
The 2Yr Yield is retesting the recent support level, highlighted by arrows.
The 10Yr #yield is currently breaking the recent uptrend.
The yellow box was highlighted in the last post showing the WEAKNESS. However, forgot to speak on that yesterday (see profile for more info).

US 10Y TREASURY: watch for CPIMoves in Treasury yields during the previous week are showing that the market has already priced all known information, and waiting for new ones in order to decide on a further action to the up or downside. The 10Y Treasury benchmark was moving between levels of 4.51% down to 4.42% on one occasion.

US10Y - Take Note Of 4.549%Lows of 4.420% was printed this trading week with minimal draws to buyside liquidity as yields had been trading within the weekly fair value gap.
Intraday-week market structure shift occurred during Thursdays US AM session before a minor retracement below consequent encroachment @ 4.458 ensued.

US30Y headed up back to 5%?US30Y headed ⬆️ to 5%? If it breaks above 4.83%, then most likely it'll explore the further premium areas of the range.
US30Y is currently doing a very methodical climb up, as compared to a very rapid fall post Nov 23. This should be fun to watch! 🤩

What would happen if the US 10-year Treasury yield rose to 20%? What would happen if the US 10-year Treasury yield rose to 20%? The clear five-wave pattern in bond yields is causing concern.

UK Bond Steps and ForcesThis is my perspective on the forces that might apply on the UK 10Y Gilt. It can climb along the red rectangles to fall down to the big green or if the first red rejects it or the bottom arc attracts it, we might see support in that area. The vertical green is a special one where unusual or special

Huge potential implications from YIELD SPREADS (US10y-DE10y)Folks know how I feel about very long term (multi year/decade+) outlook for inflation and yields - they are going higher.
And I have called for higher yields (and spreads) and thus dollar so far this year.
BUT BUT BUT
The yield spread chart is suggesting a potential divergent high which could hav

US 10Y yield key support under pressureWe suspect that the US 10Y yield chart has topped short term having tested and again failed at its previous uptrend at 4.74 (which is now acting as resistance) . Please see the weekly chart.
This throws the spotlight on key nearby support where we find a short term uptrend, last week's low, the 55-

See all bonds ideas
Trade directly on the supercharts through our supported, fully-verified and user-reviewed brokers.


